







S&P 500 mean reverting strategy
Dear all,
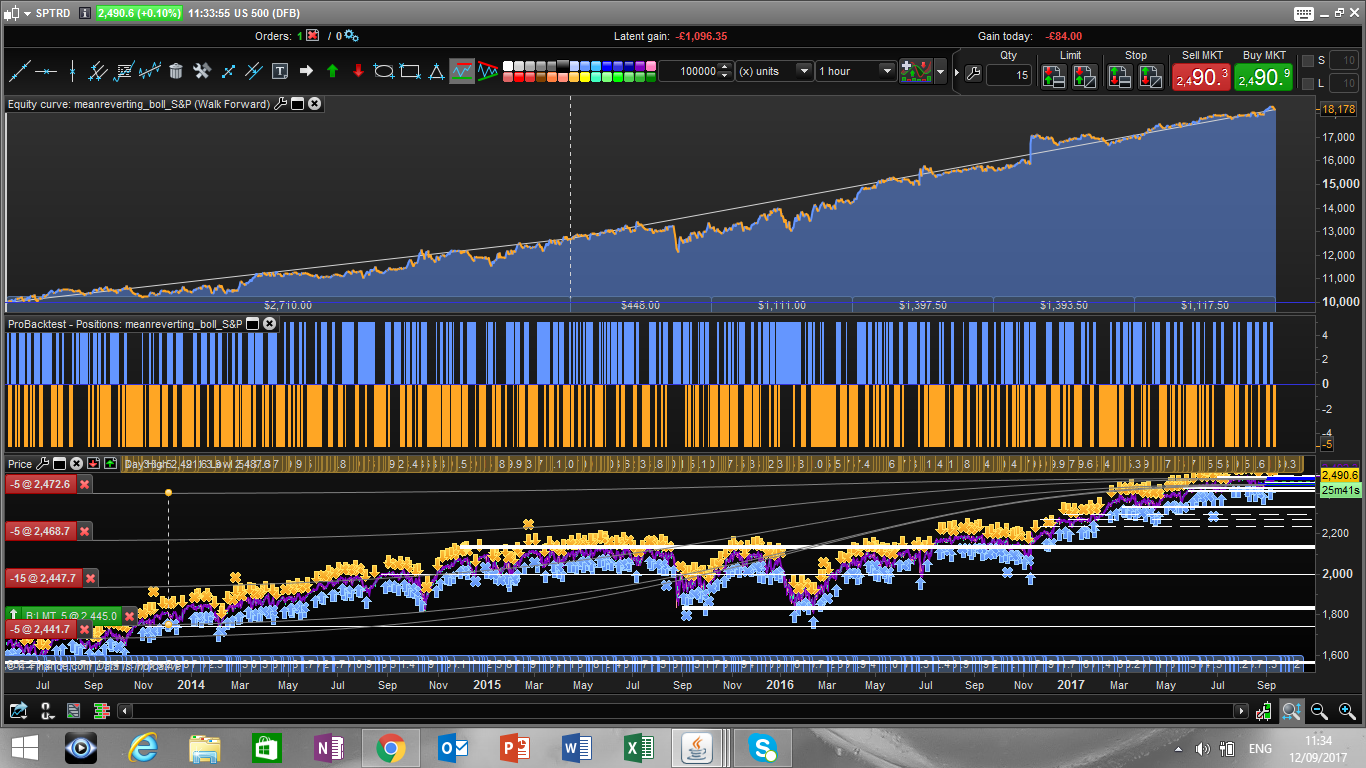
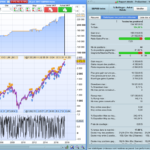
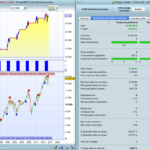
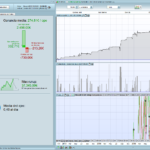
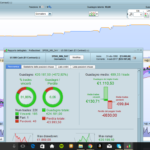
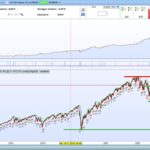
pls enjoy this little code which gives very nice results on S&P 500.
There are only 2 variables optimized (the bollinger bands and the moving average periods) , can work with several underlying.
Best regards
Francesco
// Definition of code parameters
DEFPARAM CumulateOrders = False // Cumulating positions deactivated

//optimized parameters
bbperiod = 30
averageperiod = 180

bollup = BollingerUp[bbperiod](close)
bolldown = BollingerDown[bbperiod](close)
cl = (close >= bollup)
cl = cl AND (open >= bollup)
cs = (close <= bolldown)
cs = cs AND (open <= bolldown)

IF cs THEN
 buy 5 PERPOINT AT MARKET
ENDIF

if cl then
 sellshort 5 perpoint at market
endif

// Conditions to exit short positions
aver = Average[averageperiod](close)
c1 = (close CROSSES under aver)
c2 = (close CROSSES over aver)
IF c1 and longonmarket THEN
 sell AT MARKET
ENDIF

if c2 and shortonmarket then
 exitshort at market
endif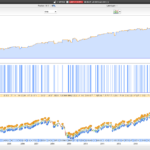
Comments
You must be logged in to post a comment.


Hi Danibo, I am not sure I undesrtand your question, you simply need to run a backtest on PRT using US 500 CFD. I am using a uk version of IG but you will find the same index on every platform.

The close at MA condition does't make much sense as this strategy will stay in market until a position is opened in the opposite direction. Try changing the exit condition to for long positions CLOSE > BOLLup and for short positions CLOSE < BOLLdown. This will give similar results to the original strategy. In my opinion this is the typical kind of strategy that has benefitted from the combination of QE and increased algorithmic trading activity in markets. The latter provides added short-term liquidity to market while QE adds long-term liquidity, the combination contributing to a trend towards lower risk premia. I would not want to keep trading this strategy when global QE reverses, or when global economic growth stutters. Many thanks for an interesting contribution! It did challenge me to some exploratory work.

Nice analysis, with the proposed tweak I'm seeing great performance since 2008/QE on the CAC40 Daily; not so good prior to that.


Hi robdav, yes Im running it live since I posted it. Backtest/WF was for the last 3 years. I havent re tune it, I think I will do so every 6 months
hi Rejo007. I havent tested since 2007 but I am not surpised that this stratrgy doesnt perform well im 2007 2008 and 2009 as they were very trendy. As a general rule I think one should have in the portfolio a combination of strategies, some mean reverting and some breakout

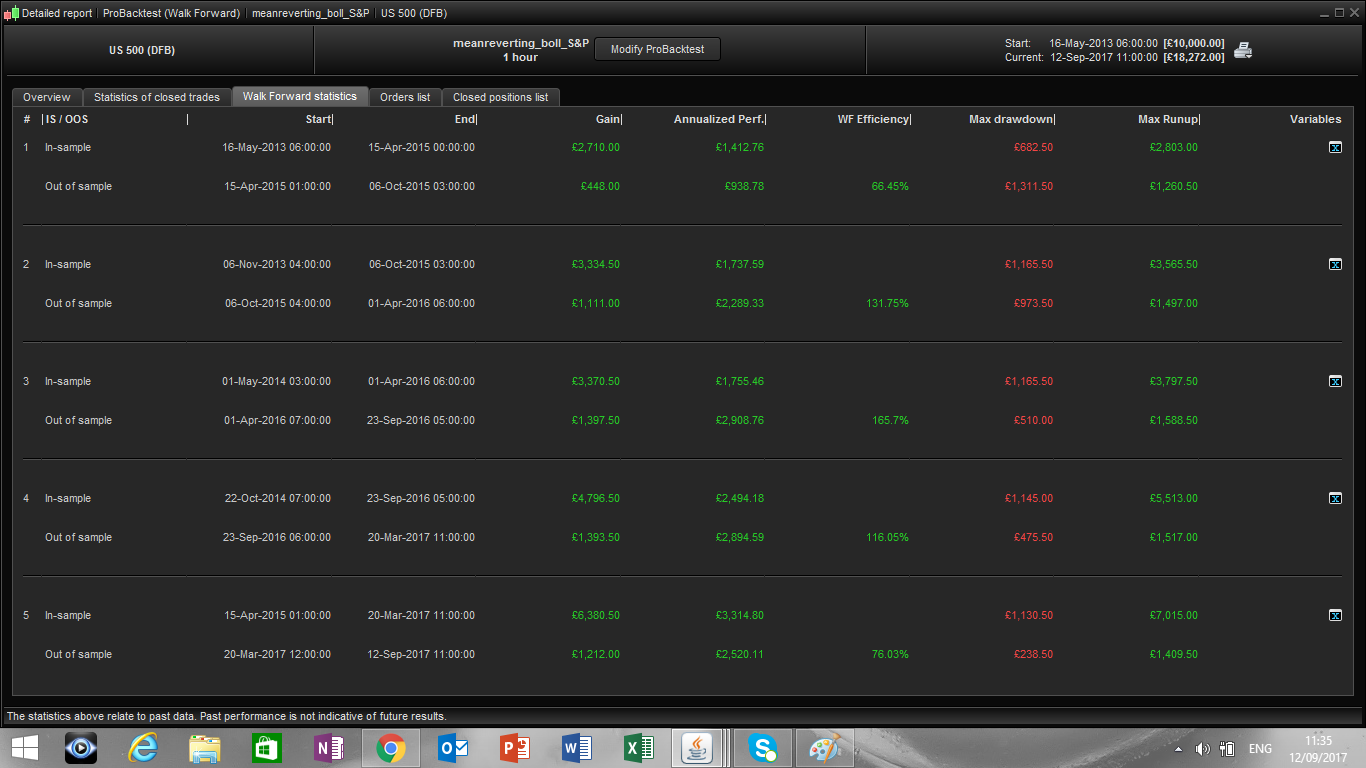
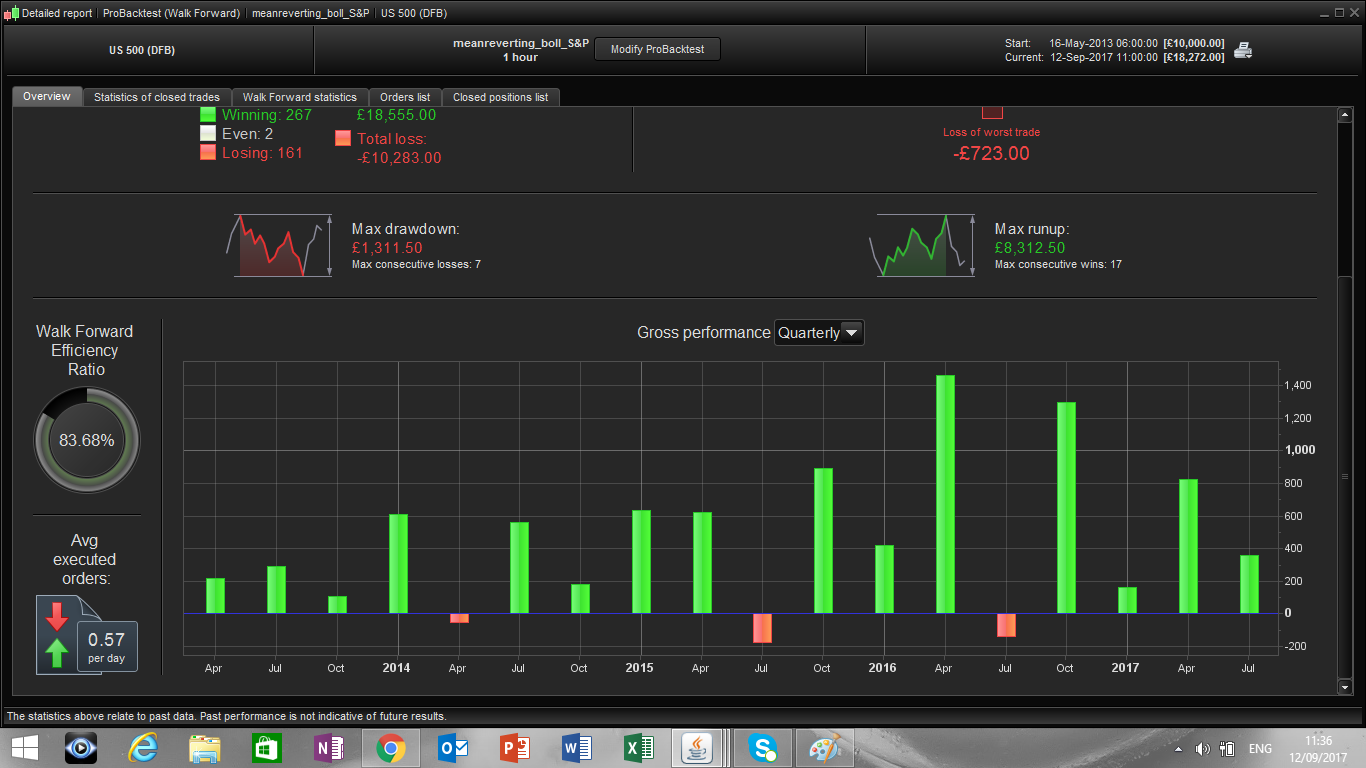
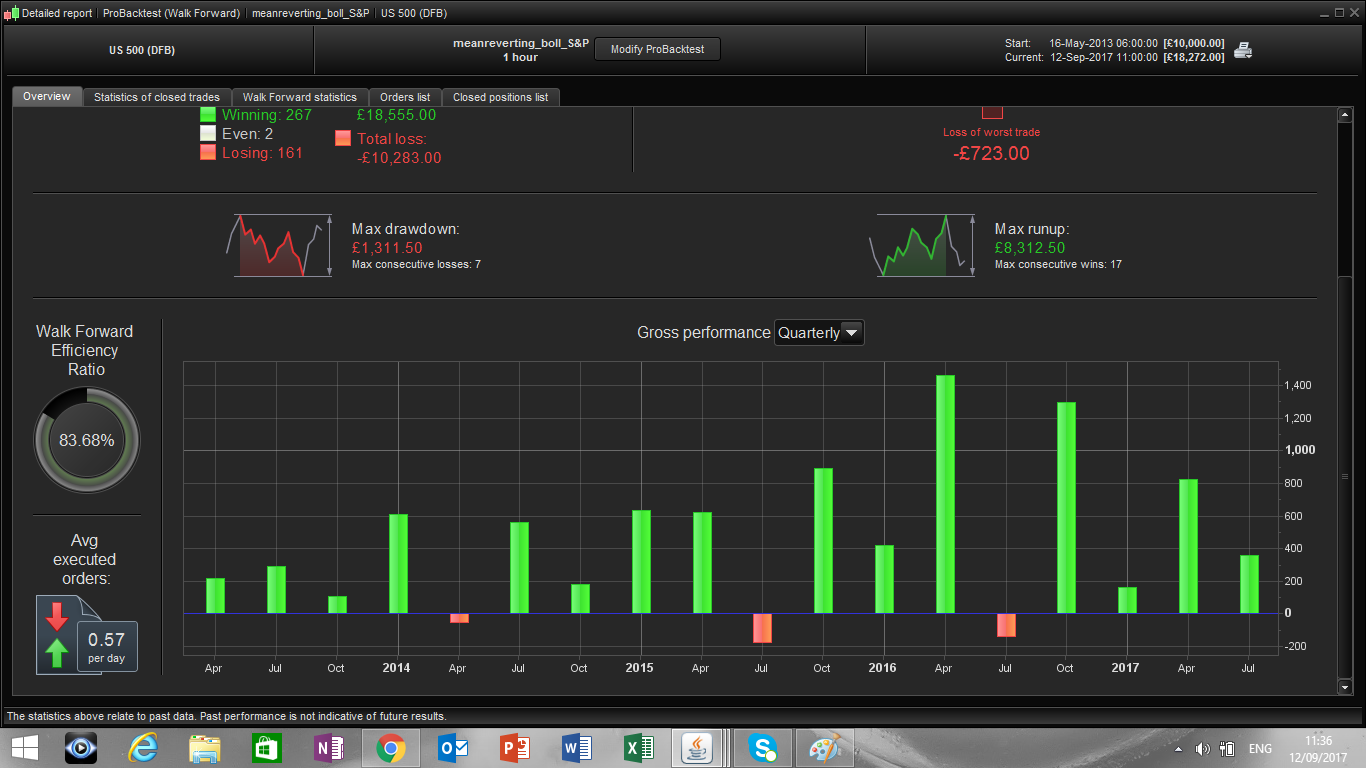

I prefer test a strategy for a while but i understand your point of you.. When you decide to stop the system? When it exceed the max drawdawn of the backtest?
real. I never used a demo account.
Do you test it on a Demo or Real account?
Hi Giorgio! thank you. Relatively to this last strategy, it simpli take long or short position if the candle is fully above or below the bolliger band defined by bperiod and it closes the position when the price touches the average defined by averageperiod. Hope this help
Hi Francesco, I'm Giorgio nice to meet you, I've been following you and your work for some time and i think that are really interesting what you are doing, can you explane me how does it function? I'm little confused about the operation Thanks so much
thank you Janwd. Do you mind sharing where it works? happy new year!