Hi all,
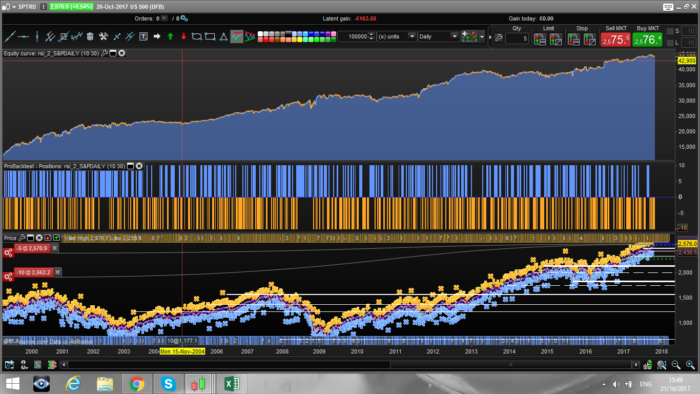
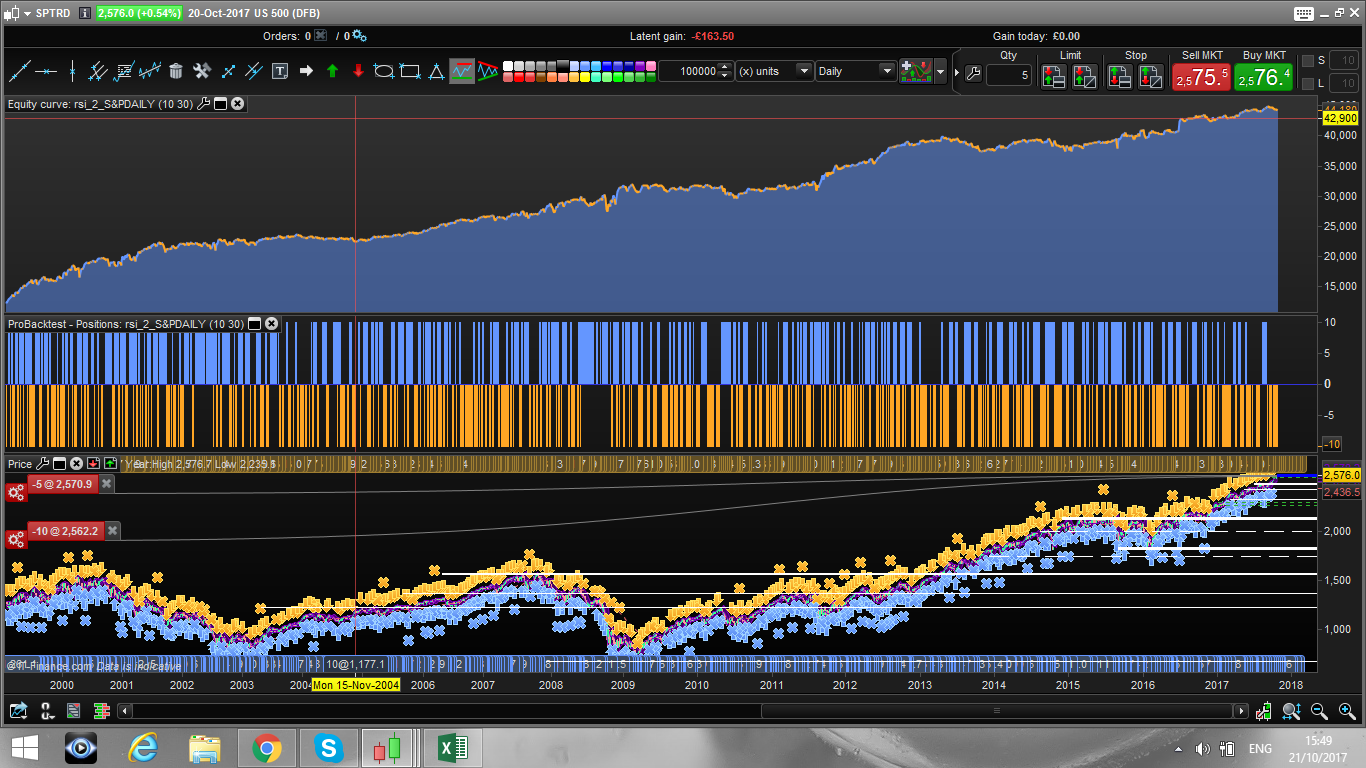
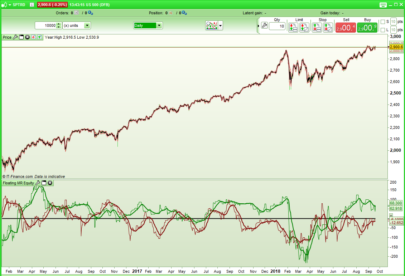
Have a look to this daily strategy on S&P 500. I guess many of you already know it, as it is made very famous by Larry Connors, I just added a bit of asymmetry between long and short, but the code is still extremely light, with only 2 parameters optimized and a stable performance of over 20 year!
|
1 2 3 4 5 6 7 8 9 10 11 12 13 14 15 16 17 18 19 20 |
defparam cumulateorders = false cl = RSI[2]<a cs = RSI[2]>100-a if cl then buy 10 contracts at market endif if cs then sellshort 10 contract at market endif if longonmarket and RSI[2]>100-(a+b) and close < open then sell at market endif if shortonmarket and RSI[2]<(a+b) then exitshort at market endif |
Share this
No information on this site is investment advice or a solicitation to buy or sell any financial instrument. Past performance is not indicative of future results. Trading may expose you to risk of loss greater than your deposits and is only suitable for experienced investors who have sufficient financial means to bear such risk.
ProRealTime ITF files and other attachments :
Find other exclusive trading pro-tools on ![]()
PRC is also on YouTube, subscribe to our channel for exclusive content and tutorials


hi Francesco,
the variables a and b are missing !!
thanks for clarify it
a = 10 b = 30, if you run the optimization this is what you will get
I’m a big fan of anything with Larry Connors on the SP500 with RSI[2]. I notice that your exit criteria are different for long and short positions. A long position needs a down candle to exit but the short positions exit on up or down candles. Can you explain any logical reasoning behind this or is it just something that seemed to work better?
Hi Vonasi. The logic is based in the fact that the market has a bias to go up. This asymmetry allows long positions to have an “advantage” over short positions.
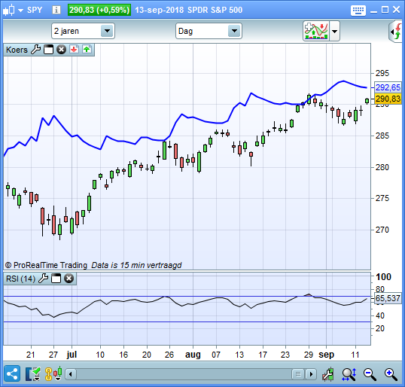
It seems that buy and hold outperforms this strategy. Removing the short side of the strategy (I’m not keen on shorting indices especially the SP500) results in close to buy and hold performance without the amount of time in the market and far less volatility in the equity curve. Not many trades though. Settings of 15 and 35 seem to be optimal for this.
HI. My first post on PRC. I tied this on UKX I am limited with 2500 bars, but the results looked very good.
Nice strategy! Really like the stuff you are posting. Although the performance on the short side is quite bad when in raging bull markets. So try out my favourite filter; close > close[180] (or anywhere between 100-250) for longs and opposite for shorts. Greatly reduces drawdown 🙂
hi Robin, thank you for yiur comment. Would you mind to post the exact modification to the code that you make? Id love to test it. have a great day.
Here you go! Would like to hear your feedback 🙂
cl = RSI[2]100-a
if cl and close > close[180] then
buy 5 contracts at market
endif
if cs and close 100-(a+b) then
sell at market
endif
if shortonmarket and RSI[2]<(a+b) then
exitshort at market
endif
Sorry there might be few typos, pls send the full code.
Thank you
Oh, it’s “cs” that’s missing. I don’t have the code right now but it’s the exact same conditions as in your code above so you can copy it from there. But as you might see I made the sides more symmetrical and removed “close < open" as condition for long exit
Hola Francesco, gracias por tu estrategia. Cuando intento activarla en ProOrder, no lo permite, indica este mensaje: Deben aplicarse los siguientes cambios antes de enviar el código a ProOrder:
– Reemplace las variables. Para lanzar esta estrategia en trading automático, suprima las variables de la ventana de programación en la sección BroBacktest y reemplácelas por valores específicos en el código de su sistema de trading.
Puedes ayudarme en que he de hacer. Muchas gracias
ok, sorry, I’ve already configured it with a = 10 b = 30 thanks Francesco for your post
Hello Francesco!
when i replace a&b with 10&30 the results are not the same?
how can i make this code applicable for live trading? cause i must remove the a&b with values
@snucke the results are not the same because the pictures refers to a few years ago. I am not sure how the strategy will look now with the same parameters.
still working, using with filters like :
trendFilterUp=close>average[190](close)
trendFilterDw=close<average[190](close)
same parameters 10,30
@Francesco78 i mean the results differ when i test on my own.
so im curious of what the parameters a&b are based on?