Hi everyone.
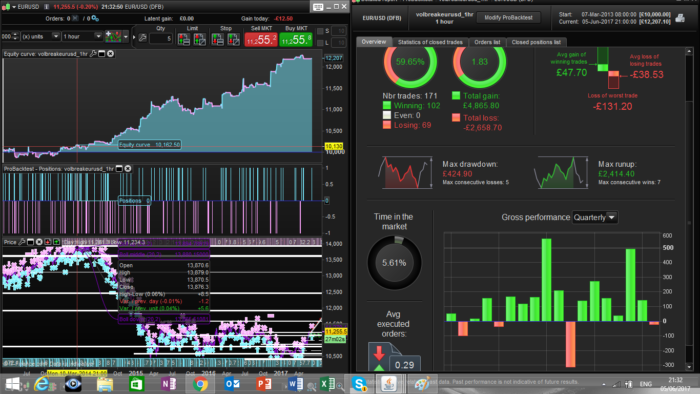
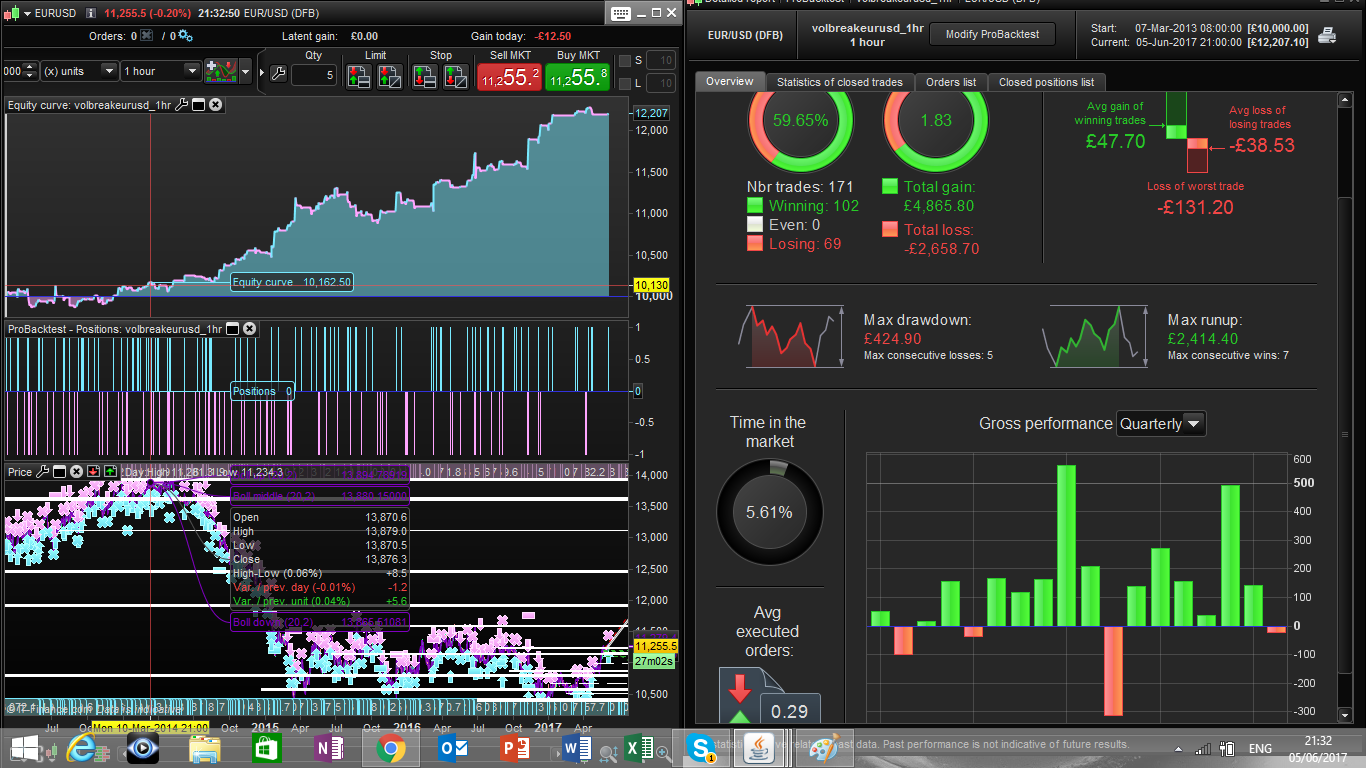
I came up with this relatively simple strategy that gives nice results on EUR/USD and DAX on a 1 hour and 30 min timeframes.
The idea behind is the following:
I define the quantity of averagerange that represent the average of the last 3 days high/low range on price.
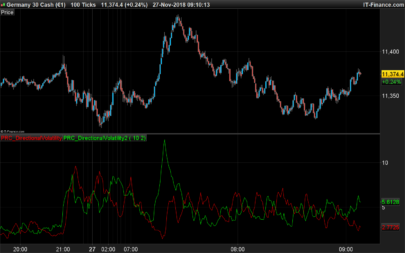
- I take a long position if the 1 period ATR crosses above the averagerange with a corresponding bull candle (volatility break on the upside)
- I take a short position if the 1 period ATR crosses above the averagerange with a corresponding bear candle (volatility break on the downside)
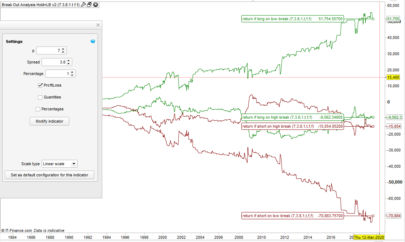
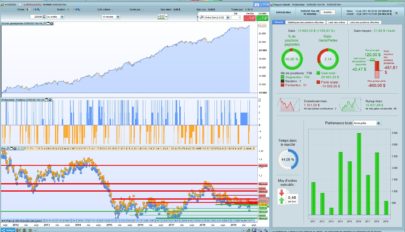
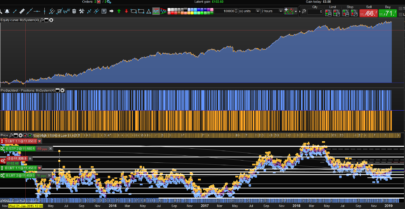
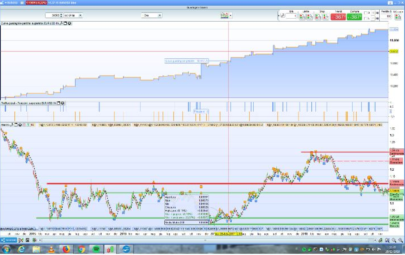
Walk forward results are attached
Best
Francesco
|
1 2 3 4 5 6 7 8 9 10 11 12 13 14 15 16 17 18 19 20 21 22 23 24 25 26 27 28 29 30 31 32 33 34 35 36 37 38 39 40 41 42 43 |
// Definition of code parameters DEFPARAM CumulateOrders = False // Cumulating positions deactivated period = 72 //1hr time frame -> 3 days average ///optimized parameters a= 9 //exit after a bars l=0.9//factor that defines break conditions b=1.9//dynamic profit factor multiplier ///definition of pricerange -> average of the daily high/low range notmonday = opendayofweek = 2 or opendayofweek = 3 or opendayofweek = 4 or opendayofweek = 5 if notmonday then dailypricerange = Dhigh(1) - Dlow(1) endif if opendayofweek = 1 then dailypricerange = Dhigh(2)-Dlow(2) endif averagerange = average[period](dailypricerange) //////// atr= AverageTrueRange[1](close) pr = averagerange*b //profit factor proportional to averagerange ///trading conditions downsidevolbreak = (atr >= l*averagerange) and close<open upsidevolbreak= (atr >= l*averagerange) and close >=open IF downsidevolbreak THEN sellshort 1 PERPOINT AT MARKET ENDIF IF upsidevolbreak THEN buy 1 PERPOINT AT MARKET ENDIF ///exit conditions set target pprofit pr if longonmarket and barindex-tradeindex >=a then sell at market endif if shortonmarket and barindex-tradeindex >= a then exitshort at market endif |
Share this
No information on this site is investment advice or a solicitation to buy or sell any financial instrument. Past performance is not indicative of future results. Trading may expose you to risk of loss greater than your deposits and is only suitable for experienced investors who have sufficient financial means to bear such risk.
ProRealTime ITF files and other attachments :
Find other exclusive trading pro-tools on ![]()
PRC is also on YouTube, subscribe to our channel for exclusive content and tutorials


Thanks Francesco, another good idea!
thank you Ale! Im starting to test it on other currency pairs and commodities and the results are quite promising. Ill open a thread once I have something concrete.
Ok!
I have imported Francesco’s EUR/USD breakout system but unfortunately does not seem to work.
I just copied and pasted into PRT but get gains of $0.10 per winning trade and losses of $56.59 per losing trade ( 59.72% winning trades. This on 1hr chart over 20 months from 06 Oct 2015 to 13 June 2017. Overall loss of $1636.7
897148
I think it has to do with how EURUSD is quoted. if you see EURUSD = 11218 then it should work. If you see EURUSD = 112.18 then you need to account for this difference in the definition of the profits taking level
So you need to change the code in the follwing way
line 35
///exit conditions
set target pprofit pr*100
Thanks Francesco. Tried *100 ( no change) and *10000 ( improvement but still woeful).
Francesco apologies. I had spread set for a South African Index system and hadn’t changed it.
Seems OK now . Regards
great!
Hi Francesco, thanks for the interesting code.
I am trying to learn to code and to improve my understanding of indicators. So, I have been trying to dissect other people’s codes. I’m still new so please forgive me if my comments are irrelevant!
I was interested that you chose a 3 day (72hr) period for your ATR calc. Was there a theoretical reason for this?
I have played around with the period and was interested by the results. Basically, efficiency improves (a bit) as the period increases (up to a point). Initially I was intrigued by this, but then after I thought about it I realised that I had probably just discovered that ATR doesn’t change much for EURUSD? Maybe I was effectively over optimising ATR. I suspect that the fact that your system works with a variety of ATR periods is a sign of robustness.
p = 480 Gain 17.94%, Number of trades: 136, winning 58.82%, gain:loss 1.69, time in market 3.84%
p= 600 G 20.15%, N o t: 137, winning 60.58%, g:l 1.82, t i m 3.88%
p= 1200 G 22.95%, N o t: 130, winning 61.54%, g:l 1.99, t i m 3.66%
p=2400 G 24.33%, N o t: 132, winning 59.85%, g:l 2.03, t i m 3.75%
Also shorter p=14: G 24.95%, n o t: 248, winning 53.23%, g:l 1.67, t i m 6.51%
Kind Regards
hello Prince Myshkin. Thank you for the time you spent on my code. Im currently travelling, will reply to your question next week.
Enjoy your travels!
Hi Prince Myshkin
I was interested that you chose a 3 day (72hr) period for your ATR calc. Was there a theoretical reason for this?
No, the 72hrs just represent a sort of average of the price range over the last 3 days. I did not optimize this variable as you can see from the code, it was just something I wanted to have a reference point. The fact that the performance of the algo stay positive by changing the period is an encouraging fact, thanks for pointing that out.
Best
Francesco
Thanks Francesco for sharing.
Equity curve in overall looks great and testing it on demo :). I observed some positions are in continuous losses e.g. Apr – Mid July 2017. I have tried optimized parameters but my case won’t improve the situation. Perhaps more filter may be required…
Hi CKW thanks for your comment and for spending time on the steategies. The framework is very general and works on several assets. I think the best think is to employ many of this strategies to achieve diversification rather than trying to obtein the perfect equity curve on 1 single strategies. that being said any ideas will be mostly welcome! have a great day
Hi! Francesco
I have test it on GBP/USD but it only have a trade on 9 Jun which i backtested it to current date of 2 Sep. How do i enable yr strategy to generate more trade.
why not use 1h chart? has 95% hitrate
i see most of positions are only 1 pip before exit?