“Honest Guide to Stock Trading” screener

“Honest Guide to Stock Trading” screener

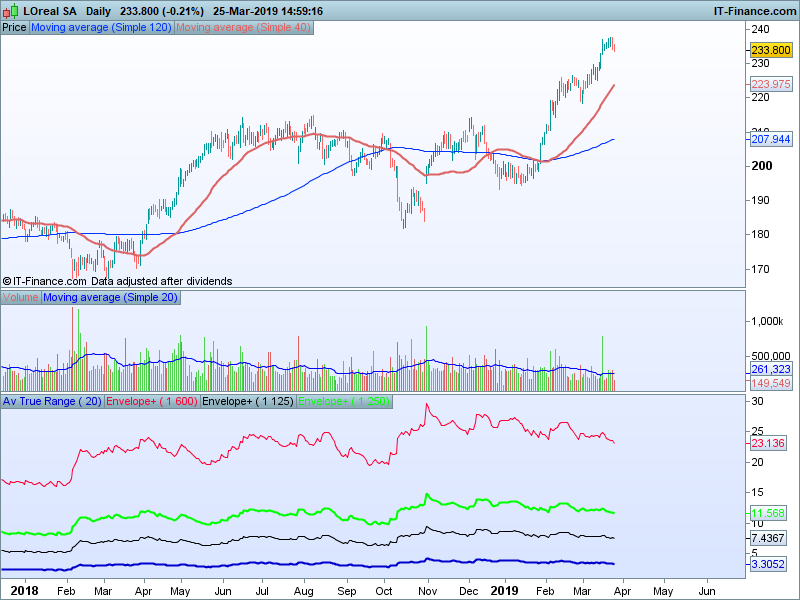
A daily breakout screener using the 40 day MA and the 120 MA using Volume that’s 1.5 times Average from the book ”The Honest Guide to Stock Trading” shares the exact trading strategy rules and money management systems that have a proven track-record of making market-beating returns.

I found the code on youtube, thought I share it. The settings for stoploss is the value of ATR multiplied by 7 for counter trend strategy we setup the indicator ATR value to 20 periods and at the indicator Envelope to it. change the number of periods to 1 and verticaly shift the Envelope by 600 % then click envelope – and make it invisible. Now it calculates it automatic what your shares should be ( if i’m correct ).

Now let’s say you want to use 7 times the value of the ATR trailing stoploss  for example you would risk 500 euro’s and like this example Loreal SA stock the ATR 20 period = € 3.30 * 7 = € 23.1 so the stoploss should be 23.1 euro below the entry price and this would trail behind every new high. So if we risk € 500 euro’s devided by 23.1 (500 / 23.1 = ) € 21,64 so we can buy 23 stocks of Loreal.

For the countertrend strategy our stoploss is 2.25 times of the ATR and our profit target is 3.5 times above the entry price so we add again the indicator Envelope and change the settings periods to 1 and vertically shift it to 125% and un check all boxes from envelope so we see 3 lines in the indicator window. Now to calculate the profit target we use again Envelope * 3.5 times ATR vertically shift it to 250% and periods 1. The Value of ATR color = Blue, Value of ATR times 2.5 = Black, the Value of ATR times 3.5 = Green and the Value of ATR times 7 the red line. Now you can see quickly where your stoploss should be!

Happy trading


Share this

Risk disclosure:

No information on this site is investment advice or a solicitation to buy or sell any financial instrument. Past performance is not indicative of future results. Trading may expose you to risk of loss greater than your deposits and is only suitable for experienced investors who have sufficient financial means to bear such risk.

ProRealTime ITF files and other attachments : How to import ITF files into ProRealTime platform?

PRC is also on YouTube, subscribe to our channel for exclusive content and tutorials

  1. juanj • 03/26/2019 #

    Perhaps you can also share the link to the YouTube video

  2. RobertFX • 03/26/2019 #

    https://www.youtube.com/watch?v=I1QOJgfHR5E

    and this one

    https://www.youtube.com/watch?v=YbmWgqSvLGU

  3. MonopolyTm • 03/26/2019 #

    Thanks for sharing. I tried it but i did not get any results. Just checking if that’s the case for you as well per 0405?

  4. RobertFX • 03/26/2019 #

    Works fine

  5. Kees Pols • 03/26/2019 #

    great tool!
    Thank you

  6. tush1822 • 03/26/2019 #

    appreciate your post mate!! it helped me.

avatar
Register or

Likes

avatar avatar avatar avatar avatar avatar avatar avatar avatar avatar avatar
Related users ' posts
emism12 Looks great, personally I don't use automated trading for single stocks, but is definitely o...
adconsulting Ciao, I look that the strategy (backtest 50 k), works very good wiht US 500 CASH 1 EURO in...
Kev Monaghan The equity curve looks to follow the stock price almost perfectly, Have you tested on stock ...
smarttrader1 hi, can you improve on this ? can you make this flag screeener for day trading, I want to be...
Nicolas Please open a new topic in the proscreener forum for this specific query. Please provide exp...
NHGambler Nice screener. Only thing is I wonder if this is aimed more at small/medium/large caps? I ...
mickey992 salut merci pour ton partage et ton travaille
patapouf Hi Vivien René I just discovered your “Ordered trend-following stocks Screener”. Great work...
fredfilm Hi Nicolas, how could we add a price screen to this? eg stock prices between $1 to $3 etc
avatar
Anonymous Hi Odin, Thanks for this screener based on the popular criteria to trade trends from Marc...
Mully Bonjour, est ce que quelqu'un sait comment ajouter les niveaux de résistances / supports su...
Nicolas Il s'agit de l'indicateur "volume par niveau de prix" disponible par défaut dans la plateforme.
Actabi Thank you ! Have you realised your "next step" ?
Jessar guten Tag, gibt es bereits die Aktualisierte Datei?
Per Inge Gents - An update - I have been studying various trading approaches, as this one that is bas...
Gianluca thank you very nice screener
Vonasi An interesting idea that was easily turned into a strategy on a shorter time frame that appe...
Stenozar Hi Vonasi, is it possible for you to share your code here? thanks in advance
Vonasi Sorry Stenozar. I have only really spent an hour or so on this strategy so far and it is far...
bertrandpinoy BONJOUR PAUL impossible de tenter le trading automatique, PRT me dis que l instruction "GRAP...
Paul Bonjour, supprimez les lignes avec un "graph"
bertrandpinoy merci. vous l utiliser actuellment sur quel instrument vous? et quel timeframe? Merci
GraHal Yes sorry, I set up a link to a screen shot on my google drive and then I got locked into th...
gabri Here's the thread https://www.prorealcode.com/topic/multiframe-rsi-of-rsi/
Bernard13 Bonjour Nicolas, Pourriez-vous m'indiquer si cet indicateur fonctionne avec la V11 ? Le di...
pata_tony Hi, i'm not able to see the indicator. Could you please help me? Thanks
Nicolas This is not an indicator but a screener, to be used with the ProScreener module.
JOKAMAURICE Le programme ne se charge pas dans PRT
zilliq I think the "best"  method to backtest is  to do a simplier Walk forward backtest (and we ho...
volpiemanuele Hi, I have modified and optimized the strategy on FTSE 100 CASH Eur 1 on IG demo account. B...

Top