Zeiierman Trend Pressure
Introduction
Most range oscillators have one setting that decides everything. Pick 14 and you get a nervous line that calls a top every other day. Pick 200 and you get a line that is still bullish two weeks after the high. The usual workaround is to plot two of them and eyeball the disagreement.
Zeiierman Trend Pressure does something more interesting: it reads the same measurement — where the close sits inside the range — at three horizons at once, and then decides how much it is allowed to move based on whether those three horizons agree.
The result is a pane with two lines that behave very differently on purpose. One reacts. The other resists. And the whole point of the indicator is what happens when the reactive one drags the stubborn one into an extreme and holds it there.
Theory Behind the Indicator
1. Z-Pulse: the reactive layer
Williams %R over 21 bars is the base. On top of it, a 9-period stochastic is applied to the %R itself — a normalisation of a normalisation, which sharpens the turns without shortening the lookback. The two are blended 72/28 in favour of the raw reading and smoothed with a 7-period exponential average.
The scale is the native Williams range, -100 to 0: zero is the top of the range, minus one hundred is the bottom. Every line in this indicator lives on that scale, which is what allows them to be compared directly instead of through a normalisation layer.
2. Z-Trend: consensus, persistence, and a brake
This is the part worth reading twice.
The starting point is a weighted consensus of three Williams %R readings — 21, 55 and 120 bars — weighted 0.10 / 0.18 / 0.72. The macro horizon carries almost three quarters of the vote, which is what gives the line its slow, trend-following character.
Then persistence is added. Two counters track how long the consensus has been camped in an outer zone: one charges while the consensus stays above −30, the other while it stays below −70, both at 0.07 per bar with a decay of 0.94 when the condition breaks. The difference between them, scaled by the Trend Persistence input, is added to the consensus. A market that has been pinned near the top of its range for forty bars gets pushed further up than its raw reading deserves — because staying there is the information.
Finally, the brake. Instead of following the target with a fixed exponential step, the step is recomputed every bar:
- If the target pulls against the macro side — macro reading in the upper half and the target falling, or the reverse — the step is multiplied by
1 - lock. lockgrows with two things: the agreement between the three horizons (how close the three %R readings are to each other) and the efficiency ratio of the last 55 bars (net move divided by total travel).
Read that in plain terms: when the three timeframes agree and the move is clean, the line becomes very hard to turn. When they disagree, or the market is chopping, the brake releases and the line follows normally. A counter-trend flicker in a strong, orderly trend barely moves it. The same flicker in a messy range moves it a lot.
There is a floor of 0.015 on the braked step, so the line never freezes completely.
3. Pressure Core: the regime underneath
A separate score, computed per candle on a 0–100 scale, weighting five things:
- where the close sits in the range (42 %)
- where the typical price sits in the range (23 %)
- the body, as a fraction of the candle (13 %)
- wick asymmetry — lower wick minus upper wick (12 %)
- the 5-bar impulse relative to the range (10 %)
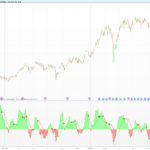
That score is computed over a fast window (21) and a slow one (112), smoothed, and mixed 65/35 in favour of the slow one. It is shifted onto the same -100 / 0 scale and plotted as a third line whose colour carries the message: teal when both the mix and the slow component are in the upper half, red when both are in the lower half, grey when they disagree.
That grey is not a decoration. It marks the periods when the fast pressure and the background regime are pointing at different things, which is exactly when the other two lines are least reliable.
4. Pressure exhaustion: a state, not a signal
Here the indicator stops describing and starts committing.
A pressure state opens when both Z-Pulse and Z-Trend have been inside the extreme zone for a number of consecutive bars. It closes only when both have come back through a release threshold placed further inside — a deliberate hysteresis gap, so a single bar poking out does not cancel the state.
The Sensitivity input from 1 to 10 moves three things at once:
- the width of the zone (higher sensitivity, narrower zone, harder to enter)
- the size of the release buffer (higher sensitivity, deeper retreat needed to exit)
- the number of confirmation bars (1 up to 4)
And below 3, the exit test changes from AND to OR — one line leaving is enough. That setting is intentionally loose, fast and inconsistent, and it is documented as such in the original. Five is balanced. Ten is strict and selective.
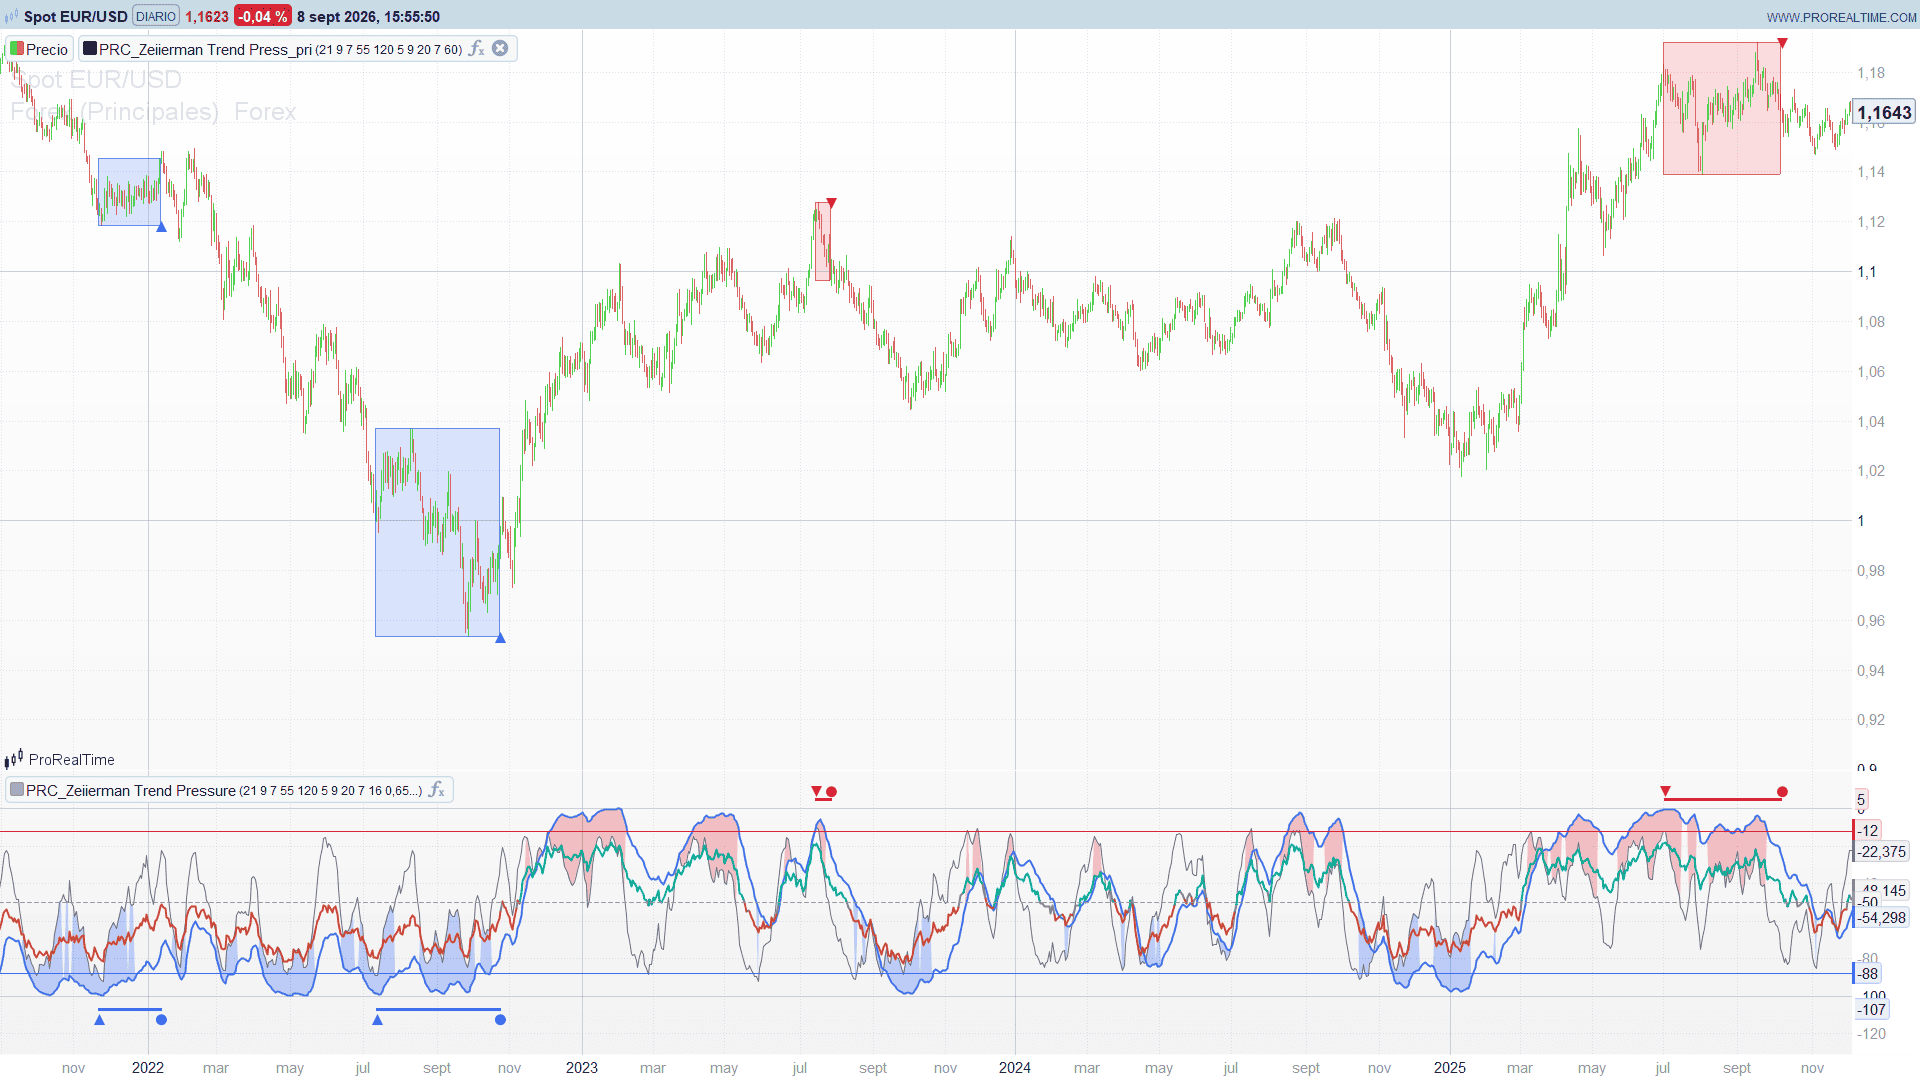
While a state is open, a box is drawn on the price chart, anchored on the bar the state started, growing with the running high and low of the stretch, and closed on the bar the pressure is released. That box is the most practically useful output of the whole indicator: it gives you the exact price range over which the market was under pressure, which is a level, not an opinion.
How to Read It
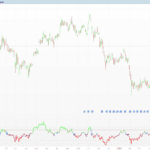
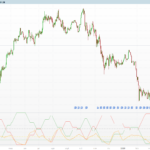
The oscillator pane shows two horizontal levels — the upper and lower pressure boundaries — plus the equilibrium at −50 and the range edges at 0 and −100. Dots run along the top or the bottom while a pressure state is active, a triangle marks the bar it opened, and a circle marks the bar it was released.
Three readings worth having:
Z-Pulse deep in the zone, Z-Trend still in the middle. No state opens, and correctly so. The fast layer is stretched but the structure has not followed. This is the configuration that produces most of the false tops people trade.
Both lines in the zone, dots printing, box growing on price. The market is being pressed against one edge of its range and has been for several bars. The box is your invalidation level.
The release circle. Both lines have retreated through the buffer. The state is over. Note this is not a reversal call — it is the end of the pressure, and the box behind it tells you the range that was defended.
The Pressure Core colour is the filter over all three: a release out of an upper pressure state while the Core is still solidly teal is a very different event from the same release with the Core already red.
The Code
The indicator is split into two files, because the oscillator lives in its own pane and the boxes live on price.
Part 1 — the oscillator pane
//PRC_Zeiierman Trend Pressure
//version = 1
//08.09.2026
//Ivan Gonzalez @ www.prorealcode.com
//Translated from "Zeiierman Trend Pressure (Zeiierman)", Pine v6

// ---------------------------------------------------------------- Inputs
pulseRange = 21        // Pulse Range
pulseStoch = 9         // Pulse Stochastic
pulseSmooth = 7        // Pulse Smoothing
trendRange = 55        // Trend Range
macroRange = 120       // Macro Trend
trendSmooth = 5        // Trend Smoothing
persist = 9.0          // Trend Persistence
exhZone = 20           // Exhaustion Zone
sens = 7               // Sensitivity, 1 loose ... 10 strict
reactSmooth = 16       // Reactive Smoothing
regimeW = 0.65         // Regime Weight
gradFill = 1           // 1 = fill between Z-Pulse and Z-Trend
showCross = 0          // 1 = dot on every Z-Pulse / Z-Trend cross


// -------------------------------------------- Fixed core parameters
weightS = 0.18         // structural weight inside Z-Trend
weightM = 0.72         // macro weight inside Z-Trend
holdF = 0.92           // persistence hold factor
coreFast = 21          // reactive pressure window
coreSlow = 112         // regime pressure window
coreSlowSm = 3         // regime smoothing
eps = 0.0000001


// ---------------------------------------- Williams %R, three horizons
hiF = highest[pulseRange](high)
loF = lowest[pulseRange](low)
wrFast = 100 * (close - hiF) / max(hiF - loF, eps)


hiS = highest[trendRange](high)
loS = lowest[trendRange](low)
wrStruct = 100 * (close - hiS) / max(hiS - loS, eps)


hiM = highest[macroRange](high)
loM = lowest[macroRange](low)
wrMacro = 100 * (close - hiM) / max(hiM - loM, eps)


// ------------------------------------------------------------ Z-Pulse
hiP = highest[pulseStoch](wrFast)
loP = lowest[pulseStoch](wrFast)
pulseStk = -100 + 100 * (wrFast - loP) / max(hiP - loP, eps)
pulseRaw = max(-100, min(0, wrFast * 0.72 + pulseStk * 0.28))


// A native average that swallows one undefined stays undefined for the whole
// history, so every EMA input is seeded with a neutral value until its own
// lookback is complete. The seed is flushed out long before the plot starts.
IF barindex < pulseRange + pulseStoch THEN
   pulseIn = -50
ELSE
   pulseIn = pulseRaw
ENDIF
zPulse = average[pulseSmooth,1](pulseIn)


// ------------------------------------------------------------ Z-Trend
weightF = max(0, 1 - weightS - weightM)
wSum = weightF + weightS + weightM
cn = max(-100, min(0, (wrFast * weightF + wrStruct * weightS + wrMacro * weightM) / max(wSum, eps)))


disp = abs(wrFast - wrStruct) + abs(wrStruct - wrMacro) + abs(wrFast - wrMacro)
agree = 1 - max(0, min(1, disp / 300))


effNum = abs(close - close[trendRange])
effDen = summation[trendRange](abs(close - close[1]))
effRatio = max(0, min(1, effNum / max(effDen, eps)))


warmMacro = macroRange
warmAll = macroRange + 21


// dwell counters: how long the consensus has been camped in an outer zone
IF barindex <= warmMacro THEN
   upDwell = 0
   dnDwell = 0
ELSE
   IF cn > -30 THEN
      upDwell = min(1, upDwell[1] * 0.93 + 0.07)
   ELSE
      upDwell = upDwell[1] * 0.94
   ENDIF
   IF cn < -70 THEN
      dnDwell = min(1, dnDwell[1] * 0.93 + 0.07)
   ELSE
      dnDwell = dnDwell[1] * 0.94
   ENDIF
ENDIF


tgRaw = max(-100, min(0, cn + persist * (upDwell - dnDwell)))
IF barindex < macroRange THEN
   tgIn = -50
ELSE
   tgIn = tgRaw
ENDIF
tgSm = average[2,1](tgIn)


baseAlpha = 2 / (trendSmooth + 1)
lockF = max(0, min(0.97, 0.15 + agree * effRatio * holdF))


// adaptive follow: brakes hard when the target pulls against the macro side
IF barindex < warmAll THEN
   zTrend = -50
ELSIF barindex = warmAll THEN
   zTrend = tgSm
ELSE
   IF wrMacro > -50 THEN
      sideM = 1
   ELSIF wrMacro < -50 THEN
      sideM = -1
   ELSE
      sideM = 0
   ENDIF
   pullBack = (sideM = 1 AND tgSm < zTrend[1]) OR (sideM = -1 AND tgSm > zTrend[1])
   IF pullBack THEN
      stepA = max(0.015, baseAlpha * (1 - lockF))
   ELSE
      stepA = max(baseAlpha * 0.75, 0.03)
   ENDIF
   zTrend = max(-100, min(0, zTrend[1] + stepA * (tgSm - zTrend[1])))
ENDIF


// ----------------------------------------------------- Pressure Core
candRange = max(high - low, eps)
bodyHi = max(open, close)
bodyLo = min(open, close)
upWick = high - bodyHi
loWick = bodyLo - low
bodyPos = ((close - open) / candRange + 1) * 0.5
wickPos = ((loWick - upWick) / candRange + 1) * 0.5


IF barindex >= 5 THEN
   ref5 = close[5]
ELSE
   ref5 = close
ENDIF


hiA = highest[coreFast](high)
loA = lowest[coreFast](low)
rangeA = max(hiA - loA, eps)
clA = (close - loA) / rangeA
mnA = ((high + low + close) / 3 - loA) / rangeA
imA = ((close - ref5) / rangeA + 1) * 0.5
prsA = max(0, min(100, (clA * 0.42 + mnA * 0.23 + bodyPos * 0.13 + wickPos * 0.12 + imA * 0.10) * 100))


hiB = highest[coreSlow](high)
loB = lowest[coreSlow](low)
rangeB = max(hiB - loB, eps)
clB = (close - loB) / rangeB
mnB = ((high + low + close) / 3 - loB) / rangeB
imB = ((close - ref5) / rangeB + 1) * 0.5
prsB = max(0, min(100, (clB * 0.42 + mnB * 0.23 + bodyPos * 0.13 + wickPos * 0.12 + imB * 0.10) * 100))


IF barindex < coreFast THEN
   prsInA = 50
ELSE
   prsInA = prsA
ENDIF
IF barindex < coreSlow THEN
   prsInB = 50
ELSE
   prsInB = prsB
ENDIF
coreReact = average[reactSmooth,1](prsInA)
coreRegime = average[coreSlowSm,1](prsInB)
coreMix = coreRegime * regimeW + coreReact * (1 - regimeW)
zCore = coreMix - 100


IF coreMix > 50 AND coreRegime > 50 THEN
   coreR = 0
   coreG = 170
   coreB = 145
ELSIF coreMix < 50 AND coreRegime < 50 THEN
   coreR = 205
   coreG = 70
   coreB = 55
ELSE
   coreR = 130
   coreG = 130
   coreB = 130
ENDIF


// ------------------------------------------- Pressure exhaustion state
dSens = sens - 5
zoneW = max(8, min(42, exhZone - dSens * 4))
relBuf = max(1, min(18, 8 + dSens * 1.75))


IF sens <= 5 THEN
   confBars = 1
ELSIF sens <= 7 THEN
   confBars = 2
ELSIF sens <= 9 THEN
   confBars = 3
ELSE
   confBars = 4
ENDIF
fastExit = sens <= 2


upLevel = 0 - zoneW
dnLevel = -100 + zoneW
upExitLvl = upLevel - relBuf
dnExitLvl = dnLevel + relBuf


IF barindex <= warmAll THEN
   upCount = 0
   dnCount = 0
   pState = 0
ELSE
   IF zPulse >= upLevel AND zTrend >= upLevel THEN
      upCount = upCount[1] + 1
   ELSE
      upCount = 0
   ENDIF
   IF zPulse <= dnLevel AND zTrend <= dnLevel THEN
      dnCount = dnCount[1] + 1
   ELSE
      dnCount = 0
   ENDIF
   IF fastExit THEN
      upExit = zPulse < upExitLvl OR zTrend < upExitLvl
      dnExit = zPulse > dnExitLvl OR zTrend > dnExitLvl
   ELSE
      upExit = zPulse < upExitLvl AND zTrend < upExitLvl
      dnExit = zPulse > dnExitLvl AND zTrend > dnExitLvl
   ENDIF
   IF pState[1] = 0 THEN
      IF upCount >= confBars THEN
         pState = 1
      ELSIF dnCount >= confBars THEN
         pState = -1
      ELSE
         pState = 0
      ENDIF
   ELSIF pState[1] = 1 THEN
      IF upExit THEN
         pState = 0
      ELSE
         pState = 1
      ENDIF
   ELSE
      IF dnExit THEN
         pState = 0
      ELSE
         pState = -1
      ENDIF
   ENDIF
ENDIF


upActive = pState = 1
dnActive = pState = -1
upStart = upActive AND pState[1] <> 1
dnStart = dnActive AND pState[1] <> -1
upBreak = pState = 0 AND pState[1] = 1
dnBreak = pState = 0 AND pState[1] = -1


// ------------------------------------------------------------ Drawing
IF barindex <= warmAll THEN
   zPulsePlot = undefined
   zTrendPlot = undefined
   zCorePlot = undefined
ELSE
   zPulsePlot = zPulse
   zTrendPlot = zTrend
   zCorePlot = zCore
ENDIF


// A series returned by RETURN is NOT switched off by `undefined`: it keeps
// drawing its last value for the rest of the chart. Visibility is controlled
// with the 4th argument of COLOURED, which does accept a variable.
upDot = 5
dnDot = -107
IF upActive THEN
   upDotA = 255
ELSE
   upDotA = 0
ENDIF
IF dnActive THEN
   dnDotA = 255
ELSE
   dnDotA = 0
ENDIF


// event marks: start of the pressure state and release of it
IF upStart THEN
   DRAWTEXT("▼", barindex, 10) COLOURED(230,40,62)
ENDIF
IF dnStart THEN
   DRAWTEXT("▲", barindex, -112) COLOURED(41,98,255)
ENDIF
IF upBreak THEN
   DRAWTEXT("●", barindex, 10) COLOURED(230,40,62)
ENDIF
IF dnBreak THEN
   DRAWTEXT("●", barindex, -112) COLOURED(41,98,255)
ENDIF


IF showCross = 1 THEN
   IF zPulsePlot CROSSES OVER zTrendPlot THEN
      DRAWPOINT(barindex, zTrend, 3) COLOURED(41,98,255)
   ENDIF
   IF zPulsePlot CROSSES UNDER zTrendPlot THEN
      DRAWPOINT(barindex, zTrend, 3) COLOURED(230,40,62)
   ENDIF
ENDIF


// band between Z-Pulse and Z-Trend, only inside the two extreme zones.
// Outside them the fill series collapses onto Z-Trend so the area is zero
// instead of leaving an undefined hole that COLORBETWEEN would bridge.
midPT = (zPulse + zTrend) / 2
IF gradFill = 1 AND midPT > -30 THEN
   hotFill = zPulse
ELSE
   hotFill = zTrend
ENDIF
COLORBETWEEN(hotFill, zTrend, 230, 40, 62, 70)


IF gradFill = 1 AND midPT < -70 THEN
   coldFill = zPulse
ELSE
   coldFill = zTrend
ENDIF
COLORBETWEEN(coldFill, zTrend, 41, 98, 255, 70)


eqLine = -50


RETURN zPulsePlot AS "Z-Pulse" COLOURED(105,110,125) STYLE(line,1), zTrendPlot AS "Z-Trend" COLOURED(80,120,225) STYLE(line,2), zCorePlot AS "Pressure Core" COLOURED(coreR,coreG,coreB) STYLE(line,2), upLevel AS "Upper Pressure Level" COLOURED(230,40,62) STYLE(line,1), dnLevel AS "Lower Pressure Level" COLOURED(41,98,255) STYLE(line,1), eqLine AS "Equilibrium" COLOURED(150,150,150) STYLE(dottedline,1), upDot AS "Upper Pressure Active" COLOURED(230,40,62,upDotA) STYLE(point,2), dnDot AS "Lower Pressure Active" COLOURED(41,98,255,dnDotA) STYLE(point,2)
Part 2 — the price boxes, applied on the chart
//PRC_Zeiierman Trend Pressure - price boxes
//version = 1
//08.09.2026
//Ivan Gonzalez @ www.prorealcode.com
//Translated from "Zeiierman Trend Pressure (Zeiierman)", Pine v6

defparam drawonlastbaronly = true


// ---------------------------------------------------------------- Inputs
pulseRange = 21        // Pulse Range
pulseStoch = 9         // Pulse Stochastic
pulseSmooth = 7        // Pulse Smoothing
trendRange = 55        // Trend Range
macroRange = 120       // Macro Trend
trendSmooth = 5        // Trend Smoothing
persist = 9.0          // Trend Persistence
exhZone = 20           // Exhaustion Zone
sens = 7               // Sensitivity, 1 loose ... 10 strict
maxBoxes = 60          // how many past boxes stay on the chart


// -------------------------------------------- Fixed core parameters
weightS = 0.18
weightM = 0.72
holdF = 0.92
eps = 0.0000001


// ---------------------------------------- Williams %R, three horizons
hiF = highest[pulseRange](high)
loF = lowest[pulseRange](low)
wrFast = 100 * (close - hiF) / max(hiF - loF, eps)


hiS = highest[trendRange](high)
loS = lowest[trendRange](low)
wrStruct = 100 * (close - hiS) / max(hiS - loS, eps)


hiM = highest[macroRange](high)
loM = lowest[macroRange](low)
wrMacro = 100 * (close - hiM) / max(hiM - loM, eps)


// ------------------------------------------------------------ Z-Pulse
hiP = highest[pulseStoch](wrFast)
loP = lowest[pulseStoch](wrFast)
pulseStk = -100 + 100 * (wrFast - loP) / max(hiP - loP, eps)
pulseRaw = max(-100, min(0, wrFast * 0.72 + pulseStk * 0.28))


// A native average that swallows one undefined stays undefined for the whole
// history, so every EMA input is seeded with a neutral value until its own
// lookback is complete. The seed is flushed out long before the plot starts.
IF barindex < pulseRange + pulseStoch THEN
   pulseIn = -50
ELSE
   pulseIn = pulseRaw
ENDIF
zPulse = average[pulseSmooth,1](pulseIn)


// ------------------------------------------------------------ Z-Trend
weightF = max(0, 1 - weightS - weightM)
wSum = weightF + weightS + weightM
cn = max(-100, min(0, (wrFast * weightF + wrStruct * weightS + wrMacro * weightM) / max(wSum, eps)))


disp = abs(wrFast - wrStruct) + abs(wrStruct - wrMacro) + abs(wrFast - wrMacro)
agree = 1 - max(0, min(1, disp / 300))


effNum = abs(close - close[trendRange])
effDen = summation[trendRange](abs(close - close[1]))
effRatio = max(0, min(1, effNum / max(effDen, eps)))


warmMacro = macroRange
warmAll = macroRange + 21


IF barindex <= warmMacro THEN
   upDwell = 0
   dnDwell = 0
ELSE
   IF cn > -30 THEN
      upDwell = min(1, upDwell[1] * 0.93 + 0.07)
   ELSE
      upDwell = upDwell[1] * 0.94
   ENDIF
   IF cn < -70 THEN
      dnDwell = min(1, dnDwell[1] * 0.93 + 0.07)
   ELSE
      dnDwell = dnDwell[1] * 0.94
   ENDIF
ENDIF


tgRaw = max(-100, min(0, cn + persist * (upDwell - dnDwell)))
IF barindex < macroRange THEN
   tgIn = -50
ELSE
   tgIn = tgRaw
ENDIF
tgSm = average[2,1](tgIn)


baseAlpha = 2 / (trendSmooth + 1)
lockF = max(0, min(0.97, 0.15 + agree * effRatio * holdF))


IF barindex < warmAll THEN
   zTrend = -50
ELSIF barindex = warmAll THEN
   zTrend = tgSm
ELSE
   IF wrMacro > -50 THEN
      sideM = 1
   ELSIF wrMacro < -50 THEN
      sideM = -1
   ELSE
      sideM = 0
   ENDIF
   pullBack = (sideM = 1 AND tgSm < zTrend[1]) OR (sideM = -1 AND tgSm > zTrend[1])
   IF pullBack THEN
      stepA = max(0.015, baseAlpha * (1 - lockF))
   ELSE
      stepA = max(baseAlpha * 0.75, 0.03)
   ENDIF
   zTrend = max(-100, min(0, zTrend[1] + stepA * (tgSm - zTrend[1])))
ENDIF


// ------------------------------------------- Pressure exhaustion state
dSens = sens - 5
zoneW = max(8, min(42, exhZone - dSens * 4))
relBuf = max(1, min(18, 8 + dSens * 1.75))


IF sens <= 5 THEN
   confBars = 1
ELSIF sens <= 7 THEN
   confBars = 2
ELSIF sens <= 9 THEN
   confBars = 3
ELSE
   confBars = 4
ENDIF
fastExit = sens <= 2


upLevel = 0 - zoneW
dnLevel = -100 + zoneW
upExitLvl = upLevel - relBuf
dnExitLvl = dnLevel + relBuf


IF barindex <= warmAll THEN
   upCount = 0
   dnCount = 0
   pState = 0
ELSE
   IF zPulse >= upLevel AND zTrend >= upLevel THEN
      upCount = upCount[1] + 1
   ELSE
      upCount = 0
   ENDIF
   IF zPulse <= dnLevel AND zTrend <= dnLevel THEN
      dnCount = dnCount[1] + 1
   ELSE
      dnCount = 0
   ENDIF
   IF fastExit THEN
      upExit = zPulse < upExitLvl OR zTrend < upExitLvl
      dnExit = zPulse > dnExitLvl OR zTrend > dnExitLvl
   ELSE
      upExit = zPulse < upExitLvl AND zTrend < upExitLvl
      dnExit = zPulse > dnExitLvl AND zTrend > dnExitLvl
   ENDIF
   IF pState[1] = 0 THEN
      IF upCount >= confBars THEN
         pState = 1
      ELSIF dnCount >= confBars THEN
         pState = -1
      ELSE
         pState = 0
      ENDIF
   ELSIF pState[1] = 1 THEN
      IF upExit THEN
         pState = 0
      ELSE
         pState = 1
      ENDIF
   ELSE
      IF dnExit THEN
         pState = 0
      ELSE
         pState = -1
      ENDIF
   ENDIF
ENDIF


upStart = pState = 1 AND pState[1] <> 1
dnStart = pState = -1 AND pState[1] <> -1
upBreak = pState = 0 AND pState[1] = 1
dnBreak = pState = 0 AND pState[1] = -1


// ------------------------------------------------- Live box geometry
// The box is anchored on the bar the state starts and keeps the running
// high / low of the whole stretch, exactly like the grow() helper of Pine.
IF upStart OR dnStart THEN
   boxLeft = barindex - 1
   boxTop = high
   boxBot = low
ELSIF pState <> 0 THEN
   boxLeft = boxLeft[1]
   boxTop = max(boxTop[1], high)
   boxBot = min(boxBot[1], low)
ELSE
   boxLeft = boxLeft[1]
   boxTop = boxTop[1]
   boxBot = boxBot[1]
ENDIF


// ------------------------------------------- Ring buffer of closed boxes
// Everything persistent lives in $ arrays written with a plain indexed
// assignment, so a tick replay rewrites the same slot instead of stacking.
ONCE nBox = 0


IF upBreak OR dnBreak THEN
   wSlot = nBox - maxBoxes * floor(nBox / maxBoxes)
   $bxL[wSlot] = boxLeft
   $bxR[wSlot] = barindex - 1
   $bxT[wSlot] = boxTop
   $bxB[wSlot] = boxBot
   IF upBreak THEN
      $bxK[wSlot] = 1
   ELSE
      $bxK[wSlot] = -1
   ENDIF
   nBox = nBox + 1
ENDIF


// ------------------------------------------------------------ Drawing
IF islastbarupdate THEN
   IF nBox > 0 THEN
      firstK = max(0, nBox - maxBoxes)
      FOR kBox = firstK TO nBox - 1 DO
         rSlot = kBox - maxBoxes * floor(kBox / maxBoxes)
         IF $bxK[rSlot] = 1 THEN
            rr = 230
            gg = 40
            bb = 62
         ELSE
            rr = 41
            gg = 98
            bb = 255
         ENDIF
         DRAWRECTANGLE($bxL[rSlot], $bxB[rSlot], $bxR[rSlot], $bxT[rSlot]) COLOURED(rr,gg,bb,180) FILLCOLOR(rr,gg,bb,40)
         IF $bxK[rSlot] = 1 THEN
            DRAWTEXT("▼", $bxR[rSlot] + 1, $bxT[rSlot]) COLOURED(rr,gg,bb)
         ELSE
            DRAWTEXT("▲", $bxR[rSlot] + 1, $bxB[rSlot]) COLOURED(rr,gg,bb)
         ENDIF
      NEXT
   ENDIF


   IF pState <> 0 THEN
      IF pState = 1 THEN
         lr = 230
         lg = 40
         lb = 62
      ELSE
         lr = 41
         lg = 98
         lb = 255
      ENDIF
      DRAWRECTANGLE(boxLeft, boxBot, barindex, boxTop) COLOURED(lr,lg,lb,180) FILLCOLOR(lr,lg,lb,40)
   ENDIF
ENDIF


RETURN
Both files share the same engine up to the state machine, so the pane and the boxes always agree. If you change a parameter in one, change it in the other.
Settings Worth Touching
Sensitivity is the only one most people need. It is a single dial that retunes the whole exhaustion engine coherently. Start at 7. If you are getting states that open and close every few bars, go up. If the indicator never fires on your instrument, go down — but read the note above about what happens below 3.
Macro Trend (120) is what makes Z-Trend slow. Cutting it to 60 turns the indicator into something much more reactive and, in my experience, much less interesting: the whole design depends on having one horizon that does not care about this week.
Trend Persistence (9) controls how much the dwell counters push the target. At zero you get the plain consensus and the line stops reaching the extremes. Above 12 the target saturates against the clamp and the persistence term stops meaning anything.
Regime Weight (0.65) decides how much of the Pressure Core is background regime and how much is reactive pressure. Push it to 0.9 and the Core becomes almost a slow trend filter; drop it to 0.3 and it starts tracking Z-Pulse.
Honest Criticism
Three lines on the same scale is one line too many. Z-Pulse and Z-Trend are the design. The Pressure Core is a fourth measurement of the same underlying quantity — where price sits in its range — plotted on the same axis with a different colour rule. It is genuinely useful as a regime filter, but on a small pane it competes visually with the two lines that drive the signals. Consider turning it off for a week and seeing whether you miss it.
The dwell counters are a slow-moving bias. They charge at 0.07 and decay at 0.94, which means a state that has been building for forty bars takes roughly the same to unwind. That is the intended behaviour — it is what makes the line stubborn — but it also means that after a genuine regime change the target keeps leaning the old way for a while. The brake makes this worse, not better, because the brake is strongest exactly when the three horizons still agree with the old regime.
The box is anchored on the extreme of the whole stretch. It grows with the running high and low, so a single spike bar early in the state widens it permanently. On instruments prone to wicks, the box ends up wider than the range that actually mattered.
And the thing to be aware of: the exhaustion state is symmetric in construction but not in meaning. An upper pressure state in a strong uptrend is continuation; the same state in a range is a top. The indicator does not distinguish between them, and neither does the box. The Pressure Core colour is the only piece that tells you which one you are looking at, which is a good argument for keeping it after all.
Conclusion
The idea worth stealing from this one is the adaptive step. Most oscillators smooth with a constant. This one asks, every bar, “do my three timeframes agree, and is this move clean?” — and lets the answer decide how much the line is allowed to move against the trend. That is a different and better way of building a slow line than simply making the period longer, because it stays slow when it matters and gives way when the structure genuinely changes.
The rest of the machinery — the consensus weights, the dwell counters, the hysteresis on the state — exists to serve that one idea. Start there, and the rest of the settings make sense.