







Range Oscillator
Introduction
Deciding whether a market is ranging or breaking out looks easy on a chart and is surprisingly hard to put a number on. The reason is that “far from the middle” only means something relative to how volatile the instrument normally is: a 30-point excursion is nothing on one future and a violent breakout on another. The Range Oscillator by Zeiierman turns that judgement into a single, comparable line. It measures how far price sits from a movement-weighted mean, then divides that distance by a slow, structural measure of volatility so that the bands at +100 and -100 always mark the edge of the instrument’s normal range — the same meaning today, five hundred bars ago, and across different symbols.
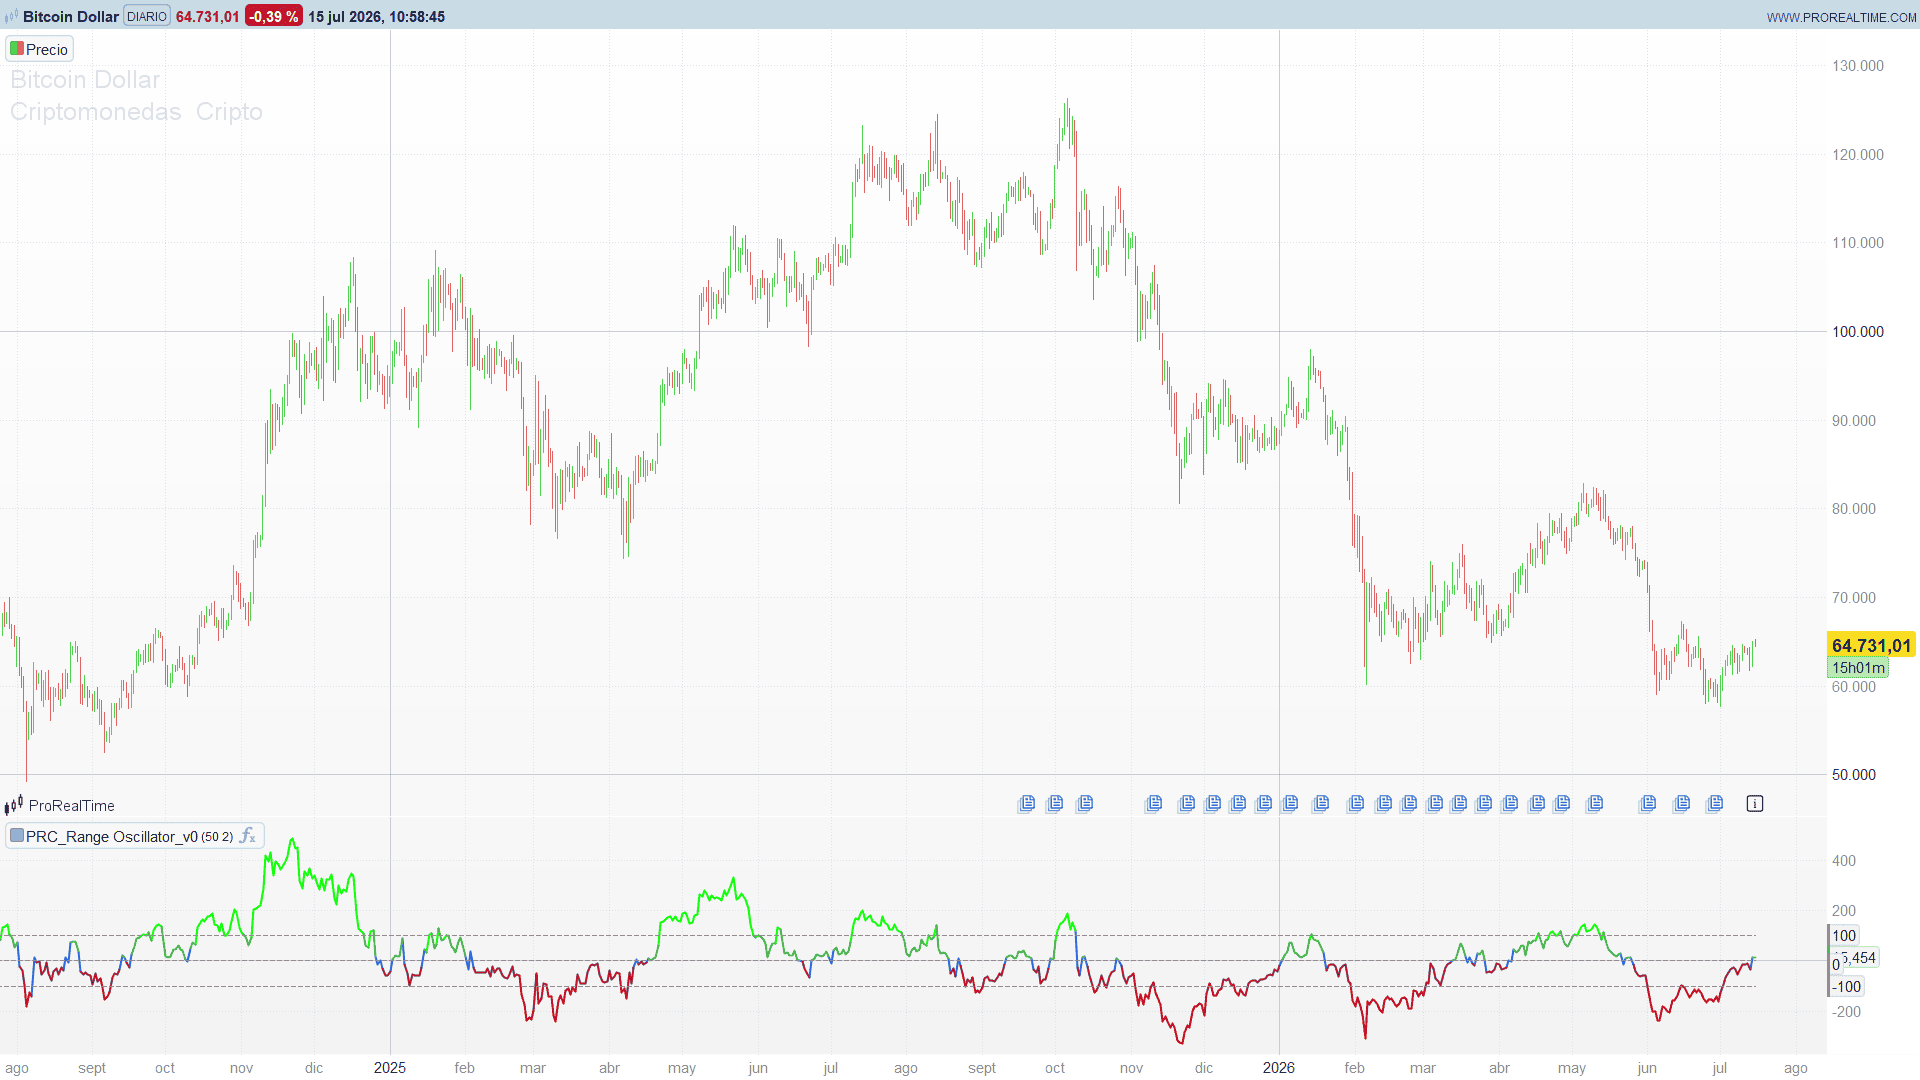
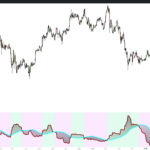
The result is a clean sub-panel oscillator: one line that lives inside +/-100 while price is contained in its volatility range, pushes through +100 on a genuine upside break and through -100 on a downside break, and colours itself by regime so the state is readable at a glance. This article walks through the two ideas that make it work — the movement-weighted mean and the structural ATR normaliser — and how they combine into a range-versus-breakout gauge.
Theory Behind the Indicator
1. A movement-weighted mean, not a plain average
Most oscillators measure distance from a simple or exponential moving average. This one builds a different centre of gravity. Over the last length bars (default 50) it weights each close by how much price actually moved on that bar:
weight(i)  = | close[i] - close[i-1] | / close[i-1]        (absolute relative return)
mean       = sum( close[i] * weight(i) ) / sum( weight(i) )
Bars where price travelled a lot count for more; quiet, going-nowhere bars count for little. The mean therefore anchors to the levels where the market did real work, not to the flat stretches where it drifted. It behaves like a volume-weighted average, but the weight is the size of the move rather than the volume — which is a deliberate advantage: it works identically on indices, forex and any instrument where volume is unreliable or absent.
2. Structural ATR, a near-constant volatility yardstick
The distance from the mean is then normalised. The key design choice is what it is normalised by: an Average True Range over a very long window (2000 bars, falling back to 200 when the chart is shorter), scaled by a multiplier:
rangeATR = ATR(2000) * mult (mult default 2.0)
An ATR over 2000 bars is almost flat — it barely reacts to any single bar. That is the point. It captures the instrument’s background volatility, its structural range, rather than the volatility of this moment. Because the yardstick is stable, the oscillator built on top of it stays comparable through time: a reading of +100 means the same thing across the whole chart, instead of drifting as short-term volatility expands and contracts.
3. The oscillator: distance measured in range-widths
With the mean and the yardstick in hand, the oscillator is simply the normalised distance:
osc = 100 * (close - mean) / rangeATR
So osc counts how many rangeATR price sits above or below the movement-weighted mean, scaled by 100. The two bands follow directly:
- osc between -100 and +100: price is within +/-1
rangeATRof the mean — contained in its normal volatility range. - osc crossing +100: price has pushed a full range-width above the mean — an upside breakout.
- osc crossing -100: a downside breakout.
The zero line is the movement-weighted mean itself; the sign of osc is the bias relative to it.
4. Colour by regime
The line colours itself by state, in priority order:
- Strong green when price breaks above the upper range edge (osc > 100).
- Strong red when price breaks below the lower edge (osc < -100).
- Blue on the bar where price crosses the mean — the moment the bias flips.
- Soft green / soft maroon for a contained up-bias / down-bias inside the range.
The colour and the band position tell the same story two ways, which makes the read instantaneous: warm and beyond the band is a break; muted and between the bands is a range.
Key Features at a Glance
- Movement-weighted mean: each close weighted by its absolute return, so the centre tracks where price actually worked; volume-free, so it applies to any instrument.
- Structural ATR normaliser: a near-constant, long-window volatility yardstick that keeps the oscillator comparable through time and across symbols.
- Fixed +/-100 bands: the range edges, expressed in range-widths rather than price, so the same thresholds mean the same thing everywhere.
- Regime colouring: strong green / red on breakouts, blue on a mean cross, soft green / maroon while contained.
- Sub-panel oscillator: its own panel below price; one line plus three reference levels (+100 / 0 / -100).
How to Read the Indicator
- The line is normalised distance from the mean. Hovering between the bands means price is inside its structural range — a ranging regime. The further the line rides from zero, the more stretched price is relative to its movement-weighted centre.
- The bands are the range edges. A push through +100 flags an upside breakout with a full range-width of extension; a drop through -100 flags a downside breakout. Because the yardstick is structural, these are not noise-level pokes — they are moves that are large relative to the instrument’s own long-run volatility.
- The zero cross is the bias flip. The line crossing zero (coloured blue on that bar) marks price crossing the movement-weighted mean, i.e. a change of side.
- Colour confirms the level. Strong green/red beyond the bands is a break; soft green/maroon between them is a contained trend bias.
Practical Applications
- Range-versus-breakout filter. Treat
|osc| < 100as a ranging regime — favour mean-reversion tactics, fading moves back toward zero. Treat a cross of +/-100 as a breakout trigger — favour continuation tactics in the breakout direction. - Breakout confirmation with structural scale. Because +/-100 is calibrated to long-run volatility, a break of the band is a higher bar than a break of a short-term channel; use it to filter out small excursions that a fast ATR would over-react to.
- Bias for other tools. The sign of
osc(price above or below the movement-weighted mean) is a clean directional context to overlay on momentum or structure signals — take longs preferentially whileosc > 0, shorts whileosc < 0. - Cross-instrument screening. Since the oscillator is self-normalising, a rule like “osc crosses above 100” flags range breakouts consistently across a watchlist regardless of each symbol’s price or volatility — a natural building block for a breakout screener.
Indicator Configuration
A single sub-panel oscillator, loaded in its own panel below the price.
length(default 50): Minimum Range Length — the number of bars in the movement-weighted mean. Larger values give a smoother, slower centre.mult(default 2.0): Range Width Multiplier — scales the structural ATR, i.e. how wide the +/-100 range is. Larger values widen the range and demand a bigger move to register a breakout.
Note on warm-up: the oscillator needs length bars for the weighted mean and enough history for the long ATR (200, ideally 2000). During that span the panel starts empty; once history is available the line and bands read normally.
Code
//----------------------------------------------
//PRC_Range Oscillator [Zeiierman]
//version = 0
//15.07.26
//Ivan Gonzalez @ www.prorealcode.com
//Sharing ProRealTime knowledge
//----------------------------------------------
// --- Parametros (ajustables en el panel del indicador) ---
length = 50      // Minimum Range Length: barras de la media ponderada
mult = 2.0       // Range Width Multiplier: ancho del rango en ATR
//----------------------------------------------
// --- ATR estructural (periodo largo con fallback) ---
//----------------------------------------------
if barindex >= 2000 then
   atrRaw = averagetruerange[2000]
else
   atrRaw = averagetruerange[200]
endif
rangeATR = atrRaw * mult
//----------------------------------------------
// --- Defaults (warmup) ---
//----------------------------------------------
ma = undefined
osc = undefined
sumWeightedClose = 0
sumWeights = 0
//----------------------------------------------
// --- Media ponderada por movimiento + oscilador ---
//----------------------------------------------
if barindex >= length then
   for i = 0 to length - 1 do
      delta = abs(close[i] - close[i + 1])
      w = delta / close[i + 1]
      sumWeightedClose = sumWeightedClose + close[i] * w
      sumWeights = sumWeights + w
   next
   if sumWeights <> 0 and rangeATR <> 0 then
      ma = sumWeightedClose / sumWeights
      osc = 100 * (close - ma) / rangeATR
   endif
endif
//----------------------------------------------
// --- Direccion de tendencia (persistente, para el color) ---
//----------------------------------------------
if ma <> undefined then
   if close > ma then
      trendDir = 1
   elsif close < ma then
      trendDir = -1
   else
      trendDir = trendDir[1]
   endif
else
   trendDir = 0
endif
//----------------------------------------------
// --- Color del oscilador (cascada de prioridad) ---
// strongbull #09ff00 / strongbear #ff0000 / weakbull green /
// weakbear maroon / transicion blue
//----------------------------------------------
r = 41
g = 98
b = 255
if ma <> undefined then
   if close > ma + rangeATR then
      r = 9
      g = 255
      b = 0
   elsif close < ma - rangeATR then
      r = 255
      g = 0
      b = 0
   elsif trendDir <> trendDir[1] then
      r = 41
      g = 98
      b = 255
   elsif trendDir = 1 then
      r = 76
      g = 175
      b = 80
   else
      r = 136
      g = 14
      b = 79
   endif
endif
//----------------------------------------------
return osc coloured(r, g, b) style(line, 2) as "Range Oscillator", 100 coloured(128, 128, 128) style(dottedline) as "Upper Bound", 0 coloured(128, 128, 128) style(dottedline) as "Zero", -100 coloured(128, 128, 128) style(dottedline) as "Lower Bound"

Merci Ivan, ça a l'air sympa, on va rester!..