

Buy Low Sell High Composite
Finding a reliable entry signal often involves glancing at three or four different oscillators. You check the momentum, then the trend, then the volume… by the time you align them all, the opportunity might have passed.
The Buy Low Sell High Composite (BLSH) is a custom indicator designed to solve this problem. It aggregates four distinct technical factors into a single, normalized oscillator. By mathematically combining trend, momentum, and volume, the BLSH provides a “consensus” view of the market, helping you identify high-probability reversal and continuation zones.
The Logic: Four Pillars, One Signal
The strength of the BLSH lies in its normalization algorithm. Oscillators like RSI are bound between 0 and 100, while MACD is unbounded. To combine them effectively, the BLSH normalizes all inputs onto a scale of -1 to +1 before summing them up.
The composite is built upon these four pillars:
- RSI (Relative Strength Index): Measures the speed and change of price movements. It is normalized based on a 25-75 range to focus on overbought/oversold extremes.
- Elliott Wave Oscillator (EWO): Calculated as the difference between a 5-period and a 35-period EMA. This component captures the short-term wave momentum. To make it compatible with the other indicators, it is normalized using a dynamic range based on the ATR (Average True Range).
- MACD (Moving Average Convergence Divergence): Tracks the relationship between two moving averages. Like the EWO, the MACD and its Histogram are normalized dynamically using volatility (ATR) to ensure the signal adapts to changing market conditions.
- MFI (Money Flow Index): Unlike the others, MFI incorporates Volume. It ensures that price moves are supported by trading activity.
How to Interpret the BLSH
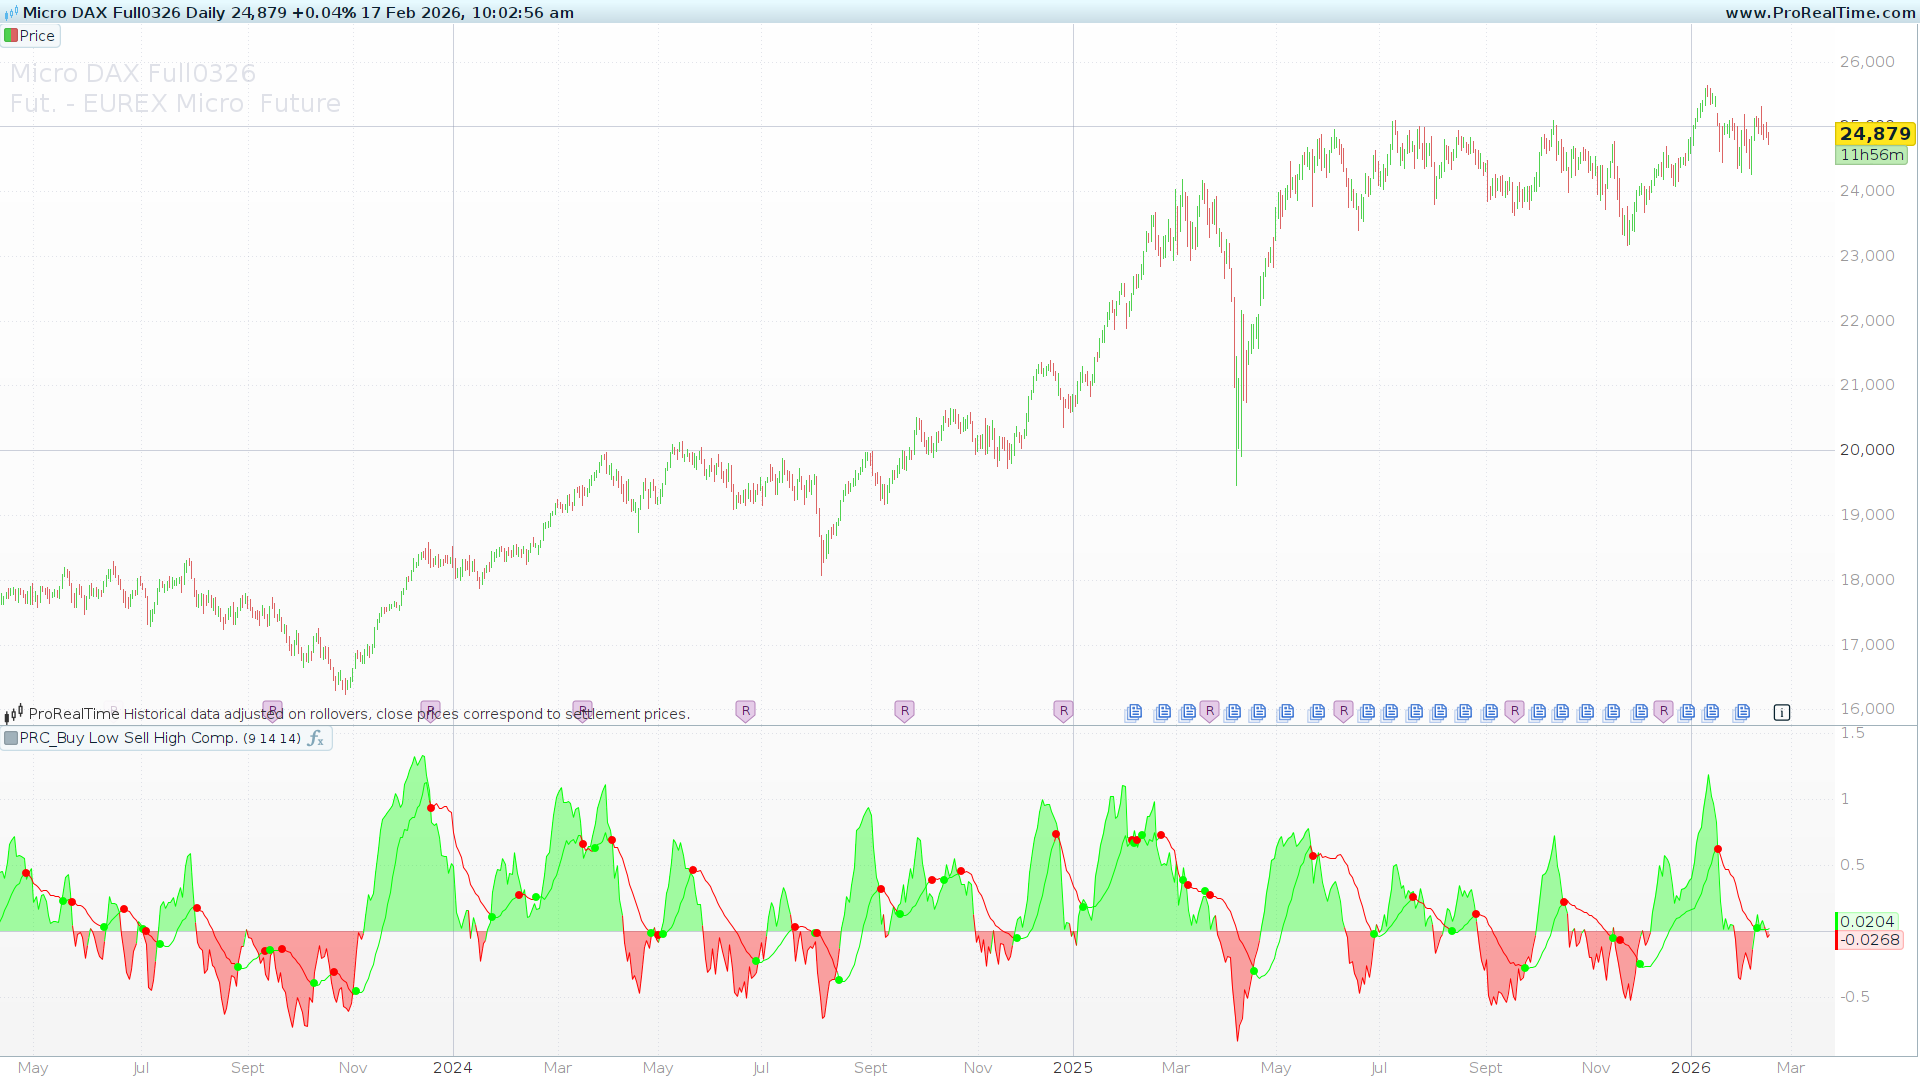
The indicator plots a Histogram and a Signal line that oscillate around a Zero Line.
- The Zero Line (Trend Bias):
- Above 0 (Lime): The consensus of the four indicators is Bullish. The market is likely in an uptrend or a strong impulsive move.
- Below 0 (Red): The consensus is Bearish. Momentum and volume suggest downward pressure.
- Signal Strength (The Histogram):
- The height of the histogram represents the intensity of the trend. A histogram expanding away from zero indicates strengthening momentum.
- A histogram shrinking towards zero suggests momentum decay and a potential reversal.
- Crossover Dots:
- The indicator plots colored dots when the internal MACD component crosses its signal line. These serve as early warning signs for potential entries or exits within the broader trend.
Configuration and Settings
The code is designed to be plug-and-play, but it offers key parameters for fine-tuning:
atrLen(Default: 9): Controls the volatility normalization. Increasing this smooths out the EWO and MACD components, making the indicator less reactive to sudden volatility spikes.rsiLen(Default: 14): The lookback period for the RSI component.mfiLen(Default: 14): The lookback period for the Money Flow Index (Volume).
The ProBuilder Code
//----------------------------------------
//PRC_Buy Low Sell High Composite (BLSH)
//version = 0
//23.01.2026
//Iván González @ www.prorealcode.com
//Sharing ProRealTime knowledge
//----------------------------------------
// Parameters
//----------------------------------------
atrLen = 9
rsiLen = 14
mfiLen = 14
//----------------------------------------
// 1. Base Calculations
//----------------------------------------
atrValue = AverageTrueRange[atrLen](close)
priceRange = 2 * atrValue
minRangeDiv = 0.0001 // Safe range to avoid division by zero
//----------------------------------------
// 2. RSI Calculation
//----------------------------------------
rsiVal = RSI[rsiLen](close)
rsiRange = 75 - 25
rsiValueNormalized = -1 + (((rsiVal - 25) / rsiRange) * 2)
//----------------------------------------
// 3. Elliott Wave (EMA Difference)
//----------------------------------------
emaDiff = ExponentialAverage[5](close) - ExponentialAverage[35](close)
ewRange = (priceRange - (-priceRange))
IF ewRange = 0 THEN
   ewRange = minRangeDiv
ENDIF
emaDiffNormalized = -1 + (((emaDiff - (-priceRange)) / ewRange) * 2)
//----------------------------------------
// 4. MACD Calculation
//----------------------------------------
fastMA = ExponentialAverage[12](close)
slowMA = ExponentialAverage[26](close)
macdVal = fastMA - slowMA
imacdSignal = Average[9](macdVal)
macdHistogram = macdVal - imacdSignal
// MACD Normalization
macdRange = priceRange - (-priceRange)
IF macdRange = 0 THEN
   macdRange = minRangeDiv
ENDIF
macdNormalized = -1 + (((macdVal - (-priceRange)) / macdRange) * 2)
macdSignalNormalized = -1 + (((imacdSignal - (-priceRange)) / macdRange) * 2)
macdHistogramNormalized = -1 + (((macdHistogram - (-priceRange)) / macdRange) * 2)
//----------------------------------------
// 5. MFI Calculation
//----------------------------------------
typicalP = TypicalPrice
posFlow = 0
negFlow = 0

FOR i = 0 TO mfiLen - 1 DO
   IF typicalP[i] > typicalP[i+1] THEN
      posFlow = posFlow + (volume[i] * typicalP[i])
   ELSIF typicalP[i] < typicalP[i+1] THEN
      negFlow = negFlow + (volume[i] * typicalP[i])
   ENDIF
NEXT

IF negFlow = 0 THEN
   mfiVal = 100
ELSE
   mfiVal = 100 - (100 / (1 + (posFlow / negFlow)))
ENDIF

mfiRange = 75 - 25
mfiValueNormalized = -1 + (((mfiVal - 25) / mfiRange) * 2)
//----------------------------------------
// 6. Composite Logic
//----------------------------------------
compositeValue = emaDiffNormalized + rsiValueNormalized + macdHistogramNormalized + mfiValueNormalized
// Final normalization between -4 and 4
compRange = 4 - (-4)
compositeNormalized = -1 + (((compositeValue - (-4)) / compRange) * 2)
//----------------------------------------
// 7. Colors and Styles
//----------------------------------------
// Composite Color (Lime if > 0, Red if <= 0)
IF compositeValue > 0 THEN
   compR = 0
   compG = 255
   compB = 0
ELSE
   compR = 255
   compG = 0
   compB = 0
ENDIF
// Crossover Logic for MACD Signal Color
IF macdVal >= imacdSignal THEN
   crossR = 0
   crossG = 255
   crossB = 0
ELSE
   crossR = 255
   crossG = 0
   crossB = 0
ENDIF
// Crossover Dot
crossoverValue = Undefined
IF macdVal CROSSES OVER imacdSignal OR macdVal CROSSES UNDER imacdSignal THEN
   crossoverValue = macdSignalNormalized
   drawpoint(barindex,crossoverValue,2)COLOURED(crossR, crossG, crossB)
ENDIF

colorbetween(compositeNormalized,0,compR, compG, compB,90)
//----------------------------------------
RETURN compositeNormalized COLOURED(compR, compG, compB) AS "Composite", macdSignalNormalized COLOURED(crossR, crossG, crossB) AS "MACD SignalNormalized"
