

TDFI Multi-Resolution — Adaptive Trend Force with Regime Detection
1. Introduction
The Trend Direction Force Index (TDFI) is a momentum oscillator that measures the strength and direction of a trend by combining two moving averages — a direct MA and a smoothed MA of that MA — and amplifying their combined impulse through a non-linear power function. It was originally designed as a simple trend filter, outputting a normalized signal between -1 and +1.
The TDFI Multi-Resolution takes this concept further by running three TDFI calculations at different time scales (fast, medium, slow) and blending them into a single composite signal. It replaces the static threshold levels with adaptive ones that expand and contract with market volatility, and adds a regime detection layer that classifies the market state based on the agreement between the three resolutions.
The result is an oscillator that not only tells you “up or down” but also how strong the consensus is across multiple horizons — and whether the market is trending, transitioning, or chopping.
2. How It Works
The Original TDFI Core
Each resolution computes the classic TDFI in four steps:
- Two moving averages: A primary MA (mma) applied to close×1000, and a secondary MA (smma) applied to the first. The ×1000 factor ensures the power function operates on meaningful values.
- Impulse: The average of both MAs’ bar-to-bar changes — how fast each MA is moving.
- Divergence weighting: The absolute distance between the two MAs. When they diverge, the trend is accelerating.
- Non-linear amplification: divergence × pow(impulse, 3). This is the key innovation — the power function acts as a natural noise gate. Small impulses (< 1) are crushed toward zero, while large impulses are amplified. The result is then normalized by the highest absolute value over a lookback window, producing a bounded signal in [-1, +1].
Multi-Resolution Architecture
Instead of a single TDFI, three instances run in parallel:
| **Fast** | 8 | Captures short-term momentum shifts and early reversals |
| **Medium** | 13 | Core trend signal — the “backbone” of the indicator |
| **Slow** | 21 | Provides context about the larger trend direction |
The composite signal is a weighted average: 25% fast + 50% medium + 25% slow. The medium layer carries double the weight because it represents the primary trading horizon, while the fast and slow layers provide early signals and trend context respectively.
This approach simulates multi-timeframe analysis without requiring request.security() (which is not available in ProBuilder). By using different lookback periods on the same timeframe, we get a layered view of momentum across horizons.
Adaptive Thresholds
Fixed threshold levels (like ±0.05) are a weak point in any oscillator — they assume constant volatility. The TDFI Multi-Resolution replaces them with dynamic levels based on the signal’s own standard deviation:
threshold = multiplier × max(std[50](composite), 0.02)
- When the market is volatile, the signal fluctuates more → thresholds widen → fewer false signals.
- When the market is quiet, the signal is calmer → thresholds tighten → you catch smaller moves earlier.
- A minimum floor of 0.02 prevents the thresholds from collapsing to zero during extremely flat periods.
Regime Detection
The most powerful addition. Each of the three TDFI layers is classified as bullish (+1), bearish (-1), or neutral (0) based on whether it exceeds the adaptive thresholds. The sum of these states produces a consensus score from -3 to +3:
| **+3** | Strong bullish | All three horizons agree — strong uptrend |
| **+2** | Bullish | Two layers bullish — established uptrend |
| **+1** | Bullish transition | One layer bullish — possible trend start or weak trend |
| **0** | Range / chop | No consensus — stay cautious |
| **-1** | Bearish transition | One layer bearish — possible downtrend emerging |
| **-2** | Bearish | Two layers bearish — established downtrend |
| **-3** | Strong bearish | All three horizons agree — strong downtrend |
The transition states (+1, -1) are particularly valuable — they mark the early stages where one horizon has turned but the others haven’t caught up yet.
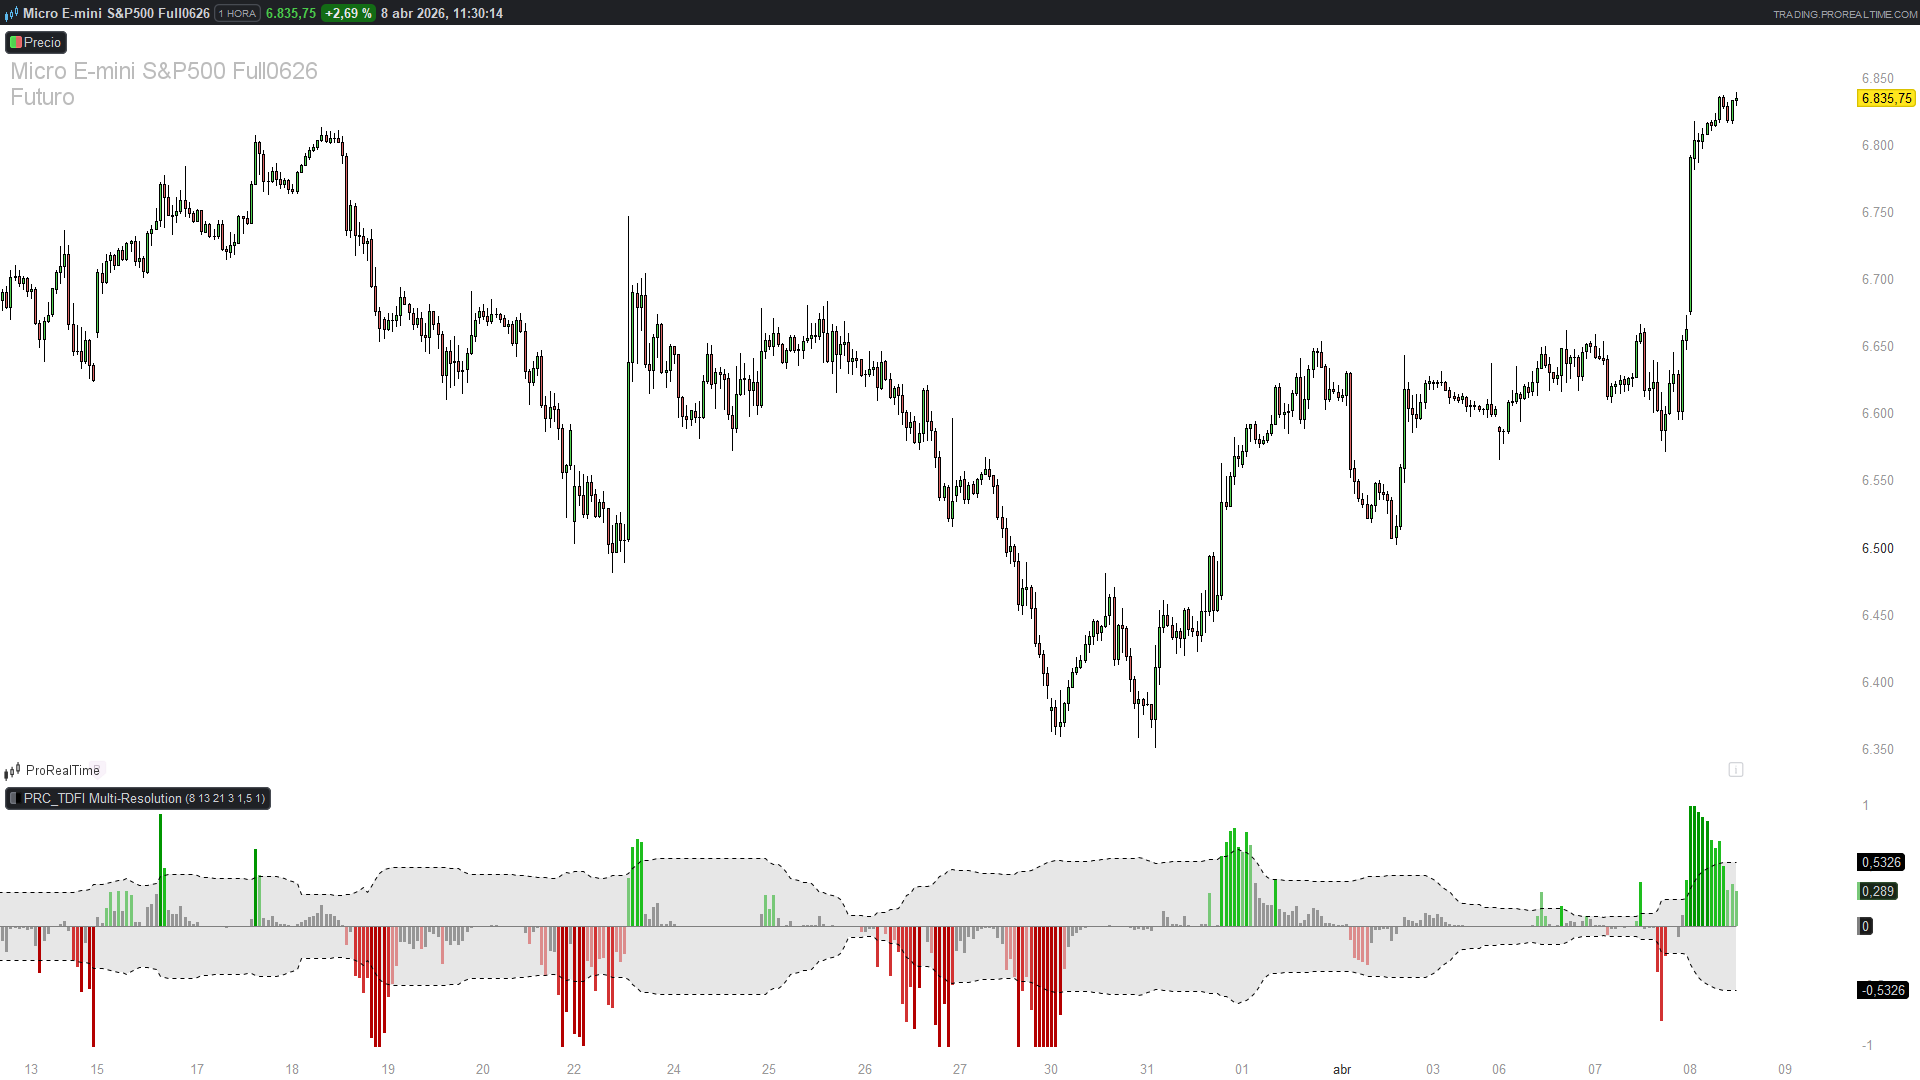
3. Reading the Indicator
The indicator displays in a sub-chart below price:
- Histogram (filled bars): The composite TDFI signal, colored by the 7-level regime gradient. Dark green = strong bullish consensus, dark red = strong bearish, gray = no consensus. The histogram provides visual weight and makes the regime immediately visible.
- Signal line (thick, on top of histogram): Same composite value with a clean edge for precise reading.
- Adaptive threshold lines (dotted): The dynamic upper and lower thresholds that expand and contract with volatility. The shaded area between them represents the “neutral zone”.
- Zero line (dotted): Static reference.
Key visual patterns to watch:
- Full green histogram breaking above the upper threshold: Strong bullish momentum confirmed by all layers — high-probability trend continuation.
- Color transition from gray to light green/red: A regime shift is beginning — one layer has committed, watch for the others to follow.
- Thresholds widening rapidly: Volatility is expanding — expect larger moves but wait for the composite to clear the thresholds.
- Signal oscillating within narrowing thresholds: Compression — a breakout may be imminent.
4. Practical Applications
- Trend confirmation: Use consensus = ±3 as a strong trend filter. Combine with a trend-following strategy — only take longs when all three layers agree.
- Early entry detection: Watch for consensus shifting from 0 to ±1. The fast layer has turned first — if the medium follows, it often signals the start of a tradeable move.
- Divergence identification: When the composite signal makes lower highs but the consensus remains at +2 or +3, the fast layer is weakening while the slow still holds. This internal divergence can precede reversals.
- Chop filter: When consensus = 0 and thresholds are narrow, the market is in a low-volatility range. Avoid trend strategies and consider mean-reversion approaches.
- Exit timing: A drop from consensus +3 to +1 means two layers have turned neutral or bearish — the trend is losing momentum. Consider tightening stops or taking partial profits.
5. Parameters
| `fastLength` | 8 | Period for the fast TDFI layer. Lower = more responsive, more noise. |
| `mediumLength` | 13 | Period for the medium (core) TDFI layer. The primary signal. |
| `slowLength` | 21 | Period for the slow TDFI layer. Higher = smoother, more lag. |
| `nPower` | 3 | Exponent for the non-linear amplifier. Higher = stronger noise suppression but more aggressive signal. |
| `threshMult` | 1.5 | Multiplier for adaptive thresholds. Higher = wider thresholds, fewer signals. |
| `maType` | 1 (EMA) | Moving average type. 0=SMA, 1=EMA, 2=WMA, 3=Wilders, 4=Triangular, 5=LSMA, 6=TimeSeries, 7=HMA, 8=ZLEMA. |
Tuning tips:
- For intraday scalping, try fastLength=5, mediumLength=8, slowLength=13.
- For daily swing trading, the defaults (8/13/21) work well.
- For weekly position trading, try fastLength=13, mediumLength=21, slowLength=34.
- Increase threshMult to 2.0 if you want fewer but higher-conviction signals.
6. Code
//------------------------------------------//
// PRC_TDFI Multi-Resolution
// version = 0
// 08.04.2026
// Iván González @ www.prorealcode.com
// Sharing ProRealTime knowledge
//------------------------------------------//

// === INPUTS ===
fastLength = 8       // Fast layer period
mediumLength = 13    // Medium layer period
slowLength = 21      // Slow layer period
nPower = 3           // Non-linear amplifier exponent
threshMult = 1.5     // Adaptive threshold multiplier
maType = 1           // MA type: 0=SMA, 1=EMA, 2=WMA...

// === TDFI FAST ===
mmaF = Average[fastLength, maType](close * 1000)
smmaF = Average[fastLength, maType](mmaF)
impetF = ((mmaF - mmaF[1]) + (smmaF - smmaF[1])) / 2
tdfF = ABS(mmaF - smmaF) * POW(impetF, nPower)
hF = HIGHEST[fastLength * nPower](ABS(tdfF))
IF hF = 0 THEN
   sigF = 0
ELSE
   sigF = tdfF / hF
ENDIF

// === TDFI MEDIUM ===
mmaM = Average[mediumLength, maType](close * 1000)
smmaM = Average[mediumLength, maType](mmaM)
impetM = ((mmaM - mmaM[1]) + (smmaM - smmaM[1])) / 2
tdfM = ABS(mmaM - smmaM) * POW(impetM, nPower)
hM = HIGHEST[mediumLength * nPower](ABS(tdfM))
IF hM = 0 THEN
   sigM = 0
ELSE
   sigM = tdfM / hM
ENDIF

// === TDFI SLOW ===
mmaS = Average[slowLength, maType](close * 1000)
smmaS = Average[slowLength, maType](mmaS)
impetS = ((mmaS - mmaS[1]) + (smmaS - smmaS[1])) / 2
tdfS = ABS(mmaS - smmaS) * POW(impetS, nPower)
hS = HIGHEST[slowLength * nPower](ABS(tdfS))
IF hS = 0 THEN
   sigS = 0
ELSE
   sigS = tdfS / hS
ENDIF

// === COMPOSITE SIGNAL ===
composite = 0.25 * sigF + 0.50 * sigM + 0.25 * sigS

// === ADAPTIVE THRESHOLDS ===
volSig = std[50](composite)
thresh = threshMult * MAX(volSig, 0.02)
fHigh = thresh
fLow = -thresh

// === REGIME DETECTION ===
IF sigF > fHigh THEN
   stF = 1
ELSIF sigF < fLow THEN
   stF = -1
ELSE
   stF = 0
ENDIF

IF sigM > fHigh THEN
   stM = 1
ELSIF sigM < fLow THEN
   stM = -1
ELSE
   stM = 0
ENDIF

IF sigS > fHigh THEN
   stS = 1
ELSIF sigS < fLow THEN
   stS = -1
ELSE
   stS = 0
ENDIF

consensus = stF + stM + stS

// === COLORS: 7-level regime gradient ===
IF consensus >= 3 THEN
   // Strong bullish
   r = 0
   g = 150
   b = 0
ELSIF consensus = 2 THEN
   // Bullish
   r = 30
   g = 190
   b = 30
ELSIF consensus = 1 THEN
   // Bullish transition
   r = 120
   g = 200
   b = 120
ELSIF consensus = 0 THEN
   // Range / chop
   r = 150
   g = 150
   b = 150
ELSIF consensus = -1 THEN
   // Bearish transition
   r = 220
   g = 140
   b = 140
ELSIF consensus = -2 THEN
   // Bearish
   r = 210
   g = 50
   b = 50
ELSE
   // Strong bearish
   r = 180
   g = 0
   b = 0
ENDIF

COLORBETWEEN(fHigh, fLow, 180, 180, 180, 80)
// === RETURN ===
RETURN composite COLOURED(r, g, b) AS "TDFI-MR" STYLE(histogram), fHigh AS "Thresh+" STYLE(DottedLine, 1), fLow AS "Thresh-" STYLE(DottedLine, 1), 0 AS "Zero" STYLE(Line, 1) coloured("grey")
