

Donchian Channels Strength Oscillator
Introduction
The Donchian Channels Strength indicator, originally published on TradingView by Daniel_Ge, rethinks the classic Donchian Channel as an oscillator rather than an overlay. Instead of plotting the N-period high and low around price, this indicator measures how far price has departed from the center of the channel, normalizes that distance by its own moving-average deviation, and maps the result onto a bounded 0-100 scale — very much like an RSI.
The outcome is a clean momentum reading that tells you not just whether price is above or below the Donchian midpoint, but how strongly it is trending away from it, making overbought/oversold zones meaningful in the context of the channel’s own structure.
Theory Behind the Indicator
The Donchian Channel defines two reference levels over the last length bars:
- upper = highest(src, length)
- lower = lowest(src, length)
The midpoint, or basis, sits halfway between them:
basis = (upper + lower) / 2
From here, the indicator departs from the classical Donchian formulation and builds a momentum-style oscillator:
- Measure the signed distance of price from the basis: dif = src – basis
- Compute a moving average of dif (can be positive or negative): ma_dif
- Compute a moving average of the absolute distance: ma_dif_abs
- Combine them into a bounded reading:
dc_strength = ma_dif / ma_dif_abs * 50 + 50
The key insight is that ma_dif / ma_dif_abs is always in the range [-1, +1] (since |avg(x)| ≤ avg(|x|)), so multiplying by 50 and adding 50 yields a value strictly in [0, 100] — the same scale as RSI.
How to Read the Indicator
| `dc_strength = 50` | Price averages sit on the Donchian midpoint — no directional bias |
| `dc_strength > 50` | Price has been consistently above the midpoint — bullish regime |
| `dc_strength < 50` | Price has been consistently below the midpoint — bearish regime |
| `dc_strength > 80` | Overbought: momentum is stretched against the channel midpoint |
| `dc_strength < 20` | Oversold: momentum is stretched against the channel midpoint |
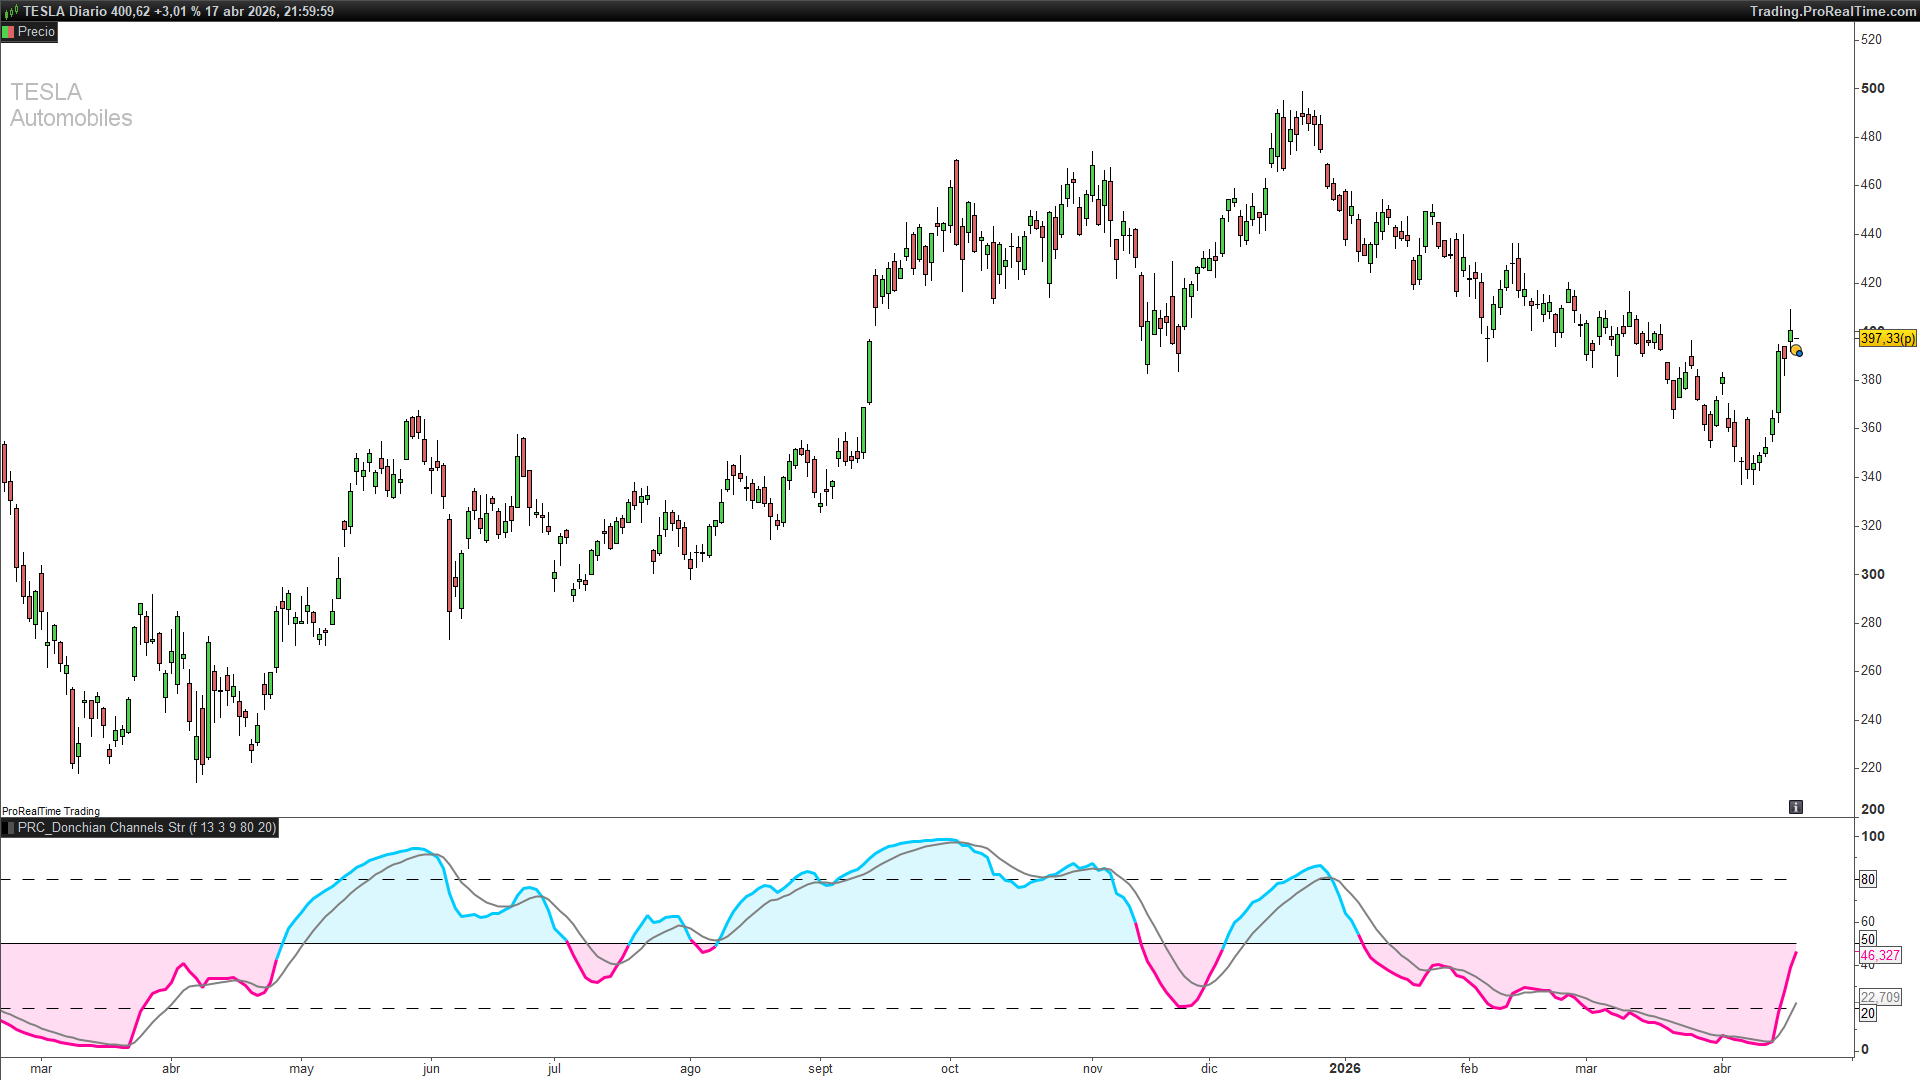
A 9-period EMA of the strength line is plotted on top as a signal line (similar to the MACD signal), useful for confirming crossovers through the 50 level.
The space between the 50 midline and the strength curve is filled with a dynamic color — cyan when bullish, magenta when bearish — offering an immediate visual read of the current regime.
Key Advantages Over a Standard RSI
| Feature | Standard RSI | Donchian Channels Strength |
|---------|--------------|----------------------------|
| Reference level | Average gain vs average loss | Distance from Donchian midpoint |
| Sensitivity to breakouts | Same response across all market conditions | Naturally adapts to the channel's own width |
| Information encoded | Pure momentum | Momentum **relative to structural levels** |
| Overbought/oversold meaning | Recent volatility | Displacement from structural center |
Because the reference is a structural level (the midpoint of the last 13 bars, by default), overbought/oversold readings have a more concrete meaning: they indicate that price has been sustainedly pressing one side of the channel, not just that short-term momentum is strong.
MA Type Switch
The indicator offers four moving-average options (selected via the maTypeInput parameter):
| Value | Type |
|-------|------|
| 0 | SMA — Simple Moving Average |
| 1 | EMA — Exponential Moving Average |
| 2 | WMA — Weighted Moving Average |
| 3 | SMMA / RMA — Smoothed / Running MA (default, matches Wilder's original RSI smoothing) |
The SMMA option is the default because it produces the smoothest readings and matches the mathematical spirit of Wilder’s original RSI — making the indicator directly comparable to a classical RSI in feel, even though its structural reference is very different.
Practical Applications
- Regime detection: Use crossovers of the 50 midline as primary trend signals. Above 50 = long bias, below 50 = short bias.
- Pullback entries: In an established regime (say, dc_strength > 50 for several bars), a dip toward 50 followed by an upward reaction can signal a trend-continuation entry.
- Exhaustion filter: Combine with price structure — a reading above 80 paired with a rejection candle near the Donchian upper band can indicate short-term exhaustion.
- Confluence with breakouts: When price breaks a traditional Donchian upper band AND dc_strength crosses above 50, the breakout has structural confirmation.
- Divergence: Price making a new high while dc_strength fails to do so is a classical bearish divergence — and vice versa.
Code
//--------------------------------------------------//
//PRC_Donchian Channels Strength
//version = 0
//20.05.24
//Iván González @ www.prorealcode.com
//Sharing ProRealTime knowledge
//--------------------------------------------------//
//-----Inputs---------------------------------------//
src=close
includeWicks=0//Boolean//Include Wicks
length=13
maTypeInput=3//0=SMA, 1=EMA 2=WMA, 3=SMMA (RMA)
signalLength=9//
overboughtZone=80//Overbought Zone
oversoldZone=20//Oversold Zone
//--------------------------------------------------//
//-----Calculations---------------------------------//
if includewicks then
lower=lowest[length](low)
upper=highest[length](high)
else
lower=lowest[length](src)
upper=highest[length](src)
endif


basis=(upper+lower)/2
dif=src-basis
//----MA DIF Calculations----------------------------//
source=dif
if maTypeInput=0 then
madif=average[length,0](source)
elsif maTypeInput=1 then
madif=average[length,1](source)
elsif maTypeInput=2 then
madif=average[length,2](source)
else
alpha = 1/length
if barindex <= 2*length then
madif = average[length](source)
else
madif = alpha*source + (1-alpha)*madif[1]
endif
endif
//--------------------------------------------------//
//----MA abs(DIF) Calculations----------------------//
source2=abs(dif)
if maTypeInput=0 then
madifabs=average[length,0](source2)
elsif maTypeInput=1 then
madifabs=average[length,1](source2)
elsif maTypeInput=2 then
madifabs=average[length,2](source2)
else
alpha = 1/length
if barindex <= 2*length then
madifabs = average[length](source2)
else
madifabs = alpha*source2 + (1-alpha)*madifabs[1]
endif
endif
//--------------------------------------------------//
//-----Strength-------------------------------------//
dcstrength=madif/madifabs*50+50
signalstrength=average[signallength,1](dcstrength)
//--------------------------------------------------//
//-----Colours----------------------------------------//
if dcstrength>50 then
r=0
g=203
b=255
else
r=255
g=0
b=153
endif
colorbetween(50,dcstrength,r,g,b,35)
//--------------------------------------------------//
return overboughtZone style(dottedline2), oversoldZone style(dottedline2), 50, dcstrength as "DC Strength"coloured(r,g,b)style(line,3),signalstrength as "Signal"coloured("grey")style(line,2)
