Ping Pong
Introduction
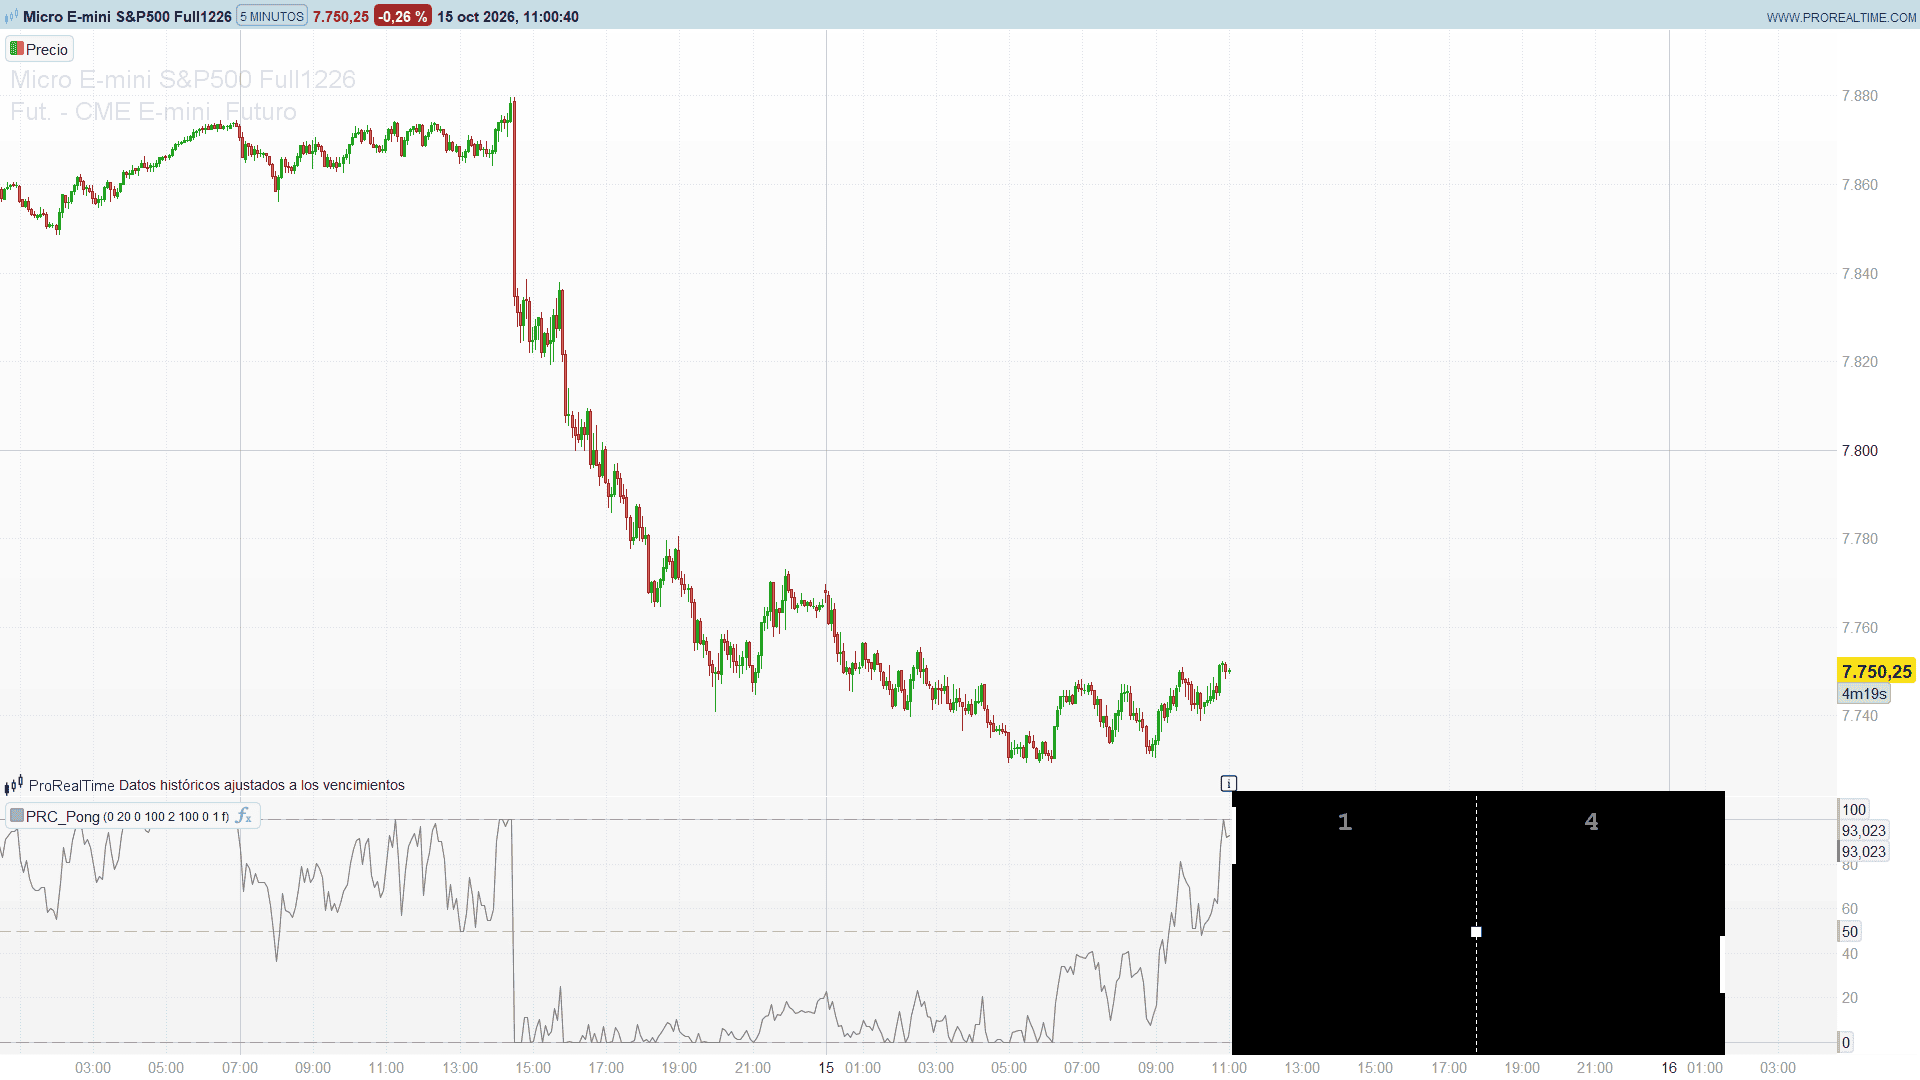
Not every indicator has to find the next trade. Pong turns the chart into the arcade classic: a game screen opens to the right of the last bar, the market controls the left paddle and the computer controls the right one. The ball moves with every new tick, bounces off the walls and the paddles, and the scoreboard keeps count of who is winning.
It is a light-hearted tool, but the left paddle is not random: it is a real oscillator built from price, so watching the game is also watching where price sits inside its recent range.
Theory Behind the Indicator
The market paddle is price scaled between 0 and 100 over a lookback window: 100 when the source is at the highest value of the last 100 bars, 0 when it is at the lowest. It is the position of price inside a Donchian channel, expressed as an oscillator:
market = (source – lowest) / (highest – lowest) * 100
An optional smoothing (EMA, SMA, VWMA, HMA or least squares) can be applied to that value, and the result is the vertical position of the left paddle. In Custom mode the raw source is used instead, with an upper and a lower boundary chosen by the user.
The screen is sized so that each paddle is one fifth of its height, which is the proportion of the original arcade game. The ball is served from the centre with a random slope. When it reaches a paddle, the point of contact decides the bounce:
- The central 60% of the paddle returns the ball with the same angle and speed.
- The upper and lower 20% either double the angle and the speed (when the ball comes from that side) or reverse the angle (when it comes from the other side).
The computer paddle follows the ball at a fixed fraction of its own height per update, but it stops chasing when the ball is moving away towards the market side. If a paddle misses, the other side scores and the ball is served again from the centre.
The whole game state is kept in arrays, which keep their value between ticks of the live bar. That is what lets the ball move one step with every new tick of the instrument.
Key Features at a Glance
- Playable Pong screen drawn ahead of the last bar, 160 bars wide.
- Market paddle driven by price scaled 0-100 over a lookback, or by the raw source between custom boundaries.
- Optional smoothing: EMA, SMA, VWMA, HMA or least squares regression.
- Computer paddle with adjustable speed.
- Three bounce types depending on where the ball hits the paddle.
- Live scoreboard for the market and the computer.
- Five display styles: Classic, CRT Glow, Amber Terminal, Oscilloscope and DOOM.
- The smoothed line, the data feed and the upper, middle and lower levels are also plotted under the game.
How to Read the Indicator
The left paddle is the market. When price is near the top of its recent range, the paddle is near the top of the screen; near the bottom of the range, it is near the bottom. A smoothing makes it move more slowly and miss more balls, a raw feed makes it twitchier.
The game advances with the ticks of the instrument itself, so its speed follows market activity: busy markets play fast, quiet ones play slowly, and with the market closed the game waits at the serve. Reloading the chart starts a new game.
The screen is drawn in the future part of the chart. To see it entirely, increase the right margin of the chart so that at least 165 bars are visible to the right of the last candle.
Practical Applications
- A visual reading of the range position: the paddle is a 0-100 oscillator of price within its recent range.
- A fun way to keep an eye on a live market: the ball only moves when ticks arrive, so a frozen game is also a sign of a quiet market.
- A teaching example: the code shows how to keep state between ticks with arrays and how to draw a full scene ahead of the last bar.
Indicator Configuration
- src (default: close): data source of the market paddle.
- maType (default 0): smoothing of the market paddle. 0 none, 1 EMA, 2 SMA, 3 VWMA, 4 HMA, 5 least squares regression. On instruments without volume, VWMA falls back to the simple average.
- maLen (default 20): length of the smoothing.
- customMode (default 0): 0 scales price 0-100 over the lookback, 1 uses the raw source between the custom boundaries.
- autoLen (default 100): lookback of the 0-100 scaling.
- cpuMulti (default 2): speed of the computer paddle, in percent of the paddle height per update (1 to 20).
- manualHst (default 100): upper boundary in Custom mode.
- manualLst (default 0): lower boundary in Custom mode. Boundaries can be negative.
- dispStyle (default 1): 1 Classic, 2 CRT Glow, 3 Amber Terminal, 4 Oscilloscope, 5 DOOM.
- darkChart (default 0): the lines plotted under the game use the style colours at half brightness so they are visible on a light background. Set it to 1 on a dark chart to use the exact colours.
The Code
//---------------------------------------------------------------
// PRC_Pong
// version = 0
// 15.10.2026
// Iván González @ www.prorealcode.com
// Author: SamRecio
// Sharing ProRealTime knowledge
//--------------------------------------------------------------------//
// The game screen is redrawn completely on every update
defparam drawonlastbaronly = true
//--------------------------------------------------------------------//
// Inputs
//--------------------------------------------------------------------//
src = customclose      // Data Source
maType = 0             // Smoothing: 0=None 1=EMA 2=SMA 3=VWMA 4=HMA 5=LSMA
maLen = 20             // Smoothing length
customMode = 0         // 0 = Auto (price scaled 0-100 over the lookback), 1 = Custom boundaries
autoLen = 100          // Market Lookback (Auto mode)
cpuMulti = 2           // CPU Paddle Speed % (1 to 20)
manualHst = 100        // Upper Boundary (Custom mode)
manualLst = 0          // Lower Boundary (Custom mode)
dispStyle = 1          // 1=Classic 2=CRT Glow 3=Amber Terminal 4=Oscilloscope 5=DOOM
darkChart = 0          // 0 = light chart background (lines outside the screen darkened), 1 = dark
//--------------------------------------------------------------------//
// Colors of each style: screen, paddles, ball and midline, score
//--------------------------------------------------------------------//
IF dispStyle = 2 THEN
   sR = 0
   sG = 17
   sB = 0
   pR = 0
   pG = 255
   pB = 0
   bR = 173
   bG = 255
   bB = 47
   kR = 204
   kG = 255
   kB = 204
ELSIF dispStyle = 3 THEN
   sR = 26
   sG = 12
   sB = 0
   pR = 255
   pG = 176
   pB = 0
   bR = 255
   bG = 217
   bB = 102
   kR = 255
   kG = 242
   kB = 204
ELSIF dispStyle = 4 THEN
   sR = 0
   sG = 27
   sB = 51
   pR = 0
   pG = 255
   pB = 255
   bR = 51
   bG = 255
   bB = 221
   kR = 153
   kG = 255
   kB = 255
ELSIF dispStyle = 5 THEN
   sR = 26
   sG = 0
   sB = 0
   pR = 255
   pG = 0
   pB = 0
   bR = 255
   bG = 77
   bB = 0
   kR = 255
   kG = 176
   kB = 0
ELSE
   sR = 0
   sG = 0
   sB = 0
   pR = 255
   pG = 255
   pB = 255
   bR = 255
   bG = 255
   bB = 255
   kR = 255
   kG = 255
   kB = 255
ENDIF
// Lines plotted on the chart background: the screen colors are made for a dark
// background, so on a light chart they are drawn at half brightness
IF darkChart = 1 THEN
   lpR = pR
   lpG = pG
   lpB = pB
   lkR = kR
   lkG = kG
   lkB = kB
ELSE
   lpR = round(pR / 2)
   lpG = round(pG / 2)
   lpB = round(pB / 2)
   lkR = round(kR / 2)
   lkG = round(kG / 2)
   lkB = round(kB / 2)
ENDIF
//--------------------------------------------------------------------//
// Market data: price scaled 0-100 between the highest and lowest of the lookback
//--------------------------------------------------------------------//
hh = highest[autoLen](src)
ll = lowest[autoLen](src)
IF barindex < autoLen - 1 THEN
   autoMarket = undefined
ELSIF hh > ll THEN
   autoMarket = (src - ll) / (hh - ll) * 100
ELSE
   // flat window: keep the last value
   autoMarket = autoMarket[1]
ENDIF
IF customMode = 1 THEN
   hst = manualHst
   lst = manualLst
   marketSrc = src
   warmSrc = 0
ELSE
   hst = 100
   lst = 0
   marketSrc = autoMarket
   warmSrc = autoLen - 1
ENDIF
//--------------------------------------------------------------------//
// Smoothing of the market paddle
//--------------------------------------------------------------------//
srcOk = 0
IF barindex >= warmSrc THEN
   srcOk = 1
ENDIF
IF srcOk = 1 THEN
   maIn = marketSrc
ELSE
   maIn = 0
ENDIF
// EMA seeded with the first valid value
emaAlpha = 2 / (maLen + 1)
IF srcOk = 1 AND srcOk[1] = 1 AND barindex > 0 THEN
   emaV = emaAlpha * maIn + (1 - emaAlpha) * emaV[1]
ELSE
   emaV = maIn
ENDIF
smaV = average[maLen](maIn)
hmaV = average[maLen, 7](maIn)
lsmaV = linearregression[maLen](maIn)
sumVol = summation[maLen](volume)
IF sumVol > 0 THEN
   vwmaV = summation[maLen](maIn * volume) / sumVol
ELSE
   // instrument without volume: plain average
   vwmaV = smaV
ENDIF
warmMa = warmSrc + maLen + floor(sqrt(maLen))
IF maType = 1 THEN
   maV = emaV
ELSIF maType = 2 THEN
   maV = smaV
ELSIF maType = 3 THEN
   maV = vwmaV
ELSIF maType = 4 THEN
   maV = hmaV
ELSIF maType = 5 THEN
   maV = lsmaV
ELSE
   maV = maIn
   warmMa = warmSrc
ENDIF
IF barindex < warmMa THEN
   maV = undefined
ENDIF
//--------------------------------------------------------------------//
// Screen geometry: the screen starts 2 bars ahead of the last bar
//--------------------------------------------------------------------//
offsetB = 2
widthB = 159
pSz = (hst - lst) / 4
topY = hst + pSz / 2
botY = lst - pSz / 2
leftX = barindex + offsetB
rightX = barindex + widthB + offsetB
xMid = floor((leftX + rightX) / 2)
yMid = (topY + botY) / 2
mktPos = min(hst, max(lst, maV))
//--------------------------------------------------------------------//
// Game engine: one step per update of the last bar.
// The game state lives in arrays on purpose: arrays are NOT rewound
// between ticks, so the ball keeps moving with every new tick.
//--------------------------------------------------------------------//
IF islastbarupdate THEN
   // New game on the first update
   IF isset($gOn[0]) = 0 THEN
      $gOn[0] = 1
      $mScore[0] = 0
      $cScore[0] = 0
      $cpuPos[0] = yMid
      $ballDir[0] = 1
      $newPt[0] = 1
      $sd[1] = (date MOD 30000) + 1
      $sd[2] = (opentime MOD 30000) + 1
      $sd[3] = (barindex MOD 30000) + 1
   ENDIF
   // Ball
   IF $newPt[0] = 1 THEN
      $ballX[0] = xMid
      $ballY[0] = yMid
      // random slope between -(hst-lst)/width and +(hst-lst)/width
      s1 = (171 * $sd[1]) MOD 30269
      s2 = (172 * $sd[2]) MOD 30307
      s3 = (170 * $sd[3]) MOD 30323
      $sd[1] = s1
      $sd[2] = s2
      $sd[3] = s3
      uu = s1 / 30269 + s2 / 30307 + s3 / 30323
      u = uu - floor(uu)
      slMax = (hst - lst) / widthB
      rawSl = slMax - 2 * slMax * u
      $ballSl[0] = floor(rawSl * 100 + 0.5) / 100
      $newPt[0] = 0
   ELSE
      $ballX[0] = $ballX[0] + $ballDir[0]
      $ballY[0] = $ballY[0] + $ballSl[0]
   ENDIF
   // CPU paddle follows the ball, except when the ball moves away from it
   cpuSpd = cpuMulti / 100 * pSz
   lookDir = sgn($ballY[0] - $cpuPos[0])
   cpuStep = lookDir * cpuSpd
   IF lookDir < 0 AND $ballSl[0] > 0 AND $ballDir[0] < 0 THEN
      cpuStep = 0
   ELSIF lookDir > 0 AND $ballSl[0] < 0 AND $ballDir[0] < 0 THEN
      cpuStep = 0
   ENDIF
   $cpuPos[0] = min(hst, max(lst, $cpuPos[0] + cpuStep))
   // Scoring and paddle hits
   mBot = mktPos - pSz / 2
   mTop = mktPos + pSz / 2
   cBot = $cpuPos[0] - pSz / 2
   cTop = $cpuPos[0] + pSz / 2
   bkHit = 0
   IF $ballDir[0] < 0 AND $ballX[0] <= leftX THEN
      IF $ballY[0] <= mTop AND $ballY[0] >= mBot THEN
         bkHit = 1
         bkTop = mTop
         bkBot = mBot
      ELSE
         $cScore[0] = $cScore[0] + 1
         $ballDir[0] = 1
         $newPt[0] = 1
      ENDIF
   ELSIF $ballDir[0] > 0 AND $ballX[0] >= rightX THEN
      IF $ballY[0] <= cTop AND $ballY[0] >= cBot THEN
         bkHit = 1
         bkTop = cTop
         bkBot = cBot
      ELSE
         $mScore[0] = $mScore[0] + 1
         $ballDir[0] = -1
         $newPt[0] = 1
      ENDIF
   ENDIF
   // Bounce: center 60% of the paddle = basic bounce,
   // upper and lower 20% = faster (A) or reversed angle (B)
   IF bkHit = 1 THEN
      bkUp = bkTop - pSz / 5
      bkLo = bkBot + pSz / 5
      bDir = $ballDir[0]
      bSl = $ballSl[0]
      IF $ballY[0] < bkLo THEN
         IF bSl < 0 THEN
            $ballSl[0] = bSl * 2
            $ballDir[0] = bDir * (-2)
         ELSE
            $ballSl[0] = bSl * (-1)
            IF bDir > 1 THEN
               $ballDir[0] = bDir / 2
            ELSE
               $ballDir[0] = bDir * (-1)
            ENDIF
         ENDIF
      ELSIF $ballY[0] > bkUp THEN
         IF bSl > 0 THEN
            $ballSl[0] = bSl * 2
            $ballDir[0] = bDir * (-2)
         ELSE
            $ballSl[0] = bSl * (-1)
            IF bDir > 1 THEN
               $ballDir[0] = bDir / 2
            ELSE
               $ballDir[0] = bDir * (-2)
            ENDIF
         ENDIF
      ELSE
         $ballDir[0] = bDir * (-1)
      ENDIF
   ENDIF
   // Top and bottom walls
   IF $ballY[0] <= botY OR $ballY[0] >= topY THEN
      $ballSl[0] = $ballSl[0] * (-1)
   ENDIF
   //-----------------------------------------------------------------//
   // Display
   //-----------------------------------------------------------------//
   DRAWRECTANGLE(leftX - 1, topY, rightX + 1, botY) COLOURED(sR, sG, sB) FILLCOLOR(sR, sG, sB, 255)
   DRAWSEGMENT(xMid, topY, xMid, botY) COLOURED(bR, bG, bB) STYLE(dottedline, 1)
   scoreY = topY - pSz / 2
   msX = round((leftX - 1 + xMid) / 2)
   csX = round((xMid + rightX + 1) / 2)
   mSc = $mScore[0]
   cSc = $cScore[0]
   DRAWTEXT("#mSc#", msX, scoreY, monospaced, bold, 28) COLOURED(kR, kG, kB, 128)
   DRAWTEXT("#cSc#", csX, scoreY, monospaced, bold, 28) COLOURED(kR, kG, kB, 128)
   DRAWRECTANGLE(leftX - 1, mktPos + pSz / 2, leftX, mktPos - pSz / 2) COLOURED(pR, pG, pB) FILLCOLOR(pR, pG, pB, 255)
   cpuP = $cpuPos[0]
   DRAWRECTANGLE(rightX, cpuP + pSz / 2, rightX + 1, cpuP - pSz / 2) COLOURED(pR, pG, pB) FILLCOLOR(pR, pG, pB, 255)
   ballXv = $ballX[0]
   ballYv = $ballY[0]
   DRAWTEXT("■", ballXv, ballYv, sansserif, bold, 14) COLOURED(bR, bG, bB)
ENDIF
//--------------------------------------------------------------------//
RETURN maV COLOURED(lpR, lpG, lpB) AS "MA", marketSrc COLOURED(lkR, lkG, lkB, 128) AS "Data Feed", hst COLOURED(lkR, lkG, lkB, 128) STYLE(dottedline2) AS "Upper", yMid COLOURED(lkR, lkG, lkB, 128) STYLE(dottedline2) AS "Mid-Line", lst COLOURED(lkR, lkG, lkB, 128) STYLE(dottedline2) AS "Lower"
Conclusion
Pong is a reminder that the chart can also be a playground. Behind the game there is a simple and useful idea, price scaled within its recent range, and a technique worth knowing for any indicator that needs to remember something between ticks of the live bar.