Williams’ Highs and Lows

v10.3
Williams’ Highs and Lows

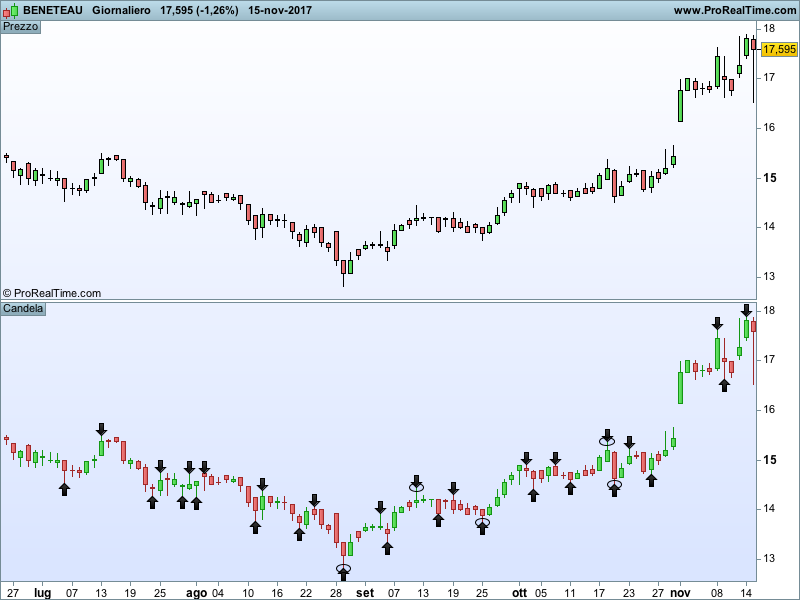
This code draws arrows to highlight Short Swing points and circles to highlight Intermediate Swing Points.

Whoever knows the book “Long-term secrets to short-term trading” will know how to use these points.

Blue skies!!

Share this

Risk disclosure:

No information on this site is investment advice or a solicitation to buy or sell any financial instrument. Past performance is not indicative of future results. Trading may expose you to risk of loss greater than your deposits and is only suitable for experienced investors who have sufficient financial means to bear such risk.

ProRealTime ITF files and other attachments : How to import ITF files into ProRealTime platform?

PRC is also on YouTube, subscribe to our channel for exclusive content and tutorials

  1. Al • 11/16/2017 #

    Gran bel lavoro Gabri, il libro di Larry Williams merita tanto.
    Sarebbe possibile sviluppare un sistema automatico con questo indicatore, che compri e venda in automatico? Che ne pensi?
    Sarebbe un’ottima base di partenza 🙂

  2. gabri • 11/16/2017 #

    Al,
    ci posso provare ma non so quando…mi sta nascendo una bimba a giorni 🙂 me lo segno e appena posso ci iniziero’ a lavorare.

  3. Al • 11/16/2017 #

    Grazie mille, e auguri per il lieto evento 🙂

  4. BZH22 • 11/16/2017 #

    Superbe indicateur ,tu peux créer un SCREENER qui sélectionne les actions avec les points et les cercles à l’ achat ?

    • gabri • 11/16/2017 #

      I will try to do the screener in a week or so

  5. maspap • 11/16/2017 #

    Una domanda Gabri: io ho il libro ma non capisco a quale capitolo tu ti riferisca.
    Grazie per la condivisione e la risposta nonchè auguri per la bimba che si chiamerà?…..

  6. swapping • 11/16/2017 #

    cool gabri, thank you 🙂

  7. gabri • 11/16/2017 #

    maspap, sono le pagine dalla 13 alla 32 della seconda edizione in inglese, il nome e’ Chiara.

  8. klaus • 11/16/2017 #

    thx a lot gabri, good work

  9. larouedegann • 11/16/2017 #

    Ciao gabri
    piccolo problema con le ellissi che vengono ridipinte (disegnare quindi cancellare) in base alle quotazioni future.

    • gabri • 11/16/2017 #

      laurodegann,
      le ellissi vengono dipinte quando viene rilevato un intermediate swing point that is a swing point with a higher swing point right and left (in case of a intermediate low swing point). The drawing of the circle happens with delay but this is normal

  10. larouedegann • 11/16/2017 #

    Mais il peut aussi disparaître lorsque il y a un retournement contraire……..je les tester en timeframe 5mn. Les flèches sont correctement dessinés .les ellipses sont dessinées bien plus tard parfois 4 ou 5 ou 10 chandeliers plus tard et peuvent disparaître aussi rapidement qu’elles ont été dessiné….
    Mais c’est un bon code quand même ……cela me fait penser au code STO qui fonctionne sur les futures cotations.Mais qui repeint..
    Donc a prendre avec modération..
    ciao

    • gabri • 11/16/2017 #

      I have never seen the ellipsis disappearing but I will check again the code. When the condition to draw the ellipsis remain the ellipsis is drawn and can disappear only when the initial condition is lost, meaning when a candle is changed because represented wrong. All the indicators and strategies have to be taken with moderation…that is why trading is risky 🙂

  11. BZH22 • 11/16/2017 #

    J’ ai testé en daily et Hebdo , l’ ellipse ne disparaît pas ,en revanche se qui est dommage ,je trouve aucune flêche en Daily sous la dernière bougie a la clôture .
    c’est normal ou pas ? Dans ce cas on prend position une journée en retard !!!

    • gabri • 11/16/2017 #

      To form an arrow, say for a high, you need a candle with a lower high the day prior and a lower high the day after (and no inside days). You are right, you need to wait the day after the high to see the arrow appearing but this is part of the strategy Williams uses. ALL the indicators of the world are lagging, the simple price is lagging because is the result of a transaction that happened in the past. Using Williams’ strategy you actually enter weeks after a Intermediate swing point….and you still make profit.

  12. BZH22 • 11/16/2017 #

    Si j’ ai bien compris ,tes points d’ entrée et tes sorties. quand tu as un point bas avec une ellipse,tu achète et quand tu as un point haut avec une ellipse , tu vend ?

    • gabri • 11/16/2017 #

      In a dime, if you want to go long you wait to intermediate swing points to form (ellipsis), with second one higher than the first one. You enter at the high of the previous day candle. This strategy is meant for daily trading. You should read the book to get better info, unfortunately I cannot shrink an entire paragraph in a few lines.

  13. BZH22 • 11/16/2017 #

    pour l’ entrée ,j’ ai bien compris ,mais la sortie de position ? même si j’ achète le livre ,se serai bien que tu détaille la base de la méthode avec l’ indicateur . Merci gabri

  14. gabri • 11/16/2017 #

    You can use the same system you used for the entry but reversed or use a target profit or use a trailing stop on the short swing points.

  15. BZH22 • 11/16/2017 #

    OK ,donc j’ attend la prochaine ellipse et je coupe la position .

  16. Violet • 11/16/2017 #

    Someone asked for a screener based on William’s Highs and Lows, Here’s one:

    // Wlliams’ Swingpoint Screener
    // 18-11-2017
    // Violet

    // Method uses price patterns exclusively
    // Therefore no parameters required

    trend = 1 // Assume initial trend is UP

    // Highs and lows of the bars/candles
    Insidebar = high low[1]
    if not Insidebar and high > mhi[1] then
    mhi = high
    mlo = low
    endif
    if not Insidebar and low < mlo[1] then
    mhi = high
    mlo = low
    endif

    // Trend reversal?
    if trend = 1 and mhi mlo[1] then
    trend = 1 // Swing Up
    endif

    c1 = trend crosses over trend[1]
    c2 = trend crosses under trend[1]

    screener [ c1 or c2 ] sort by trend

  17. Violet • 11/16/2017 #

    The upload process inexplicable mangled the program above. Here is another try:

    trend = 1 // Assume initial trend is UP

    // Highs and lows of the bars/candles
    Insidebar = high low[1]
    if not Insidebar and high > mhi[1] then
    mhi = high
    mlo = low
    endif
    if not Insidebar and low < mlo[1] then
    mhi = high
    mlo = low
    endif

    // Trend reversal?
    if trend = 1 and mhi mlo[1] then
    trend = 1 // Swing Up
    endif

    c1 = trend crosses over trend[1]
    c2 = trend crosses under trend[1]

    screener [ c1 or c2 ] sort by trend

  18. Violet • 11/16/2017 #

    Again it mangles the source code. This line should replace the ‘Inside Bar’ test:

    Insidebar = high low[1]

  19. Violet • 11/16/2017 #

    Also this block should replace the ‘Trend reversal’ section,

    // Trend reversal?
    if trend = 1 and mhi mlo[1] then
    trend = 1 // Swing Up
    endif

  20. Violet • 11/16/2017 #

    Moderator, why is the code repeatedly mangled during the upload process?

  21. Violet • 11/16/2017 #

    It happened again. I call it quits.

  22. BZH22 • 11/16/2017 #

    il faut que le screener ,sorte toutes les actions avec signal d’ achat ( flêche ellipse )

  23. BZH22 • 11/16/2017 #

    flêche ,avec ellipse

  24. Juan Salas • 11/16/2017 #

    Gabri,
    Congratulation and very good job. One of the best indicators I’ve seen so far. ;))))

    • gabri • 11/16/2017 #

      Thanks a lot Juan, I just coded what Williams created 🙂

  25. m-zeter • 11/16/2017 #

    Can somebody help me to code this in another way. I want no arrow at the barindex. i want sth like a=1 for DRAWARROWUP and a=2 for DRAWELLIPSE. I tried it, but i changed the indicator… :/

    • gabri • 11/16/2017 #

      write in line 3 and 4ppp=0
      qqq=0 and change the command drawarrow with ppp=1 and the command drawellipse with qqq=2.
      At the end add return ppp,qqq

  26. gabri • 11/16/2017 #

    write in line 3 and 4
    ppp=0
    qqq=0
    and change the command drawarrow with ppp=1 and the command drawellipse with qqq=2.
    At the end add return ppp,qqq

  27. Juanan71 • 11/16/2017 #

    Very good job and and way to automatice trades? instead drawcircle or arrows buy or sell??? im trying but i cant

  28. Juan Salas • 11/16/2017 #

    Yes Gabri, is there any way we can replace the command drawarrow or drawellipse for a command to buy or sell and change the indicator into an strategy?? Thanks so much.

    • Violet • 11/16/2017 #

      I have uploaded a screener (in the screener section) that hopefully does what you are asking for. It is currently under review, so if there no problems you will soon be able to use it.

    • gabri • 11/16/2017 #

      Hi all, I just had a baby and I pretty busy these days to enjoy this moments and to get some sleep 🙂 I will try to make a code to automatic trade, and/or a screener, but I don’t know when.

  29. Juan Salas • 11/16/2017 #

    Cool!!! So, Nicolas is reviewing it and when is OK he will display it in the screener Section?? Under which name?? In any case, thanks so much Violet

  30. Violet • 11/16/2017 #

    I named it ‘Williams Swing Points’.

  31. Juan Salas • 11/16/2017 #

    Thanks, looking forward to checking it out!!!!

  32. Stenozar • 11/16/2017 #

    Hi Gabri, I’m going to read the book but I ask you to give me a suggestion about how to use the indicator, if it’s possible. Thank you!

  33. gabri • 11/16/2017 #

    For long entries you enter as soon as a intermediate low swing point (the ellipsis) is formed above the prior intermediate low swing point. You normally exit based on timings, profit or trailing stop. The author explains also an exit based on the following rule:
    1. Take the difference between the highest intermediate high swing point and the lowest low before your entry
    2 add this value to the intermediate high swing point used in point 1 and this is the target price

  34. Abz • 11/16/2017 #

    Hello Gabri,
    how woud you make this code in a automated strategy? for example just to buy on low swing point ellipsis and short on high swing point ellipsis ?

    • gabri • 11/16/2017 #

      Abz,
      some indicators work really well with automated trading (AT) and some don’t. This, in my opinion, it’s not the best for AT because of its complexity. The post above yours describes the entry setup suggested by Williams and, as you can see, it’s not the easiest to code and to run smoothly for all the commodities. Probably with stronger coding softwares it would be easier but PRT has some limits that make this indicator difficult to use with AT. This is just my opinion though, I don’t AT.

  35. Violet • 11/16/2017 #

    Gabri, I tweaked the “Williams Highs and Lows” indicator by:

    (1) Visually pointing to the candle where a Larry Williams pattern setup is actually completed, and becomes valid, and
    (2) indicating the actual entry point on that particular candle

    Look at this code: drawtext(“▾”,barindex,low[1]-ticksize/3, dialog,bold,20)

    Small Unicode triangles are used.

    By doing so, people are no longer confused as to *when* and at *what price* the actual entry/exit points occur.
    The arrows and ellipses are drawn on past candles, but no sooner and only then when the actual completion points are flagged. The signs (arrow, ellipse and triangle) mark both the start and the finish of the price pattern. A pattern comprises a minimum of two candles, but sometimes several more than that. People tend not to understand this.

    The suggestion is to replace the existing indicator in the library with this updated one.

    Here is the code:

  36. Violet • 11/16/2017 #

    //computation of the radius to draw ellipses
    radius=average[200](range)/4

    //formula to compute short term swing points
    Insidebar = high low[1]
    if ( high > alto[1]) and not insidebar then
    alto = high
    basso = low
    markup = barindex
    markhigh = high
    endif
    if ( low < basso[1]) and not insidebar then
    alto = high
    basso = low
    markdown = barindex
    marklow = low
    endif

    if alto < alto[1] and trend = 1 then
    trend = 0
    mediummarkup = shortmarkup
    shortmarkup = markup
    longmarkhigh = mediummarkhigh
    mediummarkhigh = shortmarkhigh
    shortmarkhigh = markhigh
    //intermediate high swing points
    if longmarkhigh shortmarkhigh then
    DRAWELLIPSE(mediummarkup -1 , mediummarkhigh – radius, mediummarkup + 1, mediummarkhigh+radius)
    else
    drawarrowdown(markup,markhigh) coloured(255,0,0)
    drawtext(“▾”,barindex,low[1]-ticksize/3, dialog,bold,20)
    // Sellpoint = low[1] – ticksize
    endif
    endif

    if basso > basso[1] and trend = 0 then
    trend = 1
    mediummarkdown = shortmarkdown
    shortmarkdown = markdown
    longmarklow = mediummarklow
    mediummarklow = shortmarklow
    shortmarklow = marklow
    //intermediate low swing points
    if longmarklow > mediummarklow and mediummarklow < shortmarklow then
    DRAWELLIPSE(mediummarkdown – 1, mediummarklow – radius, mediummarkdown + 1, mediummarklow + radius)
    else
    drawarrowup(markdown,marklow) coloured(0,0,255)
    drawtext("▴",barindex,high[1]+ticksize/3, dialog,bold,20)
    // Buypoint = high[1] + ticksize
    endif
    endif

    //drawcandle(open,high,low,close)

    return 1

    • gabri • 11/16/2017 #

      Violet, great job. I also came up with this possible code:

  37. JSTAR PRODUCTIONS • 11/16/2017 #

    Hi Gabri,

    Do I have to have certain features on to have the arrows etc drawn on the charts.

    Regards

    Jae

    • gabri • 11/16/2017 #

      You get an arrow when a new short term high/low is defined (without inside days). You get a circle when an intermediate hi/low is spotted.

  38. Juan Salas • 11/16/2017 #

    Hi Violet,

    Nice code. There are some signs missing. Would you mind to tell? Thanks.

    Line 5:
    //formula to compute short term swing points
    Insidebar = high ? low[1]

    Line 27:
    //intermediate high swing points
    if longmarkhigh ? shortmarkhigh then

    I have been trying to compute a code out of this, but it didnt work, so I am very interested in your modifications.
    Nice work,
    Juan

  39. Violet • 11/16/2017 #

    Juan, you can find the missing codes/signs in Gabri’s algorithm. They have not changed since then. Due to error that occur when uploading a program, the signs are dropped in a mysterious way.

  40. Juan Salas • 11/16/2017 #

    Hi Gabi,
    You are right. I filled the blanks from the original code, but there is a new part you have included (Insidebar), and I am just missing the first statement “Insidebar = high ? low[1]”. I have tried >, <, and =, but it seems like is not working. I just got a line as indicator.
    Thanks, Juan

  41. Juan Salas • 11/16/2017 #

    Sorry, I meant Violet

  42. gabri • 11/16/2017 #

    //computation of the radius to draw ellipses
    radius=average[200](range)/4

    //if golong=1 then
    //golong=0
    //endif
    //formula to compute short term swing points
    if (high>alto[1]) and not (highlow[1]) then
    alto=high
    basso=low
    markup=barindex
    markhigh=high
    endif
    if (low<basso[1]) and not (highlow[1]) then
    alto=high
    basso=low
    markdown=barindex
    marklow=low
    endif

    if alto<alto[1] and trend=1 then
    trend=0
    drawarrowdown(markup,markhigh)
    mediummarkup=shortmarkup
    shortmarkup=markup
    longmarkhigh=mediummarkhigh
    mediummarkhigh=shortmarkhigh
    shortmarkhigh=markhigh
    //intermediate high swing points
    if longmarkhighshortmarkhigh then
    DRAWELLIPSE(mediummarkup-1, mediummarkhigh-radius, mediummarkup+1, mediummarkhigh+radius)
    oldlongellipse=newlongellipse
    newlongellipse=mediummarkhigh
    if newlongellipsebasso[1] and trend=0 then
    trend=1
    drawarrowup(markdown,marklow)
    mediummarkdown=shortmarkdown
    shortmarkdown=markdown
    longmarklow=mediummarklow
    mediummarklow=shortmarklow
    shortmarklow=marklow
    //intermediate low swing points
    if longmarklow>mediummarklow and mediummarklowoldshortellipse then
    DRAWSEGMENT(barindex-1, high[1], barindex+5, high[1]) coloured (0,0,250)
    endif
    endif
    endif

    drawcandle(open,high,low,close)
    return

  43. gabri • 11/16/2017 #

    I forgot, the red lines are the enter prices for short positions and the blue lines the enter prices for long positions. I would suggest to add some percentage of ATR to this entry levels and to confirm with volumes at least.

  44. Abz • 11/16/2017 #

    Hello Gabri and Violet , is it possible to post the code in full on a new forum tread? there are som missing parts her and there on both codes in this thread.

  45. Rolanbay • 11/16/2017 #

    Bonsoir Gabri,

    Merci pour votre fabuleux indicateur.
    C’est le premier indicateur que j’utilise avec lequel j’ai réalisé que des trades gagnants jusqu’à présent.
    Encore merci.

  46. Rolanbay • 11/16/2017 #

    Do you use a particular screener for Williams Higs et Lows ?

    • gabri • 11/16/2017 #

      Violet and I came up with a possible screener in the comments above

    • Matt B • 11/16/2017 #

      RolanBay, L’ellipse apparaît-elle à la bougie notifiée et reste ?

  47. Rolanbay • 11/16/2017 #

    Is this screener of Violet ? “Trend reversal and continuation patterns” where no?

  48. gabri • 11/16/2017 #

    This is the one I suggested

    if (high>alto[1]) and not (highlow[1]) then
    alto=high
    basso=low
    markup=barindex
    markhigh=high
    endif
    if (low<basso[1]) and not (highlow[1]) then
    alto=high
    basso=low
    markdown=barindex
    marklow=low
    endif

    if altoimhighnew then
    refhigh=mediummarkup
    endif
    endif
    if basso>basso[1] and trend=0 then
    trend=1
    mediummarkdown=shortmarkdown
    shortmarkdown=markdown
    longmarklow=mediummarklow
    mediummarklow=shortmarklow
    shortmarklow=marklow
    //intermediate low swing points
    if longmarklow>mediummarklow and mediummarklow<shortmarklow then
    imlowold=imlownew
    imlownew=mediummarklow
    //reflow=shortmarkdown
    endif
    if imlowoldimhighnew and (highest[barindex-refhigh+1](high))<=mediummarkhigh

    screener[c1 and not c2] (c1)

  49. gabri • 11/16/2017 #

    And you can find Violet’s screener here
    https://www.prorealcode.com/prorealtime-market-screeners/williams-swing-points/

  50. Rolanbay • 11/16/2017 #

    I get an assignment error? but where ?

  51. gabri • 11/16/2017 #

    Je n’ai pas compris

  52. Rolanbay • 11/16/2017 #

    Bonsoir,
    J’observe avec grand plaisir que vous parlez mieux français que moi!!!
    Simplement, je reçois un message d’erreur d’assignation lorsque je lance mon screener.

    • gabri • 11/16/2017 #

      J’utilise google translator mais j’étudie le français pur 8 ans à l’école 🙂 que dit l’erreur?

  53. Rolanbay • 11/16/2017 #

    Erreur de syntaxe dans l’assignation

  54. gabri • 11/16/2017 #

    Ok, this website cuts lines of code, let me see what I can do

  55. gabri • 11/16/2017 #

    I just sent the screener code to be reviewed and published. As soon as it gets released I will post the link.

  56. Rolanbay • 11/16/2017 #

    OK merci beaucoup

  57. gabri • 11/16/2017 #

    Here the link for the screener https://www.prorealcode.com/prorealtime-market-screeners/screener-williamss-highs-lows/

  58. Rolanbay • 11/16/2017 #

    Yessss! ce coup-ci est le bon. Formidable, merci beaucoup.

  59. BZH22 • 11/16/2017 #

    Bonjour Rolanbay .
    tu peux détailler ta méthode de trading avec l’ indicateur et le screener.tu applique un money management ?
    Cordialement .

  60. Rolanbay • 11/16/2017 #

    C’est très simple. D’abord je suis novice. Ensuite je je recherche uniquement sur tendance haussière, j’utilise le screener de Gabri, puis un backtest de Doctrading pour les stratégies.
    Le résultat me semble plus que prometteur. Bonne soirée.

  61. BZH22 • 11/16/2017 #

    rolanbay ,j’ ai bien compris ,mais tes points d’ entrée a l’ achat ,et de vente par rapport au flêches de l’ indicateur ?

  62. Rolanbay • 11/16/2017 #

    J’entre au moment de l’oscillation haussière consécutive à une forte baisse le tout en tendance haussière, je place un stoploss quand l’oscillation baissière apparait.

  63. Rolanbay • 11/16/2017 #

    Bonjour Gabri,
    Auriez-vous la stratégie qui correspond à l’indicateur Williams’ Highs and Lows ?

    • gabri • 11/16/2017 #

      You enter long when an intermediate low swing point is made (ellipsis) and you exit at target price or trailing stop.

  64. Rolanbay • 11/16/2017 #

    Think you

  65. Rolanbay • 11/16/2017 #

    Cette stratégie permet de conforter les choix avec votre indicateur :
    // Taille des positions
    // Valable pour un capital de 10.000 euros à chaque position,
    // pour les actions
    capital = 10000+strategyprofit
    n = capital / close
    n = round(n)

    // Daéfinition de la TENDANCE par les moyennes mobiles
    // Sur le PEA, on ne fait qu’ACHETER, et qu’en phase haussière
    MMlongue = average[200](close)
    MMmoyenne = average[80](close)
    MMcourte = average[45](close)

    // CONDITIONS POUR OUVRIR UNE POSITION ACHETEUSE
    a1 = MMcourte > MMmoyenne and MMmoyenne > MMlongue
    a2 = MMlongue > MMlongue[13] and MMmoyenne > MMmoyenne[13] and MMcourte > MMcourte[13]
    a3= (average[2] crosses under average[5](close))
    IF a1 and a2 and a3 THEN
    BUY n shares AT MARKET
    ENDIF
    // CONDITIONS POUR FERMER UNE POSITION ACHETEUSE
    v1 = (average[2] CROSSES over average[10](close))
    IF v1 THEN
    SELL AT MARKET
    ENDIF

  66. leornidas • 11/16/2017 #

    Buenos Días,

    ¿podrias indicarme el libro de referencia de la estrategia?

    Gracias.

    • gabri • 11/16/2017 #

      The book is “long term secret to short term trading”

  67. Ste • 11/16/2017 #

    https://www.prorealcode.com/topic/williams-indicator/
    link strategy by Nicolas

  68. gianninoforever • 11/16/2017 #

    Buongiorno, ho poca esperienza e volevo chiedere se è possibile creare un trading system che usi questa tecnica, che vada long e short seguendo le frecce dell’indicatore.

  69. gianni68 • 11/16/2017 #

    Buongiorno è possibile creare un trading system automatico che segua questo indicatore ? cioè quindi che va long o short in base alla freccia che compare ? non sono esperto e spero che qualcuno mi possa aiutare. Grazie

  70. gabri • 11/16/2017 #

    Gianni, io non faccio trading automatico ma sono sicuro che Nicolas ti potra’ aiutare.

  71. Matt B • 11/16/2017 #

    Bonjour, Savez-vous à combien de bougies après apparaît l’ellipse ? Il faut faire attention, elle n’apparaît pas tout de suite.

  72. gianlucapegaso • 11/16/2017 #

    scusa Gagry ma il programm da copiare è quello con tutte le modifiche di cui ho letto nei vari post..oppure bisgona copiare pezzi in giro e rifarlo da soli..? grazie mille!

  73. Valentinocorse • 11/16/2017 #

    bonjour a tous , superbe travail
    j’aimerai si possible une indication pour modifier l’indicateur pour n’avoir que les entrées flèches noires + flèches noires avec ellipses et que les flèches avec ellipses ( de sorties ) je ne souhaiterais pas avoir celles sans
    serait t’il aussi possible d’avoir un screener qu’avec les positions à l’achat (flèches noires + flèches noires avec ellipses )
    d’avance merci cordialement

avatar
Register or

Likes

avatar avatar avatar avatar avatar avatar avatar avatar avatar avatar avatar avatar avatar avatar avatar avatar

+21 more likes

Related users ' posts
GraHal Please forgive the daft question, but why is 3-bars-trailing-stop-williams-3.itf included a...
Kris75 Hi, Seems great but what would be the code for a stock ? Thanks, Chirs
oakenstream Paul, what is the best way in your opinion to know if I have over optimized?
Jessar Hello, could you tell me how to use this indicator? I think the simplest things can still be...
Al Ok grazie Gabri
Paul thnx for posting. Combine it with Williams’ 3 bar trailing stop to create strategy!
gabri Paul, he uses the best day of the week to trade (he figured out the best day to enter, exit...
Nicolas Your PRT version is inferior to 10.3? So the code in its default state is not compatible. A ...
Mbulelo Hi Nicolas Hope all is well your side, do you have a specific strategy for the MFT Swing ...
Nicolas No I don't, try to make it on your own, or ask in forums (follow the posting rules please).
Mr_Balagan Bonjour, j'ai quelques questions concernant cette combinaison d'indicateurs qui à l'air inté...
larouedegann STE : Fonction statistique "erreur standard" de séries temporelles de N périodes pour le pri...
Mr_Balagan Merci pour ces informations précieuses larouedegann. J'y vois plus clair. Encore joli boulot
Bougnat bonjour, ton screener semble intéressant .... merci pour le partage
guytrc Hi Nicolas - many thanks for your screener. One question if I may - how does condition 5 wor...
Nicolas In the last 20 periods, the SMA 10 periods was above the SMA 20 periods.
rispardin no entiendo como funciana este indicador, por favor alguien podria explicar como utilizarlo???
AVT No se trata de un solo indicador, pero cada linea muestra otra información, de abajo hacia ...
IV Mcm Your indicator is interesting, I evaluated its relevance with the squeeze to detect the phas...
reb Hello Marc your strat seems very intersting, will take a look Reb
897148 What exactly is meant by Total price? Is r1 =28 in your example the no of days for "Total P...
Regan2020 Hi, has anybody update the above code to enable on a 15m or 5m TF?
gigi64 ik heb de code op mijn pro realtime gezet , en bij indicator staat hij erbij maar komt niet ...
gigi64 I have put the code on my pro realtime, and it is on the indicator, but it does not appear o...
Nicolas
7 years ago
Haos Visual
Haos Visual
8
Indicators
Lyny @Nicolas, how can i put this code in ProOder when for example i want to buy 1 share with con...
Nicolas Please open a new topic on forums for coding requests, I'll help you there. 
Johan Swarts Lyny / Nicolas Please advise whether you proceded with the code in ProOrder and if so where...
Nicolas The code is correct, don't know if the label and color are the same as other trading softwar...
peppe novellino Hi Nicolas, the settings of the alligators are not editable. How can I change it? Thanks in ...
pabo_swe I got very bad performance with this script, it was slow... it seems like if one breaks out ...

Top