
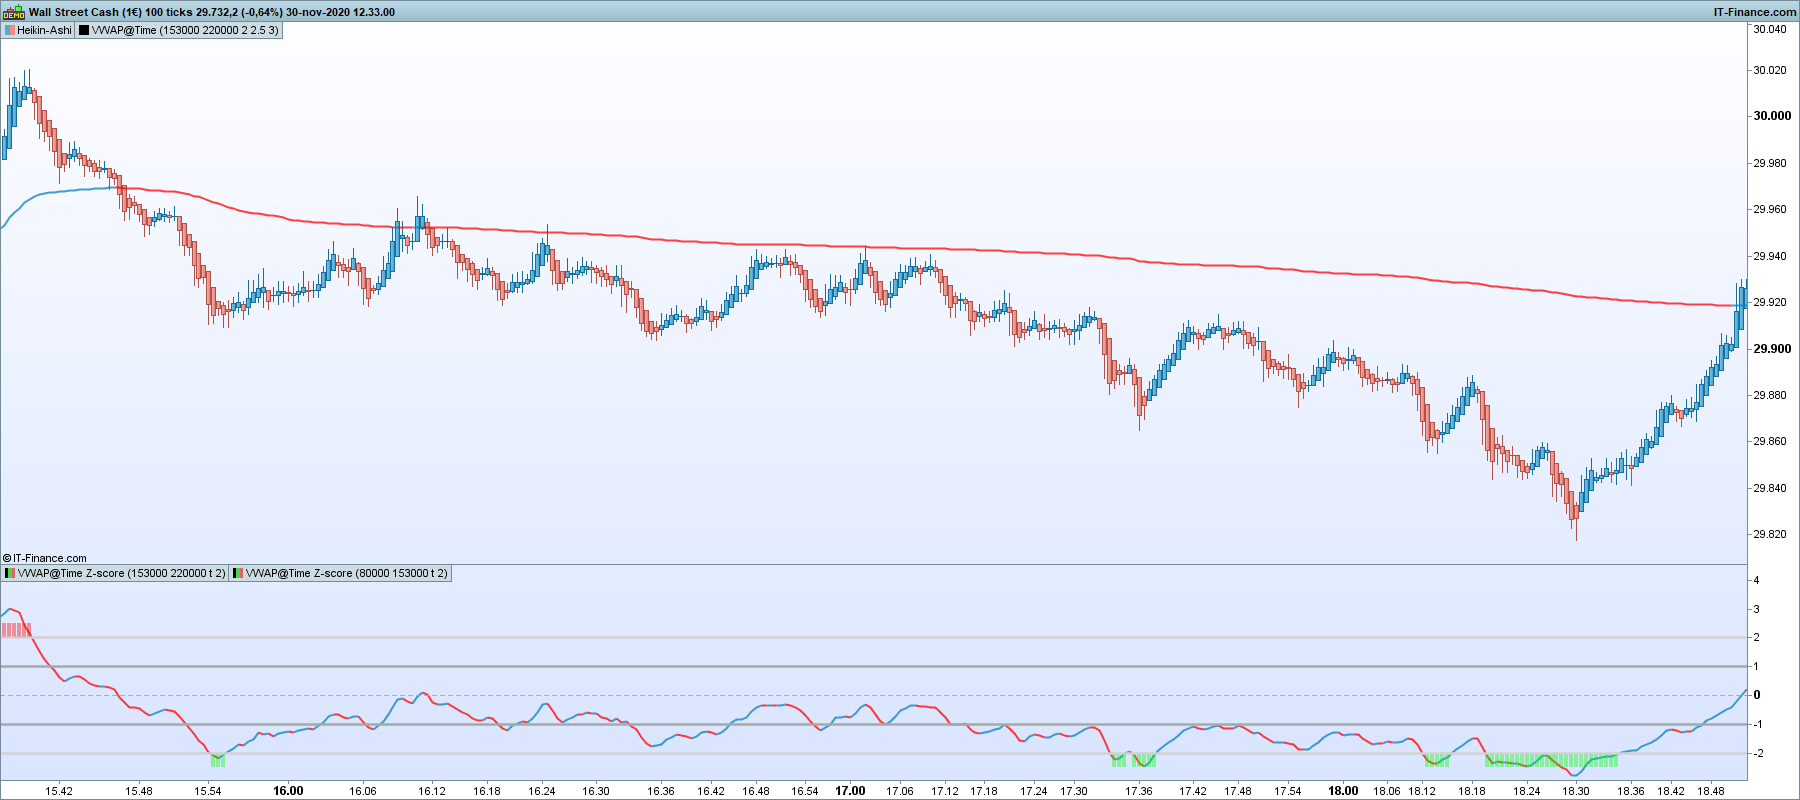
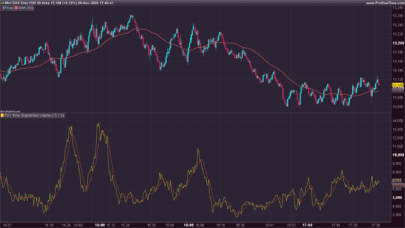
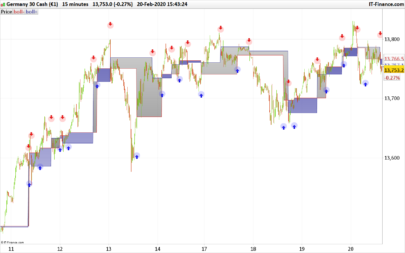
In this indicator, the Z-Score distance is the current standard deviation from the intraday VWAP of the price.
If it exceed a certain deviation (for example 2 standard deviations), the indicator highlights an oversold or overbought area from which the price could tend to return to its mean, the VWAP.
The VWAP is the Volume Weighted Average Price, in this indicator it is computed only for intraday trading and it resets at the defined startTime time value.
So the indicator has four inputs:
- “startTime“: the time at which the VWAP is reset and the Z-Score starts to be drawn
- “endTime“: the time at which the Z-Score iterrupts its drawing
- “smoothZscore“: whether to smooth the Z-Score curve or not
- “stdDev“: the Z-Score oversold/overbought level
|
1 2 3 4 5 6 7 8 9 10 11 12 13 14 15 16 17 18 19 20 21 22 23 24 25 26 27 28 29 30 31 32 33 34 35 36 37 38 39 40 41 42 43 44 45 46 47 48 49 50 51 52 53 54 55 56 57 58 59 60 61 62 63 64 65 66 67 68 69 70 |
// VWAP@Time intraday Z-Score // 17.11.2020 // Daniele Maddaluno // // startTime = 80000 // endTime = 153000 // smoothZscore = f // stdev = 2 once posLev1=+stdev/2 once negLev1=-stdev/2 once posLev2=+stdev once negLev2=-stdev if opentime < startTime or opentime > endTime then n = 0 zscoreT = 0 priced = 0 shared = 0 summ = 0 vwap = close vwapstd = 0 else n = n + 1 // This if has been added just for plot reasons if n <= 1 then zscoreT = 0 else zscoreT = 190 endif priced = priced + (totalprice*volume) shared = shared + volume if shared>0 then vwap = priced/shared summ = summ + square(totalprice - vwap) vwapstd = sqrt(summ / n) endif endif if smoothZscore then zscore = average[3]((close-vwap)/vwapstd) else zscore = (close-vwap)/vwapstd endif if zscore>=posLev2 then drawcandle(posLev2, posLev2*1.25, posLev2, posLev2*1.25) coloured(255, 0, 0, 100) bordercolor(0, 0, 0, 0) endif if zscore<=negLev2 then drawcandle(negLev2, negLev2*1.25, negLev2, negLev2*1.25) coloured(0, 255, 0, 100) bordercolor(0, 0, 0, 0) endif // Manage the coloring of vwap mid line if zscore > zscore[1] then dwapR = 0 dwapG = 128 dwapB = 192 else dwapR = 255 dwapG = 0 dwapB = 0 endif return zscore coloured(dwapR, dwapG, dwapB, zscoreT) style(line, 2) as "Z-score", posLev1 coloured(168, 168, 168) style(line, 2) as "Level +stdev/2", posLev2 coloured(210, 210, 210) style(line, 2) as "Level +stdev", negLev1 coloured(168, 168, 168) style(line, 2) as "Level -stdev/2", negLev2 coloured(210, 210, 210) style(line, 2) as "Level -stdev", 0 coloured(168, 168, 168) style(dottedline) as "Level 0" |
Share this
No information on this site is investment advice or a solicitation to buy or sell any financial instrument. Past performance is not indicative of future results. Trading may expose you to risk of loss greater than your deposits and is only suitable for experienced investors who have sufficient financial means to bear such risk.
ProRealTime ITF files and other attachments :
Find other exclusive trading pro-tools on ![]()
PRC is also on YouTube, subscribe to our channel for exclusive content and tutorials


If you need to use it in PRT v11 take a look at this topic:
https://www.prorealcode.com/topic/prt-11-indicator-disappears-from-screen-when-visually-scrolling-at-barindex1/
Hi Daniele
Thank you for the indicator, it looks very good.
However, I have a problem sometimes that it produces a very very large score for WAP – up to 200,000G!!!
I am using your standard settings, any idea?
thanks
Thanks very much for sharing, look forward to testing this idea out.
Thank you Daniele for making this script, I know its been some time since the release but would it be possible to tweak the mid vwap line into candles instead, would love to see it with f.ex heikin ashi.
Tried doing it myself without success..
BR,
Mathias