Volume Weighted Moving Average (VWMA)

Volume Weighted Moving Average (VWMA)

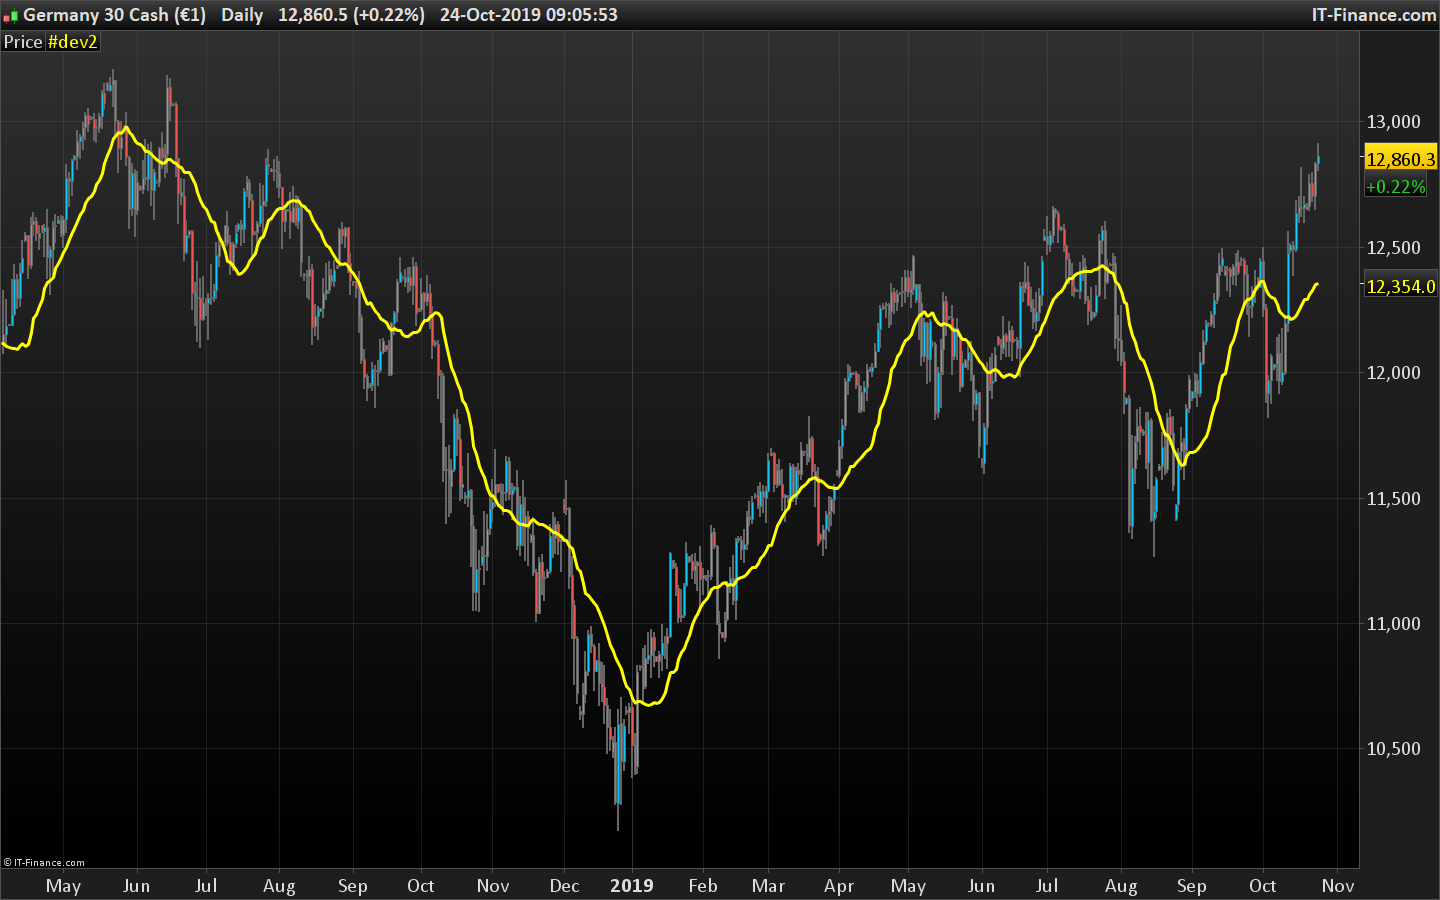
I know the Volume Weighted Moving Average indicator is available in PRT as an indicator but the code is not available for strategy building so I created the code.

Formula: 3-Day VWMA = (C1*V1 + C2*V2 + C3*V3) / (V1+ V2+ V3)

Where C is close and V is volume

Basic strategy as from “https://www.tradingsetupsreview.com/volume-weighted-moving-average-vwma/

To fully make use of the Volume Weighted Moving Average (VWMA), compare it with a SMA that does not include volume.

The SMA is a benchmark. This means that you should choose the same look-back period for both the SMA and the VWMA.  The only difference between the two moving averages is volume weighting.

What matters here is the gap between the VWMA and the SMA. Their difference shows the effect of volume weighting.

Generally, volume should increase along with the trend and decrease against it. Hence, generally, if the VWMA is above the SMA, it means that volume has been higher on up days. When the VWMA is below the SMA, it shows that down days had higher volume.

The Volume Weighted Moving Average has the ability to help discover emerging trends, identify existing ones and signal the end of a move.

What it does is to incorporate not only the last x periods of price into its calculation but also the average volume during those x periods. That means when the volume is stronger, the VWMA will follow price more closely, and when volume falls off, it will mimic a simple moving average. The VWMA does not make a difference between buying and selling volume, only the strength of volume itself, so it will simply get closer to the close of the day when volume increased on that day, no matter whether it is a bearish or a bullish close.

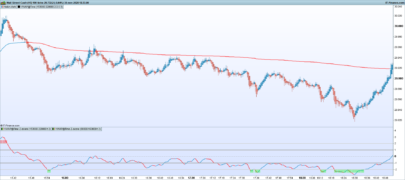
Important is – if the VWMA is above the SMA, we are moving in an uptrend, and when it is below, we do have bearish implications. Or even simpler, as long as the VWMA is between price and the SMA, we are trending in that direction.

Share this

Risk disclosure:

No information on this site is investment advice or a solicitation to buy or sell any financial instrument. Past performance is not indicative of future results. Trading may expose you to risk of loss greater than your deposits and is only suitable for experienced investors who have sufficient financial means to bear such risk.

ProRealTime ITF files and other attachments : How to import ITF files into ProRealTime platform?

PRC is also on YouTube, subscribe to our channel for exclusive content and tutorials
  1. Marie-Eve Vergoz • 10/24/2019 #

    Bonsoir –
    Voici l’erreur qui est signalée lorsque je souhaite utiliser cet indicateur : il est demandé de définir “lenght” – Pouvez-vous m’aider ? Merci infiniment

avatar
Register or

Likes

avatar avatar avatar avatar avatar avatar avatar avatar avatar avatar
Related users ' posts
kal Buenos días TACBOLSA. Estoy muy interesado en ver tu blog para ver la explicación con detall...
1Randy I would be interested an invite to your blog. I am still learning about the VSA and it looks...
repropel Buenos días TACBOLSA. Yo también estoy interesado en visitar tu blog. Podrías enviarme una i...
Stockastiss Can this code be simply transferred into Backtestingcode so one doesnt need to use call ? (i...
Vonasi Sorry for the late reply. Add the code to your strategy and remove line 5 and line 39. Chang...
viktorthunss Hi! How many averages are there? Can I see the somewhere?
FXmike hey my friends, thank you for this great code. my problem is he make no trade open. backtest...
FXmike Can i put a Action that my start contract is smaller than 1 ? 0.3 or 0.5 ? In wich Position...
phoentzs I wrote the code for M15 back then and also variants in H1 and M1. Everything works so far....
leofi https://www.prorealcode.com/topic/simple-average-with-visual-color/
leofi Go visit www.prorealcode.com/topic/simple-average-with-visual-color/ and watch 2em post
Dritan Hi,I am new on Prorealtime and coding.I downloaded the indi but I have it on a separate wind...
Maxime Baudin Very useful! Thanks Mat, and Happy New Year
nicko Great work. Thank you. However I am having trouble getting it to print in the first bar. If ...
Alps007 Hi Nicolas. Happy New Year. Can you please program me several MACD divergence screeners ...
Arlei Zanin Hello Nicolas, would it be possible to convert the Cloud to Pascal language? Thank you.
ashee i want it in MT4
Meta Signals Pro Pleasure ! Please let us know if you make good trades with it and if you see improvements we...
francis59 Bonjour, Bonjour, comment puis-je créer un screener basé sur cet indicateur, qui affiche le...
Trader Sab I am curious to try it how, however I get an error message for line 47 and 48 - drawsegment,...
Om Hello, thanks for sharing! Getting a message that Variable P is undefined?
matin Intraday Average Volume Indicator Not working, what can i do plz
Vonasi Sure that is possible. I will code it and make a post in the English ProBuilder forum and pu...
Vonasi Vama v2 with Hull moving average included can be found here: https://www.prorealcode.com/top...
JMat45 Thank you, Vonasi.
Nicolas
5 years ago
LRMA
LRMA
0
Indicators
manchokcity can we have it in mql4 platform? or how or which platform do we use it?
camporan I don't use MetaTrader so I won't be able to do the translation myself. Sorry!
Alexander9 This can for amibroker ? . Thanks
LucioleLucide Clean view, thanks for sharing
dertopen hi where i can found the window for candle configuration?
paolosab69 Ciao! . I have seen the pictures that explain this metod but i don't understand when is mome...
Alberto Aguilera Hi! Thanks for your strategy Anyone can check it with 200 bars?
TempusFugit Hi, this simple system for DOW and only shorts has worked quite well, maybe because of its q...
phoentzs Unfortunately, I never pursued this strategy further. Maybe I should take a look with what ...
Ciccio
5 years ago
Vinks_o_7 Apirine also offers a very interesting update of the OBV...
robertogozzi It surely CHANGES even when currently outside time range, as the lookback periods change as ...
SkippyTrader Thanks Roberto, but shouldnt the values in the outside time range not be different? As it sh...
robertogozzi Actually it is a constant (I tested them on a 1-hour TF, 9am to 5pm) and outside that time r...
TACBOLSA
5 years ago
dario ti please can you help me to understand? i know i am wrong: Long Histogram = High Volume S...
TAC Bolsa hi, I have already seen the problem and requested that it be removed until an adequate so...
sixeight Hey TAC, Did you ever find a solution to this?
Vinks_o_7 b=close > low and volume > high How can we compare volume and high of the day? (orang...
TAC Bolsa If to understand something you resort to compare Oranges and bananas. You go bad, Without e...
giumagi good morning Sir, great job your indicators! How can I reach your website or blog? please..t...

Top