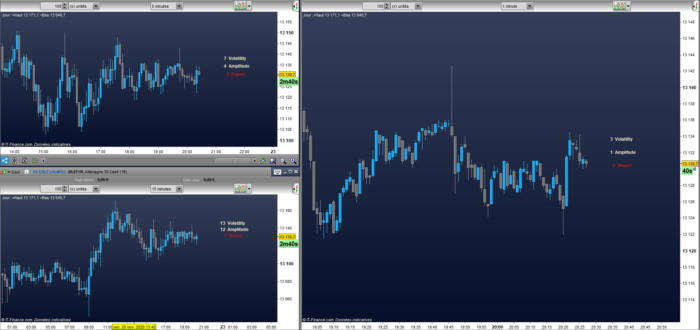
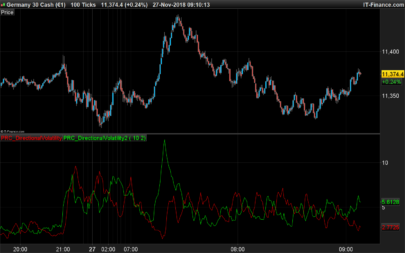
This indicator calculates the volatility and amplitude of the price.
Its use can be useful for three reasons
Knowing volatility
To know the amplitude of price movements
To know the relationship between the two
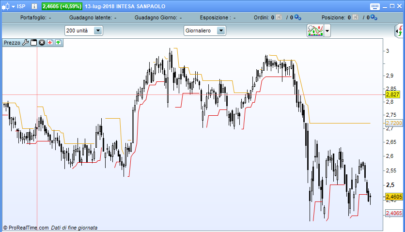
The most important function of this indicator is reporting.
The ratio is simply the difference between the amplitude and the volatility, if the amplitude, i.e. the average movements are smaller than the volatility, then the price is in a phase of stagnation.
This way, if you are trading multiple markets, taking the one that gives the best ratio will benefit your portfolio!
The second function that I say “useful” and not important is volatility, in fact knowing the volatility is very useful to position stop loss protection.
And finally the amplitude, which is nothing more than information.
So to put it simply, if the report is negative, not trading is the best idea!
If you are trading forex, you will need to check the external variable “Forex”.
IV
|
1 2 3 4 5 6 7 8 9 10 11 12 13 14 15 16 17 18 19 20 21 22 23 24 25 26 27 28 29 30 31 32 33 34 35 36 37 38 39 40 41 42 43 44 45 46 47 48 49 50 51 52 53 54 55 56 57 58 59 60 61 62 63 64 65 66 67 68 69 70 71 72 73 74 75 76 77 78 79 80 81 82 83 84 85 86 87 88 89 90 91 92 93 94 95 96 97 98 99 100 101 102 103 104 105 106 107 108 109 110 111 112 113 114 115 116 117 118 119 120 121 122 123 124 125 126 127 128 129 130 131 132 133 134 135 136 137 138 139 140 141 142 143 144 145 146 147 148 149 150 151 152 153 154 155 156 157 158 159 160 161 162 163 164 165 166 167 168 169 170 171 172 173 174 175 176 177 178 179 180 181 182 183 184 |
// //=/===============/=//=/===============/=//=/ Indicator Range Trend // defparam drawonlastbaronly = true // //=/===============/=//=/===============/=//=/ Range Fast // once FxRRange=close Fxscale = 2.338*average[14,1](abs(close-close[1])) FxR = average[27,1](FxScale) FxHH = close FxLL = close if FxHH > FxRRange[1] then if (FxHH-FxR) < FxRRange[1] then FxRRange = FxRRange[1] else FxRRange = (FxHH-FxR) endif elsif (FxLL+FxR) > FxRRange[1] then FxRRange = FxRRange[1] else FxRRange = (FxLL+FxR) endif FxTrend = FxRRange FxURange = FxRRange + FxR FxDRange = FxRRange - FxR // //=/===============/=//=/===============/=//=/ Range Low // once LxRRange=close LxR = 2.338*average[14,1](abs(close-close[1])) LxHH = high LxLL = low if LxHH > LxRRange[1] then if (LxHH-LxR) < LxRRange[1] then LxRRange = LxRRange[1] else LxRRange = (LxHH-LxR) endif elsif (LxLL+LxR) > LxRRange[1] then LxRRange = LxRRange[1] else LxRRange = (LxLL+LxR) endif LxTrend = LxRRange LxURange = LxRRange + LxR LxDRange = LxRRange - LxR // //=/===============/=//=/===============/=//=/ Trend Line // //=/ Trend Line TLr = (FxTrend+LxTrend)/2 AvTrD1 = (TLr+TLr[1])/2 AvTrD2 = (AvTrD1-TLr)/15 TrDL = AvTrD1-AvTrD2 //=/ Up Range XURange = (FxURange+LxURange)/2 //=/ Dw Range XDRange = ((FxDRange+LxDRange)/2) // //=/===============/=//=/===============/=//=/ Volatility & Amplitude Settings // //=/ Decompte Haussier UAmp = 0 if close > TrDL then UAmp = UAmp[1]+1 endif //=/ Decompte Baissier DAmp = 0 if close < TrDL then DAmp = DAmp[1]+1 endif //=/ Decompte Global Amp = UAmp+DAmp if Amp < Amp[1]-1 then Amp = Amp[Amp]-Amp endif VRange = 0 if TrDL = TrDL[1] then VRange = VRange[1]+1 endif //=/ Decompte Amplitude OAmp = (Amp-VRange)-VRange if OAmp < 0 then OAmp = 0 endif if OAmp < OAmp[1]-1 then OAmp = OAmp[1]-1 endif if OAmp > OAmp[1]+1 then OAmp = OAmp[1]+1 endif //=/ Decompte final if VRange > OAmp then OAmp = VRange endif P = round(OAmp) if forex then //=/ Volatility Volatilite = (((XURange*0.5)-(XDRange*0.5))*10000) XV = round(Volatilite) drawtext(" #XV# Volatility",barindex[1],TrDL[1]+(XURange[1]-TrDL[1]),Dialog,Bold,12) coloured(0,0,0) //=/ Amplitude if close > TrDL then Amplitude = (close-Lowest[P](low))*10000 elsif close < TrdL then Amplitude = (Highest[P](high)-close)*10000 endif XA = round(Amplitude) drawtext(" #XA# Amplitude",barindex[1],TrDL[1]+((XURange[1]-TrDL[1])/2),Dialog,Bold,12) coloured(0,0,0) //=/ Rapport RPP = (Amplitude-Volatilite) XR = round (RPP) if RPP > 0 then drawtext(" #XR# Report",barindex[1],TrDL[1],Dialog,Bold,12) coloured(0,0,0) elsif RPP =< 0 then drawtext(" #XR# Report",barindex[1],TrDL[1],Dialog,Bold,12) coloured(199,19,19) endif else //=/ Volatility Volatilite = ((XURange*0.5)-(XDRange*0.5)) XV = round(Volatilite) drawtext(" #XV# Volatility",barindex[1],TrDL[1]+(XURange[1]-TrDL[1]),Dialog,Bold,12) coloured(0,0,0) //=/ Amplitude if close > TrDL then Amplitude = close-Lowest[P](low) elsif close < TrdL then Amplitude = Highest[P](high)-close endif XA = round(Amplitude) drawtext(" #XA# Amplitude",barindex[1],TrDL[1]+((XURange[1]-TrDL[1])/2),Dialog,Bold,12) coloured(0,0,0) //=/ Rapport RPP = (Amplitude-Volatilite) XR = round (RPP) if RPP > 0 then drawtext(" #XR# Report",barindex[1],TrDL[1],Dialog,Bold,12) coloured(0,0,0) elsif RPP =< 0 then drawtext(" #XR# Report",barindex[1],TrDL[1],Dialog,Bold,12) coloured(199,19,19) endif endif return |
Share this
No information on this site is investment advice or a solicitation to buy or sell any financial instrument. Past performance is not indicative of future results. Trading may expose you to risk of loss greater than your deposits and is only suitable for experienced investors who have sufficient financial means to bear such risk.
ProRealTime ITF files and other attachments :
Find other exclusive trading pro-tools on ![]()
PRC is also on YouTube, subscribe to our channel for exclusive content and tutorials


Hi! I like this indicator a lot, been using it on a 30 min timeframe and usually confirms my thesis/process. Is there any way of moving the text on the chart closer to price?
Bonjour et merci pour cet indicateur ! je l’observe sur les actions du Nasdaq et la plupart du temps, il affiche 0 pour les 3 variables, est ce normal ? merci à toi.