Super bandpass filter – John Ehlers

Super bandpass filter – John Ehlers

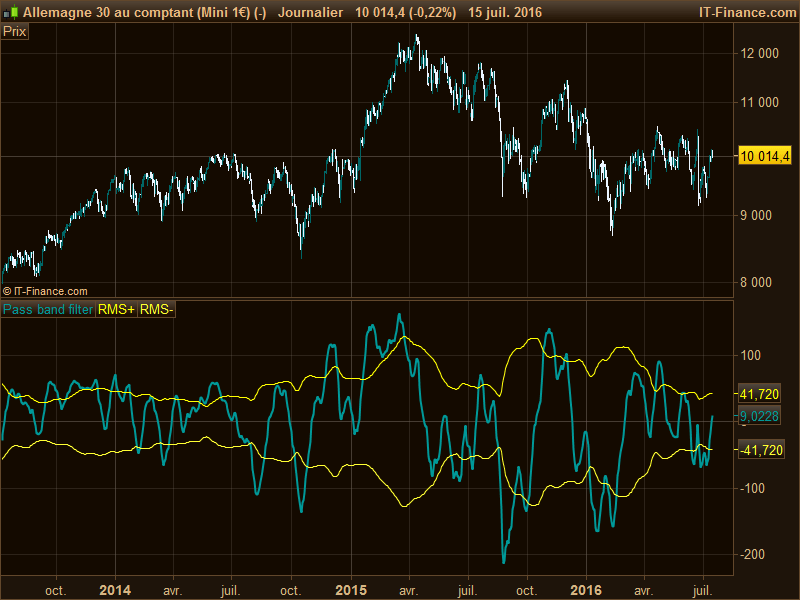
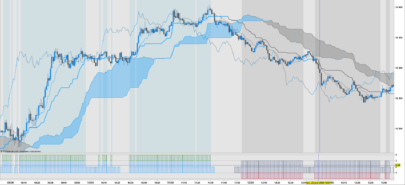
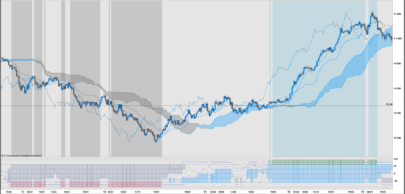
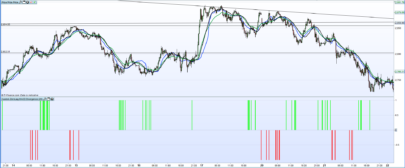
Here is the newest indicator by John Ehlers described in the new traders’tips of July 2016, like his other indicators this one is also a nearly-zero lag filter which is another attempt to filter out noises from high and low frequencies of market data.

John Ehlers describe the trading rules of this new indicator as this:

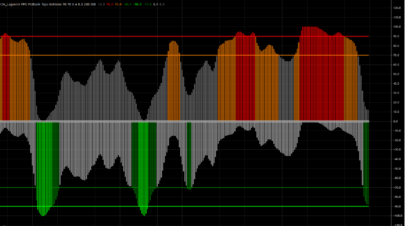
  • Buy on the filter crossing above its -RMS line
  • Short on the filter crossing below its RMS line
  • Exit long when the filter either crosses below its RMS or crosses below -RMS (which signifies a false entry signal)
  • Cover short when the filter either crosses above its -RMS or crosses above RMS (which signifies a false entry signal)


Share this

Risk disclosure:

No information on this site is investment advice or a solicitation to buy or sell any financial instrument. Past performance is not indicative of future results. Trading may expose you to risk of loss greater than your deposits and is only suitable for experienced investors who have sufficient financial means to bear such risk.

ProRealTime ITF files and other attachments : How to import ITF files into ProRealTime platform?

PRC is also on YouTube, subscribe to our channel for exclusive content and tutorials

  1. Hans63 • 07/17/2016 #

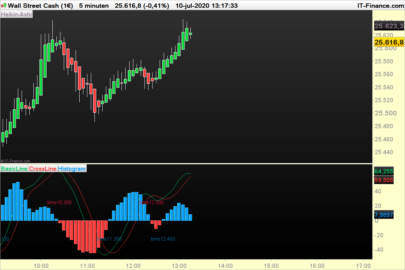
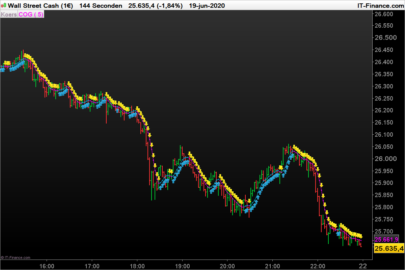
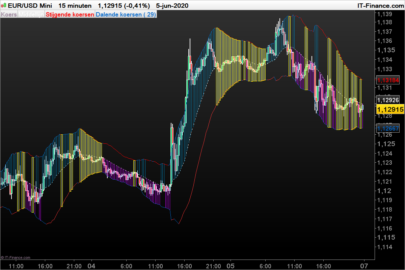
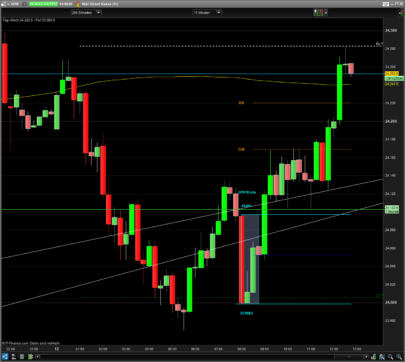
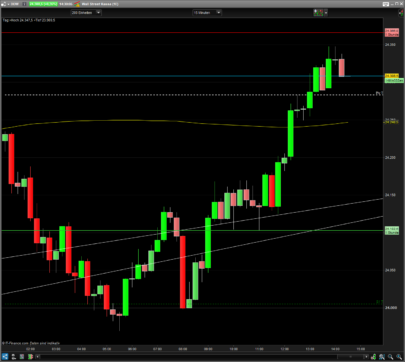
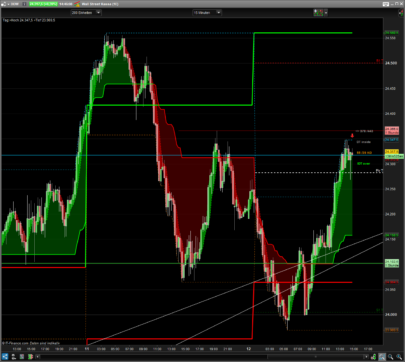
    For intraday purpose I tried to modify the parameters
    Rules are different. It works like a stop and reverse
    Long on the filter crossing above its RMS line. Stay Long until the filter is crossing below the lower line (band), then reverse the position from Long to Short
    Short on the filter crossing below its RMS line. Stay Short until the filter is crossing above the higher line (band), then reverse the position from Short to Long
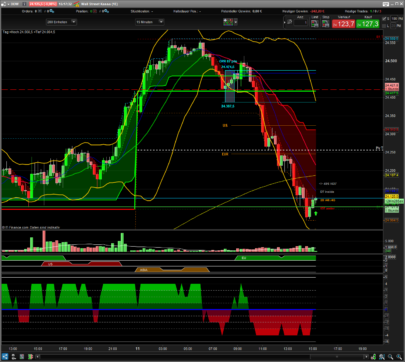
    It works well on Germany 30 5 min
     
    // parameters
    flen = 20//fast length
    slen = 30 //slow length

    if barindex>slen then
    a1= 5/flen
    a2= 5/slen
    PB = (a1 - a2) * close + (a2*(1 - a1) - a1 * (1 - a2))* close[1] + ((1 - a1) + (1 - a2))*(PB[1])- (1 - a1)* (1 - a2)*(PB[2])
    RMSa = summation[25](PB*PB)
    RMSplus = sqrt(RMSa/25)
    RMSminus = -RMSplus
    endif

    RETURN PB as \"Pass band filter\", RMSplus as \"RMS+\", RMSminus as \"RMS-\"


    • Nicolas • 07/17/2016 #

      Nice, thanks for sharing. How much profitability lookback do you have with this indicator modification? 

  2. Hans63 • 07/17/2016 #

    Well, I am a discretionary trader, so I don’t trade all the signals given by a system or by indicators
    All I can say is that this indicator give you good entry points.
     

    • Nicolas • 07/17/2016 #

      …and that’s clever, thanks again for your feed back and your sharing.

avatar
Register or

Likes

avatar avatar avatar avatar avatar avatar avatar avatar avatar avatar
Related users ' posts
Nicolas How to import file page: in the help section of the website explains howto
kenssa import through the indicator page/window in the Proreal time
chicoteca Buenas, no consigo que se me muestre en el chart de DAX. ¿Cómo procedo? Gracias.-
Vonasi Thanks for the compliments. No this is not easily possible in v10.3 because it uses arrays w...
bruces Hi and thank you. I successfully imported original version above and added to my Prorealtim...
Musiar Hi Vonasi, The indicator is working like a charm on PRT v12; trying to adapt it for a strat...
JohnScher I've been looking for this for a long time! A very big thank you to you.
Nupsator hi, looks very interesting, i imported the indicator and inserted it into a 1h chart. Unfort...
Ciccarelli Franco Lo trovo interessante, ma non riesco a scaricarlo. Chi mi può aiutare?
Bard Excellent job Vonasi, thanks very much for updating and improving your previous indicator.
Gianluca sorry but doesnt work like you posted
Vonasi You would need to let me know the exact instrument and time frame that you are trying to app...
ipbvba idem ne fonctionne pas sur V11 (meme avec real time data), import OK mais aucune courbe dans...
Ciccarelli Franco I'm new to the Market, I imported the code, but I don't see anything, there is an empty box ...
tradermikey Is the available for v12?
Nicolas remplacer les valeurs de coloured(0,255,0) par coloured(r,g,b) et ajouter ces noms de variab...
mohamed merci Nicolas!
sacram14 Merci Nicolas pour ce set-up que je ne connaissais pas ! J'ai tenté de reprendre le code pou...
Vinks_o_7 Thanks Doc !
Maxime Baudin Intresting, thank you!
Nicolas Pour créer des alertes, vous pouvez suivre ce petit tutoriel : https://www.prorealtime.com/f...
thibault76 Bonjour Nicolas, cette stratégie est intéressante. Par contre, en 2022, le code ne fonction...
Nicolas Aucun message d'erreur pour ma part en version 11.1. Tu es certain de créer un code d'indica...
1Randy I would be interested an invite to your blog. I am still learning about the VSA and it looks...
repropel Buenos días TACBOLSA. Yo también estoy interesado en visitar tu blog. Podrías enviarme una i...
mobychix Hi, I just joined Pro Realtime and am very interested in VSA. I have read some books and did...
Stockastiss Can this code be simply transferred into Backtestingcode so one doesnt need to use call ? (i...
Vonasi Sorry for the late reply. Add the code to your strategy and remove line 5 and line 39. Chang...
viktorthunss Hi! How many averages are there? Can I see the somewhere?
carpentier Joffrey Bonjour à tous, Avant tout merci pour ce travail, cependant je suis bloqué quand je l'insta...
carpentier Joffrey Re, C'est ok, j'ai trouvé mon erreur... Cependant sur quel base peut on calculer son CALC...
Aragorna Hi Nicolas, How is it possible to use it in a higher timeframe plotted on a lower timeframe?...
Zigo Normaly it do work in version 11.
bertrandpinoy Hello to all, please does a coder can bring the indication of the price level on the chart o...
Zigo @bertrandpinoy add between line 50 and 51 : drawtext("#dnh#",barindex,low-2.618*AverageTrue...
leofi https://www.prorealcode.com/topic/simple-average-with-visual-color/
leofi Go visit www.prorealcode.com/topic/simple-average-with-visual-color/ and watch 2em post
Dritan Hi,I am new on Prorealtime and coding.I downloaded the indi but I have it on a separate wind...
stephane2.0
5 years ago
stephane2.0 c=exponentialaverage[9](MACDLine[12,26,9](close))
Forexcheckup Hi I down loaded the ITF file, it paints red for a down trend but for all up trends the can...
stephane2.0 line 22: r = 195 by r = 0 line 23: g = 195 by g = 0 line 24: b = 195 by b = 255 ;)
Zigo
5 years ago
fifi743 Good morning, there is no mistake about the shorts c11=SMI[14,3,5](close)>-40
Zigo has to be c11=SMI[14,3,5] < -40 (indeed)
xar3 Thank you ;-) Zigo
Suzu Yuk Regarding line68, //-- with indicator "properties", add coloured fill between euroOFF and...
manual_ice As far as I know, it is not possible to include "fill" inside an indicator. But, since ve...
Morrissey38 Muchísimas gracias Nicolás , muy amable.
Bruno Carnazzi extrèmement pertinent
Bruno Carnazzi Is that beatable ?
Maxime Baudin Very useful! Thanks Mat, and Happy New Year
nicko Great work. Thank you. However I am having trouble getting it to print in the first bar. If ...
Nicolas
5 years ago
Rex Oscillator
Rex Oscillator
2
Indicators
Rollerbob thank you Nicolas !
Guibourse Thanks ! Would it be possible to translate it into a screener ?
Nicolas
5 years ago
KDJ
KDJ
3
Indicators
fireleg79 Bonsoir Nicolas. Merci pour tout ton travail. Quand tu auras le temps pourras-tu jeter un oe...
Sejibi Bonsoir, En remplaçant percentJ = 3 * percentD - 2 * percentK par percentJ = 3 * perc...
JMARTY Bonjour, A la recherche d'un indicateur détectant les divergences sur DMI, je tombe sur ce...

Top