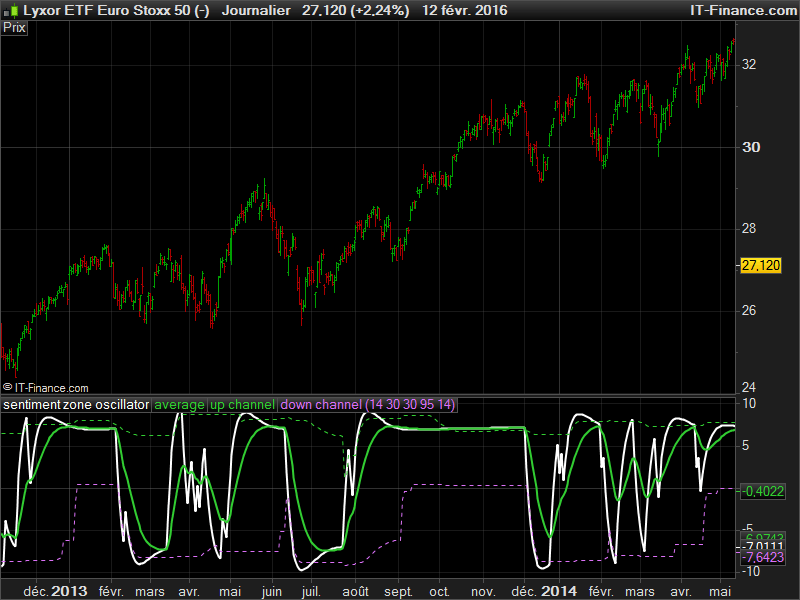
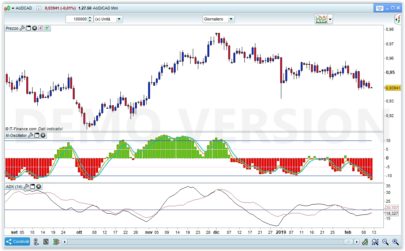
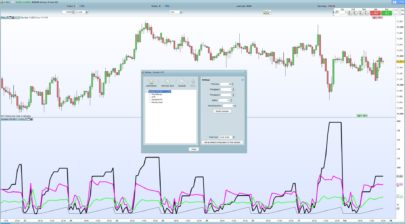
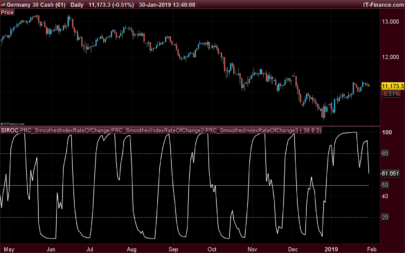
The Sentiment Zone Oscillator (SZO) was authored by Walid Khalil in the Stocks and Commodities Magazine, May 2012. The SZO uses a triple exponential moving average (TEMA) of a plus-minus value, triggered by the current and previous closing prices. Over-bought and over-sold paths and adjustable guides are also given.
This oscillator attempt to measure overall market sentiment and give overbought and oversold levels to play with. Bullish signal may occur when the oscillator is rising from the lower level and bearish one when the white line is quitting the higher level.
Overbought and oversold are dynamic, they take the higher and lower value that the oscillator had in the last “SZOLongPeriod”.
|
1 2 3 4 5 6 7 8 9 10 11 12 13 14 15 16 17 18 19 20 21 22 23 24 25 26 27 28 29 30 31 32 33 34 35 36 37 38 39 40 41 42 43 44 45 46 47 48 49 50 |
// parameters // SZOPeriod = 14 // SZOLongPeriod = 30 // PriceFiltering = 14 // SZOPercent = 95 // AveragePeriod = 14 if(barindex>SZOLongPeriod) then prices = average[PriceFiltering](close) if prices>prices[1] then useValues = 1 else useValues = -1 endif alpha = 2/(1+SZOPeriod) worktema1 = worktema1[1]+alpha*(UseValues-worktema1[1]) worktema2 = worktema2[1]+alpha*(worktema1-worktema2[1]) worktema3 = worktema3[1]+alpha*(worktema2-worktema3[1]) mytema = worktema3+3.0*(worktema1-worktema2) result = 100*mytema szo = result/SZOPeriod hi=0 lo=0 for i = 0 to SZOLongPeriod do if szo[i]>hi then hi = szo[i] endif if szo[i]<lo then lo = szo[i] endif next rn = hi-lo upz = lo+rn*SZOPercent/100 dnz = hi-rn*SZOPercent/100 avg = exponentialaverage[AveragePeriod](szo) endif RETURN szo coloured(255,255,255) as "sentiment zone oscillator", avg coloured(50,205,50) as "average", upz coloured(50,205,50) as "up channel", dnz coloured(219,112,247) as "down channel" |
Share this
No information on this site is investment advice or a solicitation to buy or sell any financial instrument. Past performance is not indicative of future results. Trading may expose you to risk of loss greater than your deposits and is only suitable for experienced investors who have sufficient financial means to bear such risk.
ProRealTime ITF files and other attachments :
Find other exclusive trading pro-tools on ![]()
PRC is also on YouTube, subscribe to our channel for exclusive content and tutorials


hello, i have tried your indicator and it looks good. It’s filtering a lot but it gave good results in the past i guess.
Thanks for commenting. Well, it is not “my” indicator, it is one I have adapted from other trading programming language. If you find it useful, you should post your suggestions about how to use it, here in the comments area or in the forums.
OK I will do it. Are there any possibilities to transform other indicators please?
Yes it is possible, as long as it is possible to have the same functionalities. You can post your request in the Programming Support forum section.