




More from ProRealCode
ProRealCode - Trading & Coding with ProRealTime™
The ProRealTime™ community on the web! Officially sharing ProRealTime knowledge to Worldwide users since 2015!



Hourly Seasonality Curve for the Week
March 30, 2020, 4:48 PM
Indicators
3 Comments
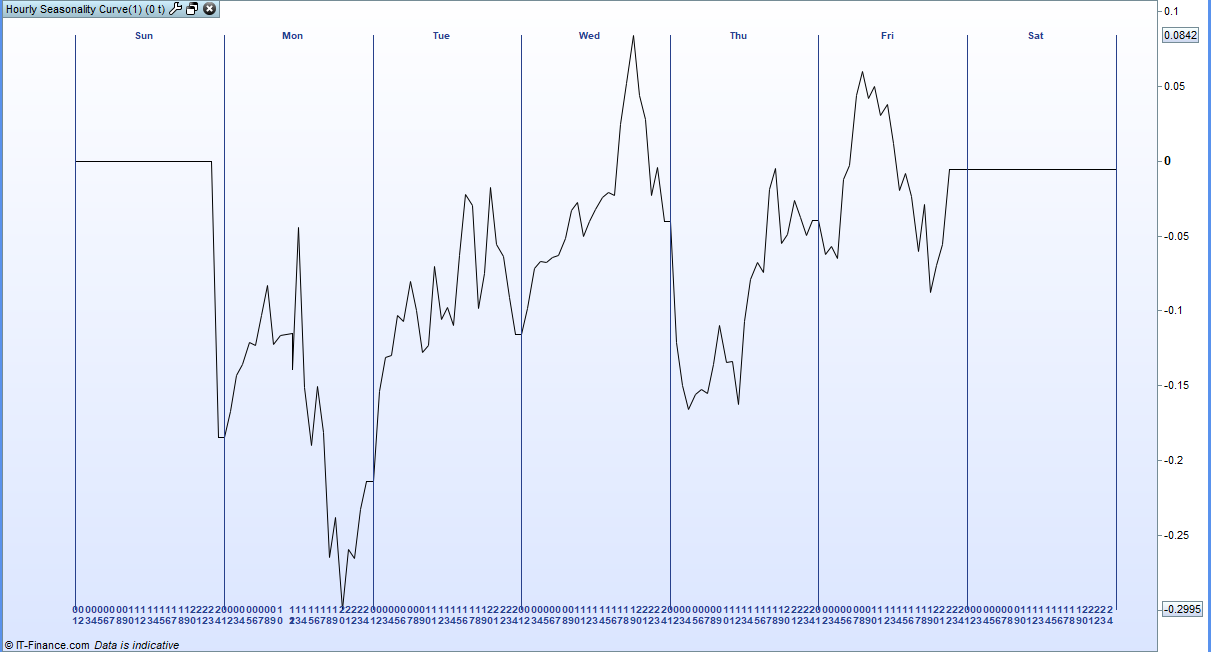
This indicator draws a seasonality curve for the week based on historical hourly price movements.
You can set a start date if you only want to analyse more recent data. Set to zero to analyse all available data.
The indicator can be used to identify times of day and times of the week when historically it has been better to go long or short.
Due to the lack of arrays in PRTv10.3 the indicator can be slow to draw if you are analysing a lot of data.
Apply the indicator only on the hourly chart.
I advise that you download and import the indicator to get full functionality.
Download
Filename:
Hourly-Seasonality-Curve-v2.itf
Downloads:
228
Master
V-oyaging ON A S-mall I-ncome
Author’s Profile
Similar code
Rolling Weekly Seasonality % and GainIndicators
Most Active Hours and MonthsIndicators
Seasonality CurveIndicators
Seasonality AnalysisIndicators
Seasonality Analysis GraphIndicators


Loading...
Lo trovo interessante, ma non riesco a scaricarlo. Chi mi può aiutare?