RSI Laguerre self adjusting gamma with Fractals Energy

v10.3
RSI Laguerre self adjusting gamma with Fractals Energy

The Laguerre RSI technical indicator is a trend indicator based on a Laguerre filter.

The Laguerre indicator plots the weighted price trend line in a different window in the price graph window.

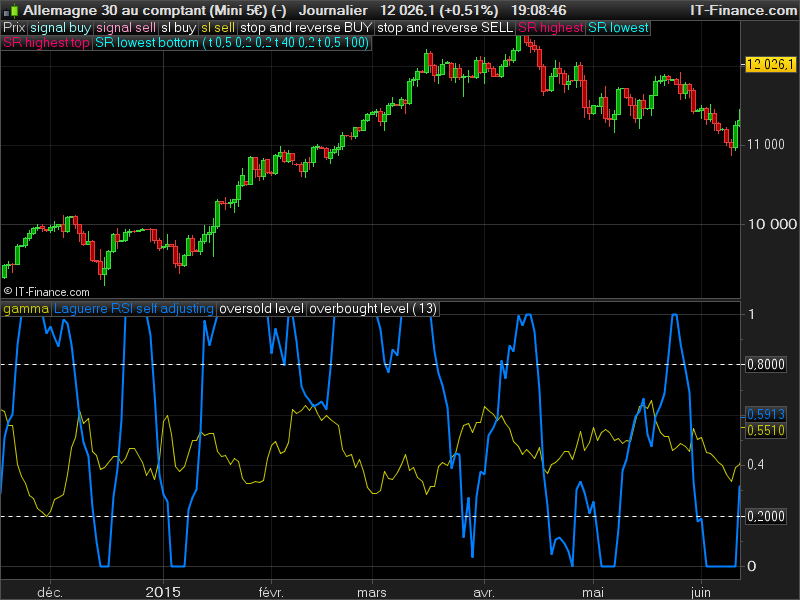
The Laguerre RSI indicator plots the weighted RSI indicator value filtered with a Laguerre filter. The gamma sensibility of the Laguerre filter is self adjusted with the “fractals energy” as the original author describes it.
This “energy” is the curve of yellow color, while the Laguerre RSI adjusted with this energy is the blue one.

Indicator translated from TOS code, requested on English forum.


Share this

Risk disclosure:

No information on this site is investment advice or a solicitation to buy or sell any financial instrument. Past performance is not indicative of future results. Trading may expose you to risk of loss greater than your deposits and is only suitable for experienced investors who have sufficient financial means to bear such risk.

ProRealTime ITF files and other attachments : How to import ITF files into ProRealTime platform?

PRC is also on YouTube, subscribe to our channel for exclusive content and tutorials

  1. Nicky9529 • 03/26/2017 #

    Merci Nicolas pour cet indicateur,
    Comme pour le RSI, J’aimerais pouvoir ajouter deux lignes max/min pour le gamma (basées sur l’historique des valeurs) afin de déterminer si l’on est en phase de trend exhaustion/range exhaustion. Comment faire?
    Nicolas
     

    • Nicolas • 03/26/2017 #

      C’est à dire ? Une détection des derniers plus haut et plus bas du gamma ? (la ligne jaune).

    • Nicky9529 • 03/26/2017 #

      Si l’indicateur n’est pas normé (ou atteint rarement les limites), il faudrait deux lignes de séparation qui détermineraient, sur les n derniers mois,  les 10 % des valeurs les plus élevés et plus basses afin de détecter automatiquement ensuite les configurations “le ressort va bientôt se détendre”/”le mouvement s’essouffle”. Une sorte de canal du gamma mais dont les limites horizontales dépendent de l’historique des valeurs.

    • Nicolas • 03/26/2017 #

      Pour cela, il suffit d’intercaler ces lignes de codes à la ligne 18 (sous le calcul de gamma):
      hh=highest[gammaP](gamma)*0.9
      ll=lowest[gammaP](gamma)*1.1
      et de remplacer la ligne 54 (RETURN) avec celle-ci :
      RETURN gamma coloured(200,200,0) as \"gamma\", lagRSI coloured(0,128,255) style(line,2) as \"Laguerre RSI self adjusting\", 0.2 style(dottedline,1) as \"oversold level\", 0.8 style(dottedline,1) as \"overbought level\", hh, ll
      J’ai introduit la variable “gammaP” qui permet de modifier à convenance le retour en arrière pour déterminer les résidus de la distribution du gamma entre les bornes hautes et basses de ce calcul. Il faudra donc bien entendu ajouter cette variable en externe pour la faire varier à convenance. Bon amusement 🙂
       

    • Nicky9529 • 03/26/2017 #

      Mais j’y compte bien! Merci beaucoup Nicolas pour la solution.

  2. triss1965@gmail.com • 03/26/2017 #

    Hi Nicolas, why cant the codes copy and past in to prorealttime. I want to try, but I have no time to write the updates that done by others. I think that would be positive for everyone.
     
    Regars
    Eva

    • Nicolas • 03/26/2017 #

      Sorry I don’t understand? You can easily import any file of the library by downloading itf files and click import in prorealtime indicators list. 

  3. Fabio Anthony Terrenzio • 03/26/2017 #

    How can I trade with this “Yellow Energy”?

  4. owes29 • 03/26/2017 #

    Do a Youtube search for “Revolutionary Indicators Reveal Tops & Bottoms” it explains a very similar indicator, I’m not sure if I am allowed to post videos to the forum

  5. owes29 • 03/26/2017 #

    Hi
    is there anyway to develop this for the pro scanner on daily or hourly scans. so it would create an alert just before the signals are met.
    kind regards
    Lee

    • Nicolas • 03/26/2017 #

      Of course, please add a query in the proscreener forum.

  6. Bruno Carnazzi • 03/26/2017 #

    C’est dommage, cette histoire d’énergie fractale bousille complètement la précision de l’indicateur original :

    if barindex > 0 then
    L0 = (1 – gamma) * close + gamma * L0[1]
    L1 = -gamma * L0 + L0[1] + gamma * L1[1]
    L2 = -gamma * L1 + L1[1] + gamma * L2[1]
    L3 = -gamma * L2 + L2[1] + gamma * L3[1]

    if L0 >= L1 then
    CU1 = L0 – L1
    CD1 = 0
    else
    CD1 = L1 – L0
    CU1 = 0
    endif

    if L1 >= L2 then
    CU2 = CU1 + L1 – L2
    CD2 = CD1
    else
    CD2 = CD1 + L2 – L1
    CU2 = CU1
    endif

    if L2 >= L3 then
    CU = CU2 + L2 – L3
    CD = CD2
    else
    CU = CU2
    CD = CD2 + L3 – L2
    endif

    if CU + CD 0 then
    lagRSI = CU / (CU + CD)
    else
    lagRSI = 0
    endif
    endif

    RETURN lagRSI as “LR”

avatar
Register or

Likes

avatar avatar avatar avatar avatar avatar avatar avatar avatar avatar
Related users ' posts
Nicolas Please open a topic in ProScreener forum with your query, I'll reply you there. Thank you.
manafull Thanks Nicolas, I post my question, along with the codes I am trying to convert from your in...
Nicolas I replied to your post here: https://www.prorealcode.com/topic/screener-for-rsi-and-linear-r...
Madrosat I Have not see a fully functioning automated strategy on your site?? Really have you???
juanj Hi Madrosat, why would it be on my site? I have developed it for my personal use and also to...
Madrosat ok I understood you are using prorealcode to hack the fish
imonix Have been trying this on demo since Monday before deciding whether to go live with it. Using...
Roberto Blázquez I'm sorry, I've tried it since November 2012 and it's bad results.
Nicolas Oui le code est correct et il fonctionne, j'ai de bons résultats sur la liste NASDAQ par exe...
pincherman Bonjour :-) J'ai coller le script dans prorealtime pour jouer avec le supertrend et j'ai un...
Nicolas Vous l'avez sans doute collé au mauvais endroit, dans l'éditeur de code pour les stratégies,...
woktrade Superbe !
Vonasi An updated version with a bug fix can be found here: https://www.prorealcode.com/topic/dis...
snucke hey Vonasi is it possible you can help me get this indicator to show how much a market mo...
Vonasi There are actually two ways to calculate standard deviations and I seem to have used the ver...
Rory Dryden Thank you. Experimenting with it now.
Wolf Hi Vonasi. Thank for this indicator. I like this calculate concept. I think that line 16 thi...
Vonasi Well spotted! It is just a safety check to ensure that no value below 1 can be used otherwis...
Vinks_o_7 Vonasi you're a beast !!! ;-)))
pableitor Amazing indicator , you are pushing PRT to the limit! But looking at the scatter its not c...
Reddington Hi Vonasi! Really nice work, is it possible to re-create this to work in 10.3? Best regards ...
Vonasi Thanks for the compliments. No this is not easily possible in v10.3 because it uses arrays w...
bruces Hi and thank you. I successfully imported original version above and added to my Prorealtim...
Zigo
4 years ago
fifi743 Good morning, there is no mistake about the shorts c11=SMI[14,3,5](close)>-40
Zigo has to be c11=SMI[14,3,5] < -40 (indeed)
xar3 Thank you ;-) Zigo
Sapo Thank you very much. as always your indicators are extremely effective. kind regards Vonasi.
mitsu21 Hi, it looks nice. I'll try it tomorrow thank you for your share kind regards bruno
kj1988 Thank you Vonasi for sharing this indicator. Very useful as a comfirmation to the price act...
Bard Very interesting approach Vonasi! I'm getting a 404 error when trying to download though?
Vonasi I just tested and I was able to download with no error.
Psari Hi Vonasi, I am a newbie and was wondering whether you could possibly help me with this pro...
ggolfet Thanks Nicolas, I imported the itf file and solved the problem.
Hasardeur Hallo Nicolas, i tried to code the multi period heat map in combination with the Ehler’s ...
Nicolas Please open a new topic with the code in forum.
Marie-Eve Vergoz lorsque je copie les codes, le système me signale des erreurs à la ligne 12 et suivantes
Marie-Eve Vergoz sorry - tout est ok -
AlgoAlex
5 years ago
Marcot18 Alex ti sei superato
AlexF Esagerato!
jobswaps Sube como trazar lineas de tendencias a tantas barras
Frankiesc interesting indicator !! Thanks for sharing!!!
robertogozzi Thank you :)
JJ Tec Hola Las condiciones de entrada / salida vienen en el libro de J. Carter Mastering the trad...
Pixeldd Ich bekomme beim einfügen des Indikators einen Fehler angezeigt. Was bitte muss ich genau än...
HarryPro Hello, Firtly there appears to be a typo on line 6 "lenghkc=20" should this be "lengthkc=...
sir_i Bonjour à tous, Je suis nouveau sur le forum et sur la plateforme, pourriez-vous me dire com...
Nicolas Il faut simplement l'appliquer sur le prix.
sir_i Merci pour la réponse, je ne suis pas familier avec l'application de cette procédure simple,...

Top