1. Introduction
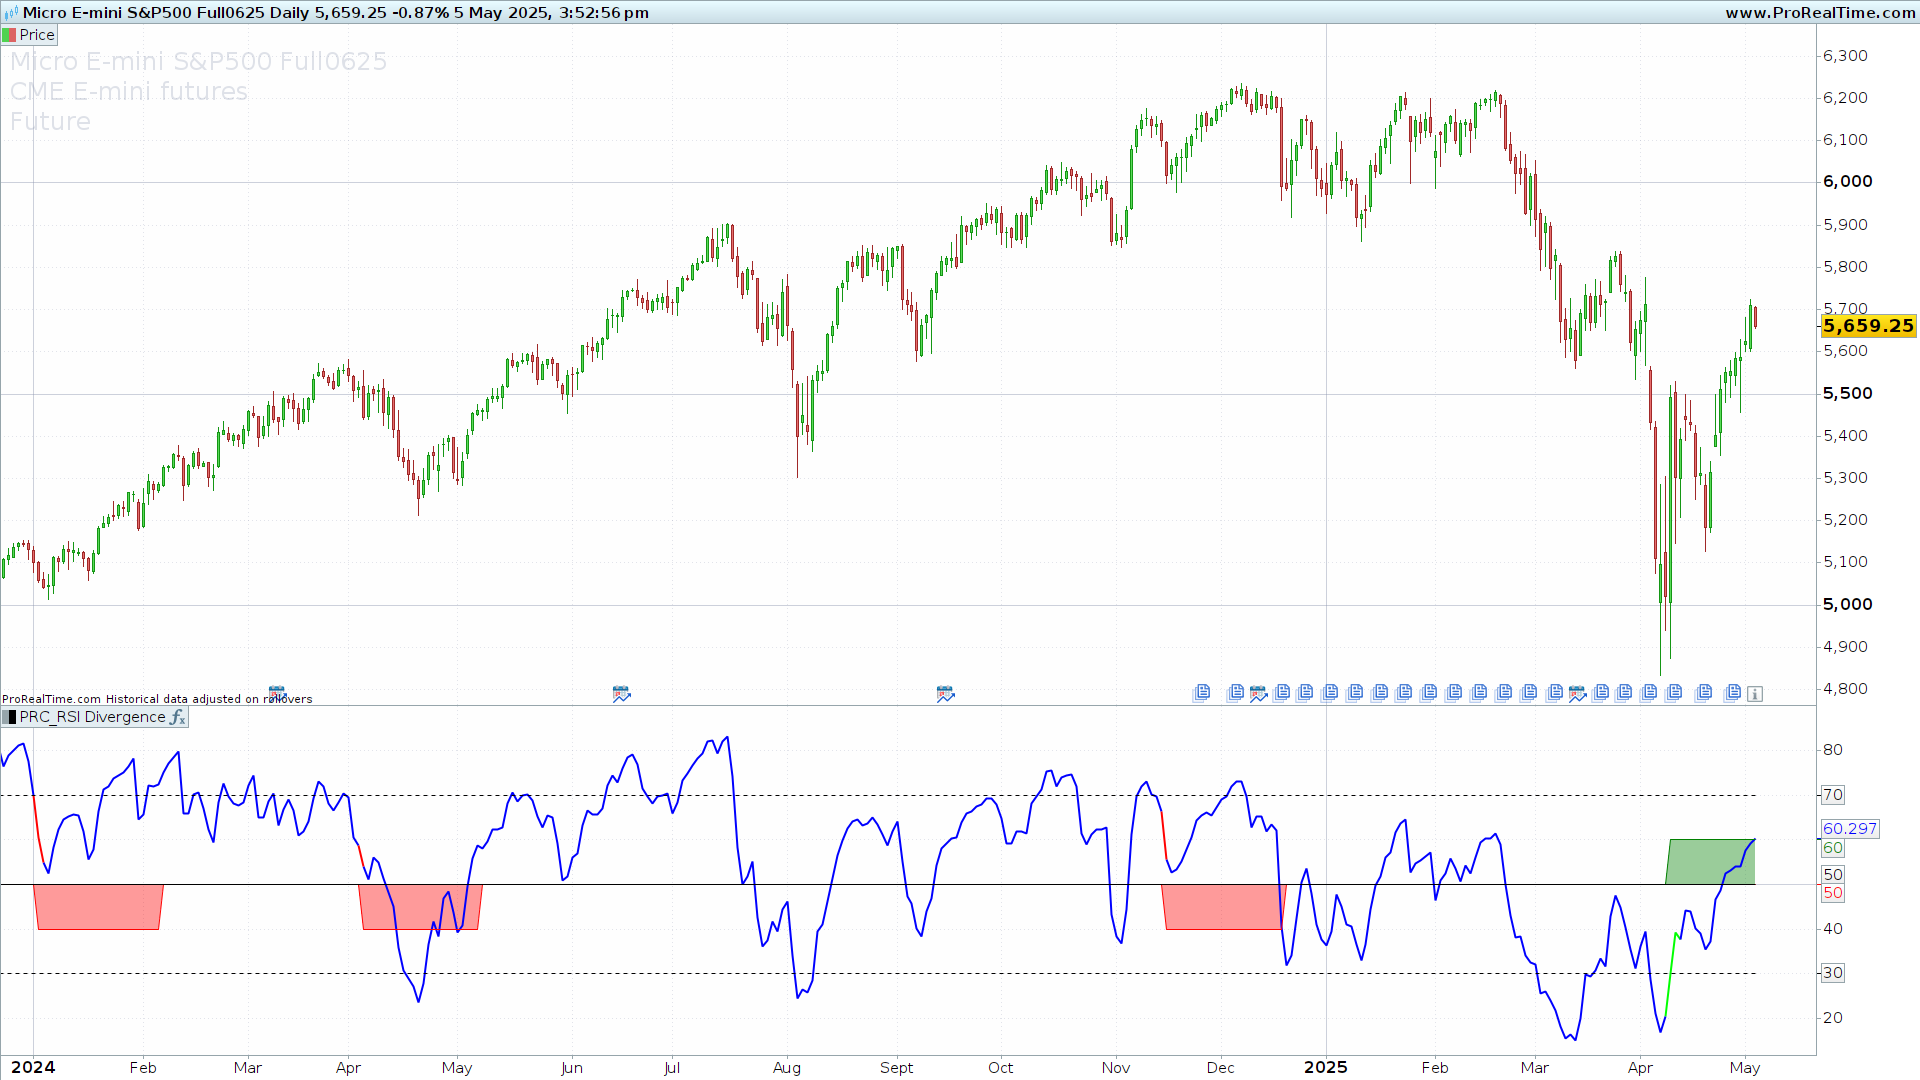
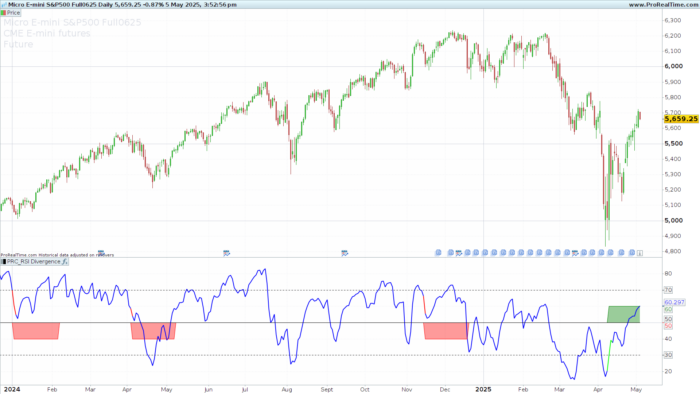
The RSI Divergence Detector is a technical indicator that automatically identifies divergences between price and the Relative Strength Index (RSI). Divergences are valuable signals in technical analysis, as they can anticipate potential trend reversals before they occur.
This indicator is especially useful for both trend-following traders and those looking to detect market turning points. Thanks to its visual implementation with color bands and dynamic alerts, it becomes an ideal tool for strategies involving RSI behavior.
2. Indicator Foundation
Divergences between price and an oscillator like RSI are early warning signs of a possible change in trend direction.
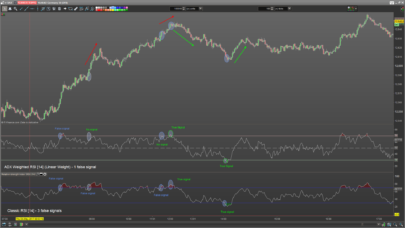
Bullish Divergence
Occurs when price prints a lower low, but the RSI shows a higher low. This suggests that despite the price drop, bearish momentum is weakening and an upward reversal could be near.
Bearish Divergence
Occurs when price makes a higher high, while the RSI shows a lower high. This indicates that although price is rising, bullish strength is fading, hinting at a possible retracement or correction.
The indicator automates the detection of these patterns on the chart, eliminating the need for manual comparison and enabling a more systematic, objective signal detection.
3. Code Logic
The code is divided into two main blocks: detection of bullish and bearish divergences, both based on comparing the average price and the RSI.
RSI and Average Price Calculation
RSI is calculated using the average price (open + high + low + close) / 4, which smooths volatility and reduces noise. The RSI period is adjustable (default: 14).
|
1 2 3 |
src=(open+high+low+close)/4 rv=rsi[rsiprd](src) |
Bullish Divergence Detection
It looks for a recent lower low in price, and simultaneously a higher low in RSI. Key conditions include:
srcLL: current price is above its recent lowest point, and that low is lower than an older one.rsiHL: current RSI is higher than its recent low, that low is above an older low, and it’s under the oversold level (30).
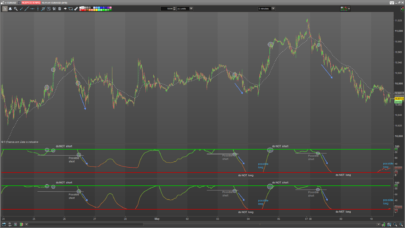
When both conditions are met, a green area is drawn under the RSI graph.
Bearish Divergence Detection
The inverse logic applies:
srcHH: current price is below its recent highest point, and that high is above an older one.rsiLH: current RSI is lower than its recent high, that high is below an older high, and above the overbought level (70).
A red band is drawn above the RSI to signal potential downward reversal.
Alert System
Both divergence signals use counters to measure the number of bars since the last signal.
The ialert parameter defines the minimum how many bars a divergence remains visually highlighted. if a divergence occurred less than ialert bars ago, a colored band (green or red) is drawn on the RSI. Otherwise, the band is not displayed.
In addition, the RSI line changes color dynamically:
- Green when there’s a bullish divergence.
- Red when there’s a bearish divergence.
- Blue in all other cases.
4. Indicator Settings
The indicator includes customizable parameters that allow it to be adapted to different trading styles and timeframes:
| Parameter | Description | Default Value |
|---|---|---|
rsiprd |
RSI calculation period | 14 |
ob |
Overbought threshold | 70 |
os |
Oversold threshold | 30 |
x |
Short-range lookback for local highs/lows | 5 |
z |
Long-range lookback for divergence validation | 25 |
revpct |
Required price reversal percentage to confirm a low/high | 0.01 (1%) |
ialert |
Maximum bars to dsiplay alerts | 25 |
Adjustment Recommendations
- For lower timeframes (1–15 min), reduce
xandzfor faster signals. - For higher timeframes (4h, daily), increase
x,z, andialertto filter stronger signals. - Adjust
revpctfor sensitivity tuning: higher values reduce noise, but may miss early entries.
5. Practical Use
The RSI Divergence Detector is versatile and works across multiple timeframes. Its effectiveness improves when used in trending contexts or around key support/resistance zones.
Recommended Timeframes
- Intraday (5min–1h): Suitable for scalping or short-term strategies. Use lower
xandz. - Swing trading (4h–Daily): Better for identifying significant reversals. Default or higher values work well.
Indicator Combinations
This divergence detector can be used alongside:
- Moving averages: For trend confirmation.
- Support/resistance levels: Divergence near these areas carries more weight.
- Volume indicators: Validate divergence strength, especially on longer timeframes.
Limitations
While divergences are powerful, they should not be used in isolation. It is recommended to wait for price action confirmation or additional signals before trading.
6. Indicator Code
The final section contains the full ProRealTime code (ProBuilder language) for implementing the RSI Divergence Detector.
|
1 2 3 4 5 6 7 8 9 10 11 12 13 14 15 16 17 18 19 20 21 22 23 24 25 26 27 28 29 30 31 32 33 34 35 36 37 38 39 40 41 42 43 44 45 46 47 48 49 50 51 52 53 54 55 56 57 58 59 60 61 62 63 64 65 66 67 68 69 70 71 72 73 74 75 76 77 78 79 80 81 82 83 84 85 86 87 88 89 |
//-----------------------------------------------// //PRC_RSI Divergence //version = 0 //05.05.2025 //Iván González @ www.prorealcode.com //Sharing ProRealTime knowledge //-----------------------------------------------// // inputs //-----------------------------------------------// src=(open+high+low+close)/4 x=5 z=25 revpct=0.01 ialert=25 rsiprd=14 ob=70 os=30 //-----------------------------------------------// // RSI calculation //-----------------------------------------------// rv=rsi[rsiprd](src) //-----------------------------------------------// // Bullish Divergence //-----------------------------------------------// //--- Define lower low in price llvx=lowest[x](src) llvz=lowest[z](src) srcLL=src>llvx*(1+revpct) and llvx<llvz[x] //--- Define higher low in RSI llvrsix=lowest[x](rv) llvrsiz=lowest[z](rv) rsiHL=rv>llvrsix and llvrsix>llvrsiz[x] and llvrsix<os bullishDiv=srcLL and rsiHL if bullishDiv then count=1 else count=1+count endif if count<ialert then bullishDivAlert=10+50 else bullishDivAlert=50 endif colorbetween(bullishDivAlert,50,"green",100) //-----------------------------------------------// // Bearish Divergence //-----------------------------------------------// //--- define higher high in price hhvx=highest[x](src) hhvz=highest[z](src) srcHH=src<hhvx*(1-revpct) and hhvx>hhvz[x] //--- define lower high in rsi hhvrsix=highest[x](rv) hhvrsiz=highest[z](rv) rsiLH=rv<hhvrsix and hhvrsix<hhvrsiz[x] and hhvrsix>ob bearishDiv=srcHH and rsiLH if bearishDiv then countbear=1 else countbear=1+countbear endif if countbear<ialert then bearishDivAlert=50-10 else bearishDivAlert=50 endif colorbetween(bearishDivAlert,50,"red",100) //-----------------------------------------------// if bullishdiv then red=0 green=255 blue=0 elsif bearishdiv then red=255 green=0 blue=0 else red=0 green=0 blue=255 endif //-----------------------------------------------// return rv as "RSI" coloured(red,green,blue)style(line,2), bullishDivAlert coloured("green"), bearishDivAlert coloured("red"), ob style(dottedline), os style(dottedline), 50 as "midline" |
Share this
No information on this site is investment advice or a solicitation to buy or sell any financial instrument. Past performance is not indicative of future results. Trading may expose you to risk of loss greater than your deposits and is only suitable for experienced investors who have sufficient financial means to bear such risk.
ProRealTime ITF files and other attachments :
Find other exclusive trading pro-tools on ![]()
PRC is also on YouTube, subscribe to our channel for exclusive content and tutorials