Range Coefficient

v10.3
Range Coefficient

Version:
1.0, (April 2017)
Author:
Maz @ prorealcode.com

Description:
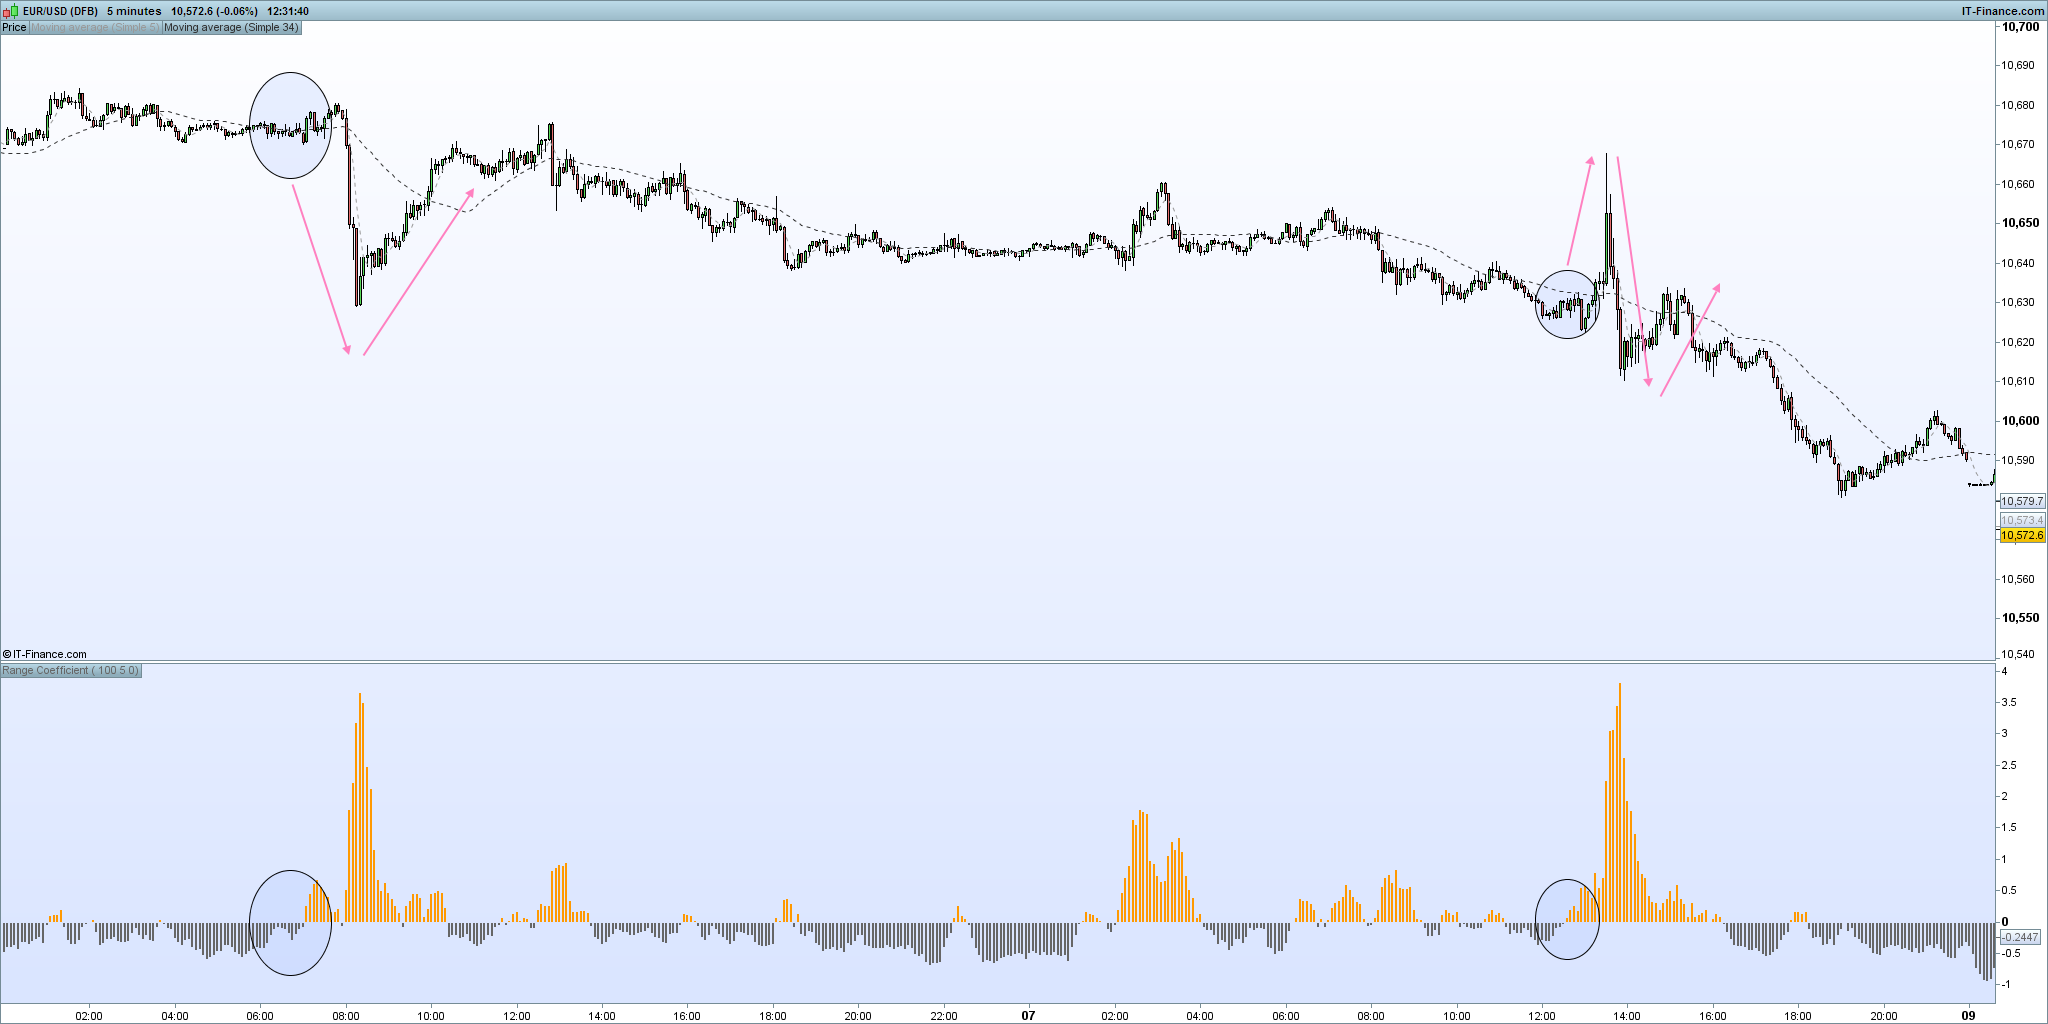
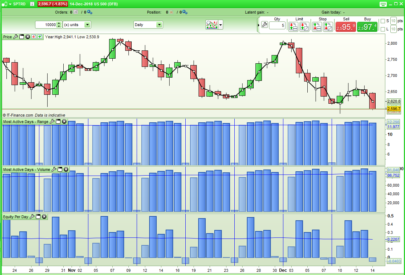
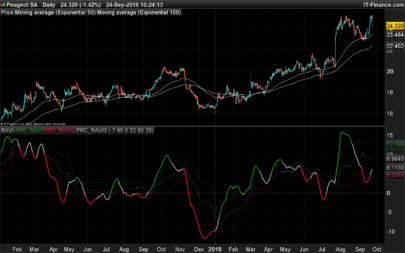
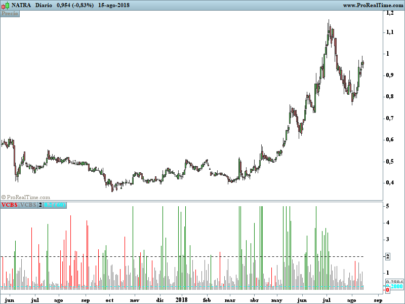
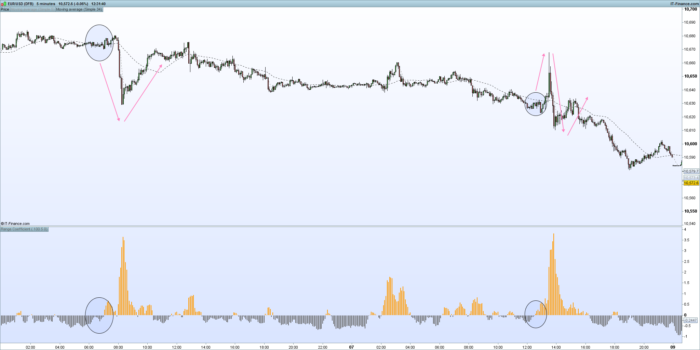
Histogram showing coefficient of recent range (or recent average range) against longer term average range.

This indicator can be used to predict volatility 

Interpretation:
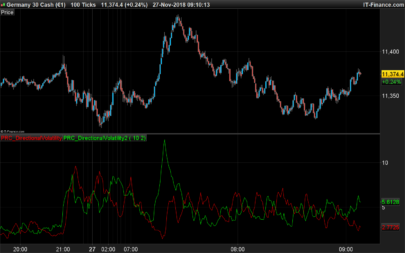
Values at or below zero show the recent candle range is less than or equal to the average candle range;
Values above zero show the recent candle range is increasing against the average candle range;
An upward trending range coefficient crossing above the zero line suggests that volatility is consistently increasing and that higher volatility is to follow;
A downward trending range coefficient below the zero line suggests that the volatility is decreasing.

In addition, look for the difference in market moves between high range coefficient and low range coefficient

— code —


Share this

Risk disclosure:

No information on this site is investment advice or a solicitation to buy or sell any financial instrument. Past performance is not indicative of future results. Trading may expose you to risk of loss greater than your deposits and is only suitable for experienced investors who have sufficient financial means to bear such risk.

ProRealTime ITF files and other attachments : How to import ITF files into ProRealTime platform?

PRC is also on YouTube, subscribe to our channel for exclusive content and tutorials

avatar
Register or

Likes

avatar avatar avatar avatar avatar avatar avatar avatar avatar avatar avatar avatar avatar avatar avatar avatar

+2 more likes

Related users ' posts
Brisvegas Thats Awesome thank you
Vinks_o_7 Thanks Vonasi !
ALE Very Very Nice
manel Hi - Many thanks for this and your other analytical codes, stellar work - very useful ! With...
Vonasi Good idea Manel. I have posted a new version here that shows results as a percentage: https:...
Bard Problems with Safari latest s/ware and this site and links and adding code. Let me add the...
grimweasel47 Ok thanks Nicolas - could this be adapted to take into account MFI and then have price, volu...
Nicolas I don't understand what you mean exactly, would be better to open a topic about this idea wi...
jissey Bonjour Bolsatrilera,j'essaie de vous contacter pour le cm rsi ;je le trouve interessant, m...
jissey J'essaie de vous contacter pour l'indicateur"cm rsi"....
DanT01 Hi Nicolas, great work! Is it possible to contact you to help with a couple of indicators? T...
Nicolas Assistance is free on forums. For private job, you can contact me with the trading programmi...
avatar
Anonymous Thank you! I was reading the book Beyond Technical Analysis and wanted to try to coding RAV...
Juan Salas Hi FULVIO09, Nice piece of work. It seems to work very well. Does only work for INDEXES??...
Johann Hi @FULVI09, I understand the instructions however I'm not too sure how to determine the "p...
Player8520 Hello, It doesn't work with me either. However, I changed AA to 180 on line 15, added th...
joobeng Sorry, I solved the problem. I have add the CBL indicator using the spanner icon on the pric...
Nicolas Adjust the price settings for the Y Axis to use the price only.
XXXXVII Hello Your indicator is interesting. However, I can't see the orange line. Do you have ...
ullle73 nicolas, can you somehome make this to be in the background of the price chart?
jonpt88 none did that yet right?
Nicolas You can ask for a code modification on forums, please open a new topic with your request.
jebus89 Big thanks for sharing this :) Seems to work as expected, good stuff.
Nicolas
6 years ago
Trinity Impulse
Trinity Impulse
5
Indicators
ribou ah d'accord merci beaucoup
domenico nlevel1 non modifica la curva al variare del suo valore
tiger_man_no1 Very nice ; what is the best period input date for DAILY CHART ?
flodefacebook Merci Nicolas pour cet indicateur. Très utile dans une technique de retournement.
HeikinAshi thank you for this very interesting indicator Nicolas! did you define a tradable setup fo...
christophe11560 salut gabri, Je n'ai pas de commentaire sur "s*s", c'est ton choix personnel. Je me posais...
gabri Hi, the SQRT(254) it is used to annualize the value. In terms of the "s*s" I just used the s...
christophe11560 Merci pour ton retour
guillermus69 is this " a= log(close/close[1])" better than a = ((close/close[1]) -1) *100 . I ...
gildaslm Hi gabri, thanks very much for your work, it helps me a lot. Have you ever tried to make the...
gandolfi thanks for your screener. Do you have the code for original Sharp ratio in order to compare ...
Abz Thanks gabri
Mattzi In your opinion is less than 20 stocks a bad idea? Thank you.
gabri No, you can pick as many or as little as you want. The portfolio composition depends on many...

Top