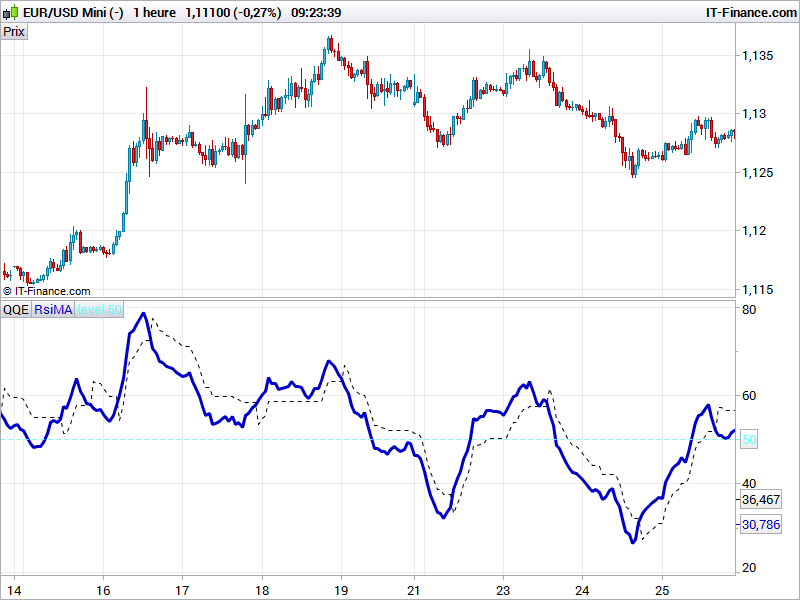
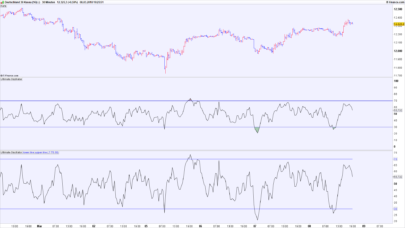
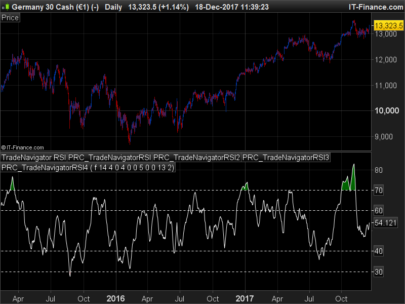
QQE ProRealTime indicator — or Quantitative Qualitative Estimation, is based on a rather complex calculation of the smoothed RSI indicators.
The QQE indicator consists of a smoothed Relative Strength Index (RSI) indicator and two volatility-based trailing levels (fast and slow). The Fast Trailing Level (TL) and Slow TL are constructed by calculating the ATR of the smoothed RSI over n-periods and then further smoothing the ATR using an additional n-periods Wilders smoothing function. This smoothed ATR of RSI is then multiplied by the Fast and Slow ATR Multipliers to calculate the final Fast and Slow Trailing Levels.
|
1 2 3 4 5 6 7 8 9 10 11 12 13 14 15 16 17 18 19 20 21 22 23 24 25 26 27 28 29 30 31 32 33 34 35 36 37 38 39 40 41 42 43 |
//PRC_QQE | indicator //11.10.2016 //Nicolas @ www.prorealcode.com //Sharing ProRealTime knowledge //--- parameters RSIPeriod = 14 SF = 5 QQE=4.236 //--- WildersPeriod = RSIPeriod * 2 - 1 if barindex>WildersPeriod then MyRsi = rsi[RSIPeriod](close) RsiMa = exponentialaverage[SF](MyRsi) AtrRsi = abs(RsiMa[1] - RsiMa) MaAtrRsi = exponentialaverage[WildersPeriod](AtrRsi) dar = exponentialaverage[WildersPeriod](MaAtrRsi) * QQE trr=TrLevelSlow[1] dv = trr if RsiMA[0]<trr then trr = RsiMA[0] + dar if(RsiMA[1]<dv) then if(trr>dv) then trr=dv endif endif elsif RsiMA[0]>trr then trr = RsiMA[0] - dar if(RsiMA[1]>dv) then if(trr<dv) then trr=dv endif endif endif TrLevelSlow=trr endif RETURN trr coloured(0,0,0) as "QQE" , RsiMA coloured(0,0,200) as "RsiMA", 50 as "level 50" |
Share this
No information on this site is investment advice or a solicitation to buy or sell any financial instrument. Past performance is not indicative of future results. Trading may expose you to risk of loss greater than your deposits and is only suitable for experienced investors who have sufficient financial means to bear such risk.
ProRealTime ITF files and other attachments :
Find other exclusive trading pro-tools on ![]()
PRC is also on YouTube, subscribe to our channel for exclusive content and tutorials


Bonjour Nicolas
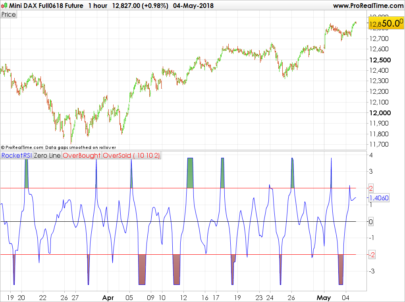
slow ATR = 4.236
fast ATR = 2.618
C’est volontaire de ne pas faire apparaitre la ligne fast ATR je suppose ?
Je n’ai pas écrit la description moi même je te l’avoue. J’ai “simplement” convertit un indicateur MT4 dans lequel le fast ATR n’apparaît pas. J’ai souvent vu les QQE avec une seule ligne de signal, mais en effet elle pourrait être ajouté.
Good evening NICOLAS,QQE with the smoothed RSIis a good indicator to build a Automated Trading Strategy .
Only for Intraday, can be useful to changethe code with the departure of the signal from the first candle of the market day,
with zero time lag.thanks for your job !
Bonjour Nicolas, sur 10.2, impossible de changer les couleurs. Je vais dans les paramètres … je mets par exemple la couleur rouge … elle se valide mais ne se change pas dans l’indicateur. Bug ? Merci pour ta réponse 🙂
Non ça n’est pas un bug. Les couleurs sont déclarés en dur dans le code à la ligne 43, donc tu ne pourras pas les changer à la main dans la fenêtre de paramètre de l’indicateur. Tu peux supprimer les instructions “coloured” dans cette ligne et tu pourras alors les changer à volonté toi même.
AU top ! Merci pour la réponse rapide 🙂
Hi,
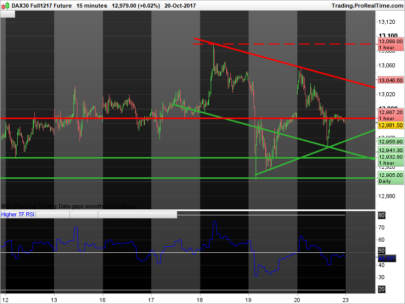
I was wondering if this QQE indicator could be used on a 1 min or 15 min timeframe. With the settings shown above (for the RSI period, SF and QQE), the indicator clearly does not match the evolution of the candlesticks.
Has anyone calculated these variables for 1 min or 15 min TF ? How can this be done ?
Thank you very much for advice.
Glen
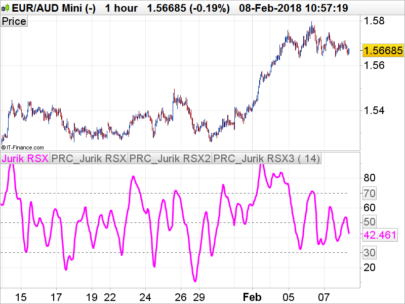
Because it is built upon RSI, divergences from price may occur.
Hello, I would like to use the QQE indicator which is based on smooth RSI as far as I understand
In the code I don’t understand the line:
trr=TrLevelSlow[1]
I would appreciate if somebody can explain me this instruction
Thank you
Jean Philippe
Bonjour Nicolas, te serait il possible de rajouter la fast ATR manquante dans le code?
Merci
Désolé je ne comprends pas la question ?