

Distribution of Returns PRTv11
March 30, 2020, 2:20 PM
Indicators
3 Comments
This indicator can only be used on PRTv11.
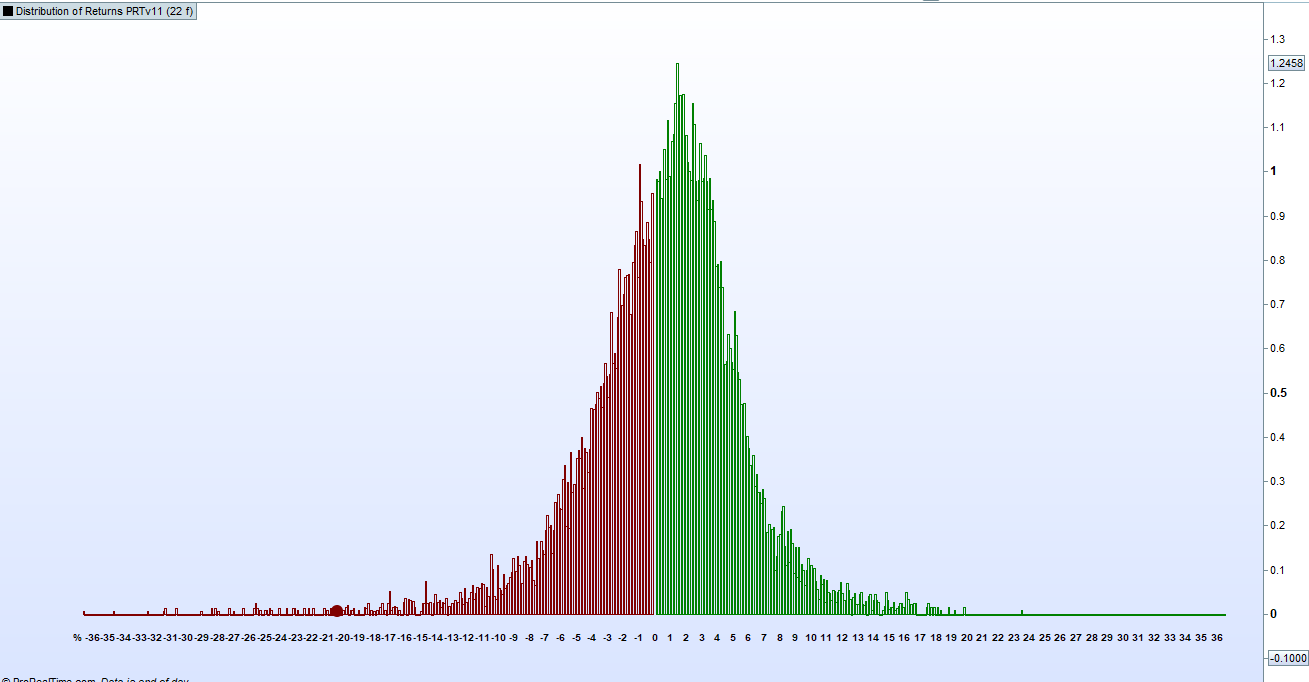
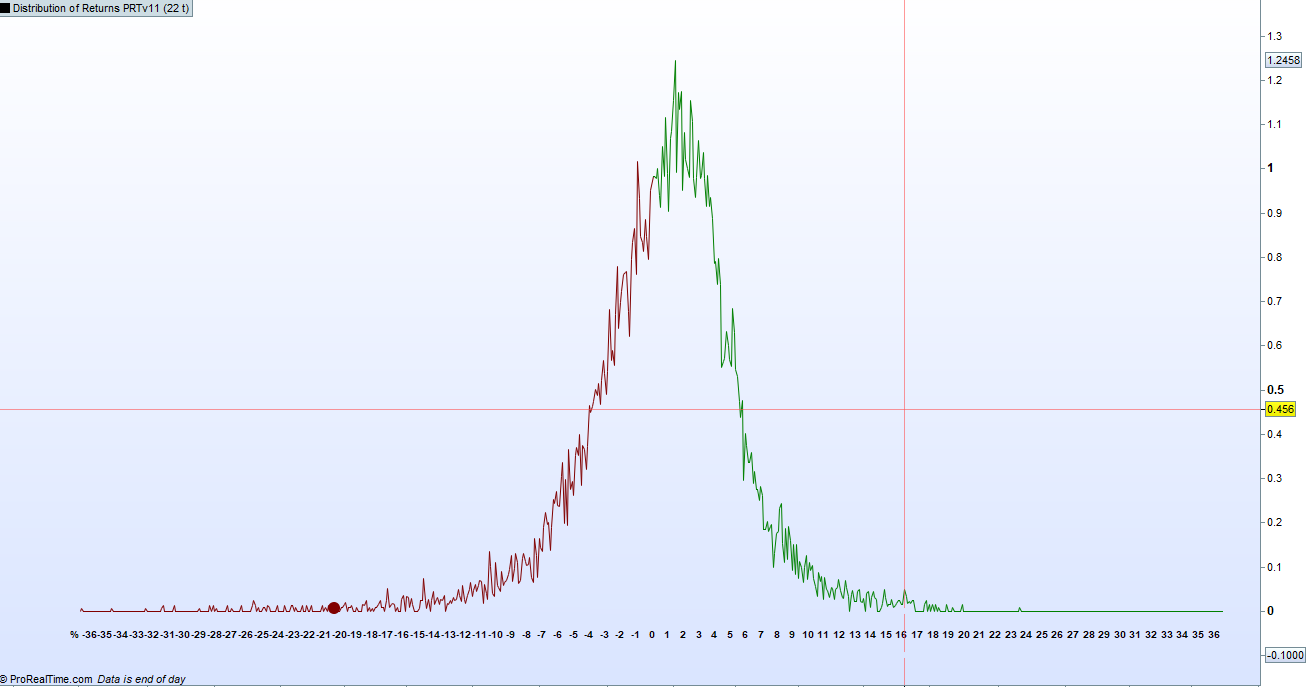
The indicator will analyse all of the history on the price chart and every time price is above or below price p bars ago it adds one to an array bucket for the exact percentage of price difference. The array buckets are 0.1% in size.
The distribution of returns curve can be drawn as either a line chart or a histogram with the ‘LineChart’ setting.
The x and y axis auto scale when drawn. The y axis is each filled array buckets quantity as a percentage of the total quantity of tests analysed.
The current position on the curve that price is compared to price p bars ago is also indicated on the curve.
I advise downloading and import to get full functionality.
//Distribution of Returns
//PRT v11 only
//By Vonasi
//Date: 20200330

defparam drawonlastbaronly = true

//Settings
//p = 22 /lookback period
//linechart = 0 // 0 = histogram 1 = line chart

//Fill positive gain array
if close > open[p] then
riseperc = round((((close - open[p])/open[p])*100),1)*10
$rise[riseperc] = $rise[riseperc] + 1
count = count + 1
endif
$risepercentage[riseperc] = ($rise[riseperc]/count)*100

//Fill negative loss array
if close < open[p] then
fallperc = round((((open[p]-close)/open[p])*100),1)*10
$fall[fallperc] = $fall[fallperc] + 1
count = count + 1
endif
$fallpercentage[fallperc] = ($fall[fallperc]/count)*100

//Only do the following code on latest bar to speed things up
if islastbarupdate then
//Get the latest gain or loss position in arrays
if close > open[p] then
thisperc = round((((close - open[p])/open[p])*100),1)*10
endif
if close < open[p] then
thisperc = -round((((open[p]-close)/open[p])*100),1)*10
endif

//Initiate drawing positions
lastvalue = $risepercentage[1]
falllastvalue = 0

//Get highest filled array for auto scaling of x axis
lastbar = max(lastset($risepercentage),lastset($fallpercentage))

//draw negative side of chart
for a = lastbar downto 1
b = a+(lastbar)
//Display line or histogram depending on setting
if linechart then
drawsegment(barindex-b-1, falllastvalue,barindex-b ,$fallpercentage[a])coloured(128,0,0)
else
drawrectangle(barindex-b-1, 0,barindex-b ,$fallpercentage[a])coloured(128,0,0)
endif

//Draw x scale text
if a mod 10 = 0 then
mytext = a/10
drawtext("-#mytext#", barindex-a+1-lastbar,-0.05,sansserif,bold,10)
endif

//Draw current position on curve if negative
if thisperc = -a then
drawpoint(barindex-b ,$fallpercentage[a],3)coloured(128,0,0)
endif

//Store old value for drawing in next loop round so segment can be drawn
falllastvalue = $fallpercentage[a]
//Store highest array value for autoscaling of y axis
maxval = max(falllastvalue,maxval)
next

//Connect gap between two sides of line chart
if linechart then
drawsegment(barindex-b, falllastvalue,barindex-b+2 ,$risepercentage[1])coloured(128,0,0)
endif

//draw positive side of chart
for a = 1 to lastbar
b = lastbar-a

//Display line or histogram depending on setting
if linechart then
drawsegment(barindex-b, lastvalue,barindex-b+1 ,$risepercentage[a])coloured(0,128,0)
else
drawrectangle(barindex-b, 0,barindex-b+1 ,$risepercentage[a])coloured(0,128,0)
endif

//Draw x scale text
if b mod 10 = 0 then
mytext = b/10
drawtext("#mytext#", barindex-a+1,-0.05,sansserif,bold,10)
endif

//Draw current position on curve if positive
if thisperc = a then
drawpoint(barindex-b+1 ,$risepercentage[a],3)coloured(0,128,0)
endif

//Store old value for drawing in next loop round so segment can be drawn
lastvalue = $risepercentage[a]
//Store highest array value for autoscaling of y axis
maxval = max(lastvalue,maxval)
next
endif

//draw x axis label
drawtext("%", barindex-(lastbar*2)-5,-0.05,sansserif,bold,10)

return  -0.1 coloured(0,0,0,0),maxval coloured(0,0,0,0)
Download
Filename:
Distribution-of-Returns-PRTv11.itf
Downloads:
204
Download
Filename:
Distribution-of-Returns-2.png
Downloads:
81
Download
Filename:
Distribution-of-Returns-PRTv11.png
Downloads:
53
Master
V-oyaging ON A S-mall I-ncome
Author’s Profile
Loading...