P and T Volatility

P and T Volatility

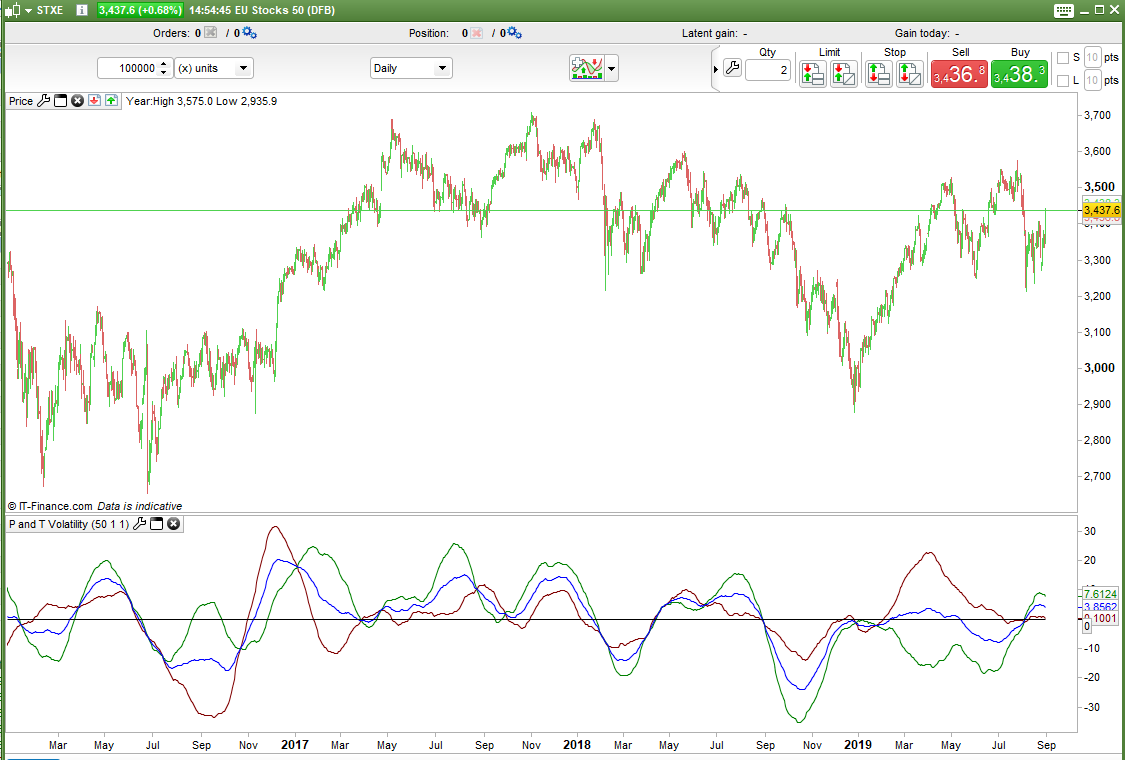
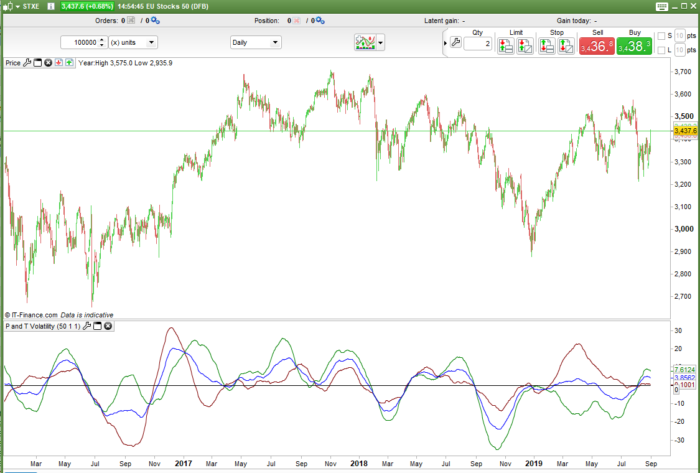
This indicator gives an indication of recent market volatility based on the number of peaks and troughs in the p look back period.

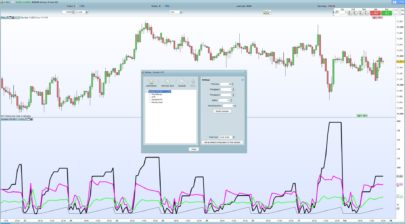
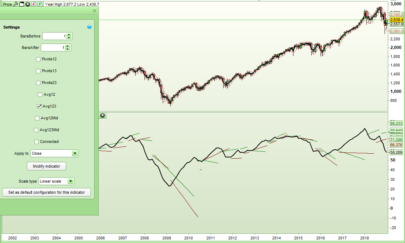
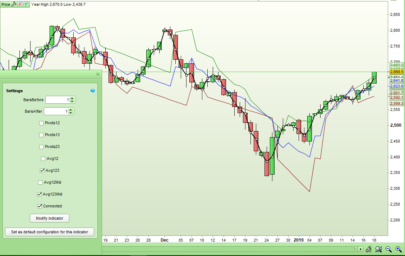
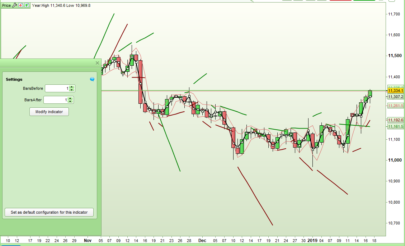
A trough or a peak can be classified by the number of bars before and after a high or low that have lower highs (for a peak) or higher lows (for a trough). Change the ‘BarsBefore’ and ‘BarsAfter’ variables to select what type of peaks and troughs you are testing for. Some people call these fractals and others pivot points and others support and resistance but I am choosing to call them peaks and troughs!

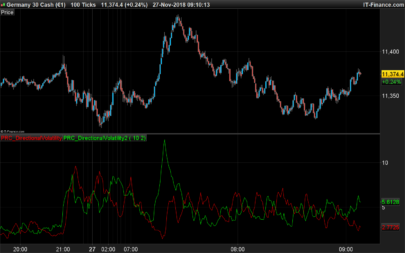
The number of peaks and troughs in the look back period are counted and returned as a weighted average line chart centred around zero. The zero line represents the all time average of peaks and troughs for the period p.

Change the look back period length by changing the value ‘p’.

The green line represents peaks (P volatility) in the look back period and the red line represents troughs (T volatility) in the look back period. The blue line is peaks and troughs (P and T volatility) combined.

Low values show that there has not been a lot of peaks or troughs recently indicating a not very volatile market.

High values show that there has been a lot of peaks or troughs recently indicating a very volatile market.

Low and High volatility readings can sometimes indicate a market that is about to change or choose a direction.

If a market has been trending then we might see the P and T volatility dropping off as the market makes less and less peaks and troughs as it heads off in whichever direction it has chosen.

If the P value is high and the T value low then it might be that the market has recently been hitting upward resistance but little downward support.

How you finally analyse the indicators output is up to you!

I advise downloading and importing the ITF file to get full functionality.

Share this

Risk disclosure:

No information on this site is investment advice or a solicitation to buy or sell any financial instrument. Past performance is not indicative of future results. Trading may expose you to risk of loss greater than your deposits and is only suitable for experienced investors who have sufficient financial means to bear such risk.

ProRealTime ITF files and other attachments : How to import ITF files into ProRealTime platform?

PRC is also on YouTube, subscribe to our channel for exclusive content and tutorials
  1. Matriciel • 08/30/2019 #

    Well done Vonasi !
    You have a lot of ideas.
    Personally, I work with Moving Averages only. Whether in a bounded indicator or not.

  2. Bard • 08/30/2019 #

    Very interesting approach Vonasi! I’m getting a 404 error when trying to download though?

  3. Vonasi • 08/30/2019 #

    I just tested and I was able to download with no error.

  4. Psari • 08/30/2019 #

    Hi Vonasi,
    I am a newbie and was wondering whether you could possibly help me with this problem:
    I would like to make an indicator with 3 Williams %R with 3 different periods and on each a Weighted Moving Average. I don’t manage to do this and would greatly appreiate your help.

avatar
Register or

Likes

avatar avatar avatar avatar avatar avatar
Related users ' posts
Juanjo Hola?. Exactamente cuál es su utilización?.
bolsatrilera Hola Juanjo, su principio esparecido a las bandas de Bollinguer.Las lineas de las bandas son...
Simba Greetings from germany! :) Can you told me your EXIT-strategy for this, please? :) Would ...
FULVIO09 Attualmente non c'è sufficiente volatilità : la condizione "C0 = AverageTrueRange[1500](Clos...
vlongobardo67 Ma io intendevo in backtest ! Scusa non l’ho menzionato.
ciniselloftse salve fulvio .il trading sistem e sempre profittevole?
Nicolas
6 years ago
Nicolas Merci, faire une demande dans le forum approprié.
Pere Thanks for this good indicator Nicolas. I would like to make the upper and lower limits mor...
Nicolas because fractals are known 2 bars later! that's why I used rectangle to plot them in the past.
jebus89 Big thanks for sharing this :) Seems to work as expected, good stuff.
Vonasi The indicator code can easily be adapted for use as a filter in strategies as well. For exam...
AVT Tested today in manual DAX trading (transcripted to MT and changed look into aka oszillator)...
Vonasi I think that short time frame charts will be too noisy for this indicator. One blue bar real...
Vonasi I forgot to mention in the description that Sunday pivot lines are ignored and Monday's pivo...
AVT Like that, simple and clear!
Vonasi Thanks AVT. I like simple - some people would say that I do simple very well! Sometimes you ...
cervantes2 Buenas tardes y gracias por este magnifico indicador. Queria saber si tienes un proscreener ...
cervantes2 Que busque los valores que la linea verde acaba de cruzar al alza o a la baja
AngelPujalt Tenéis algún screener de este indicador?
Yannick Hello There is a mistake in trailing stop code, I think that this should fix the problem s...
Paul About the trailing-stop the way it's coded. That works for backtesting only, just look at th...
Jonny sorry paul, but system says that is not possible to put many stop order combined...what have...
s00071609 I am using this indicator but it keep crashing as i change the timeframe. For example, chang...
Nicolas in the mean time you can try this one: https://www.prorealcode.com/prorealtime-indicators/ho...
Gianluca Is it possible to have an indicator where those value are as instogram ? and separated? in o...
rb-72 Thank you, area of twist by dilatacion of the price, missing part of the code that is not pu...
Thomas007 after reading your blog now I understand why there is only a part of your code here. I'm try...
Juanjo Hola¡¡ la estrategia se podria aplicar sobre acciones con marco temporal diario?? gracias.
Nicolas Please open a new forum topic, and respect the posting rules. Add a precise description of w...
FXTT ok will do, apologies, as I said I am new here. many thanks
Noobywan Version v2 including requested additions: https://www.prorealcode.com/prorealtime-indicators...
Trading_En_El_Ibex35 Para calcular el punto pivote y los niveles de soporte y resistencia para operar durante la ...
supertiti Hola mis disculpas, creia que tu eres Jose Antonio Madrigal ! gracias por las explicaci...
Trading_En_El_Ibex35 espero que las explicaciones te hayan sido de ayuda saludos
Paul Thanks for posting. I was currently searching how to improve day-trading based on support an...
Jessar Könntest du im Forum etwas öffnen und später darüber zu sprechen?
arahussein Hi All, I am new to trading and i find this indicator very logicail! Hence my (dumb?) quest...
flodefacebook Merci Nicolas pour cet indicateur. Très utile dans une technique de retournement.
HeikinAshi thank you for this very interesting indicator Nicolas! did you define a tradable setup fo...
gblast I added this indicator to my pro real time but its not showing up on my candles. Its invisible
christophe11560 salut gabri, Je n'ai pas de commentaire sur "s*s", c'est ton choix personnel. Je me posais...
gabri Hi, the SQRT(254) it is used to annualize the value. In terms of the "s*s" I just used the s...
christophe11560 Merci pour ton retour
guillermus69 is this " a= log(close/close[1])" better than a = ((close/close[1]) -1) *100 . I ...
gildaslm Hi gabri, thanks very much for your work, it helps me a lot. Have you ever tried to make the...
gandolfi thanks for your screener. Do you have the code for original Sharp ratio in order to compare ...
Abz Thanks gabri
Mattzi In your opinion is less than 20 stocks a bad idea? Thank you.
gabri No, you can pick as many or as little as you want. The portfolio composition depends on many...

Top