Hello everyone,
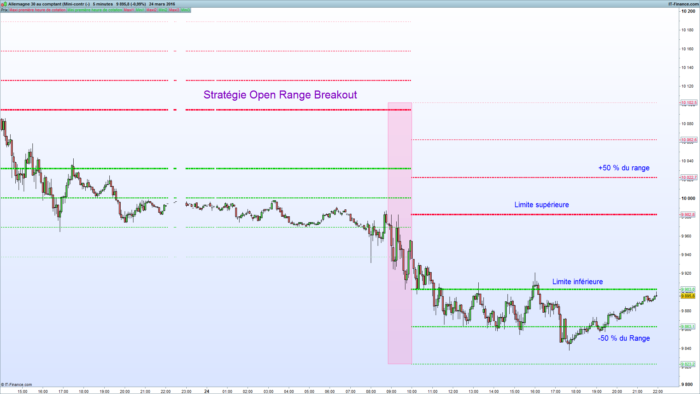
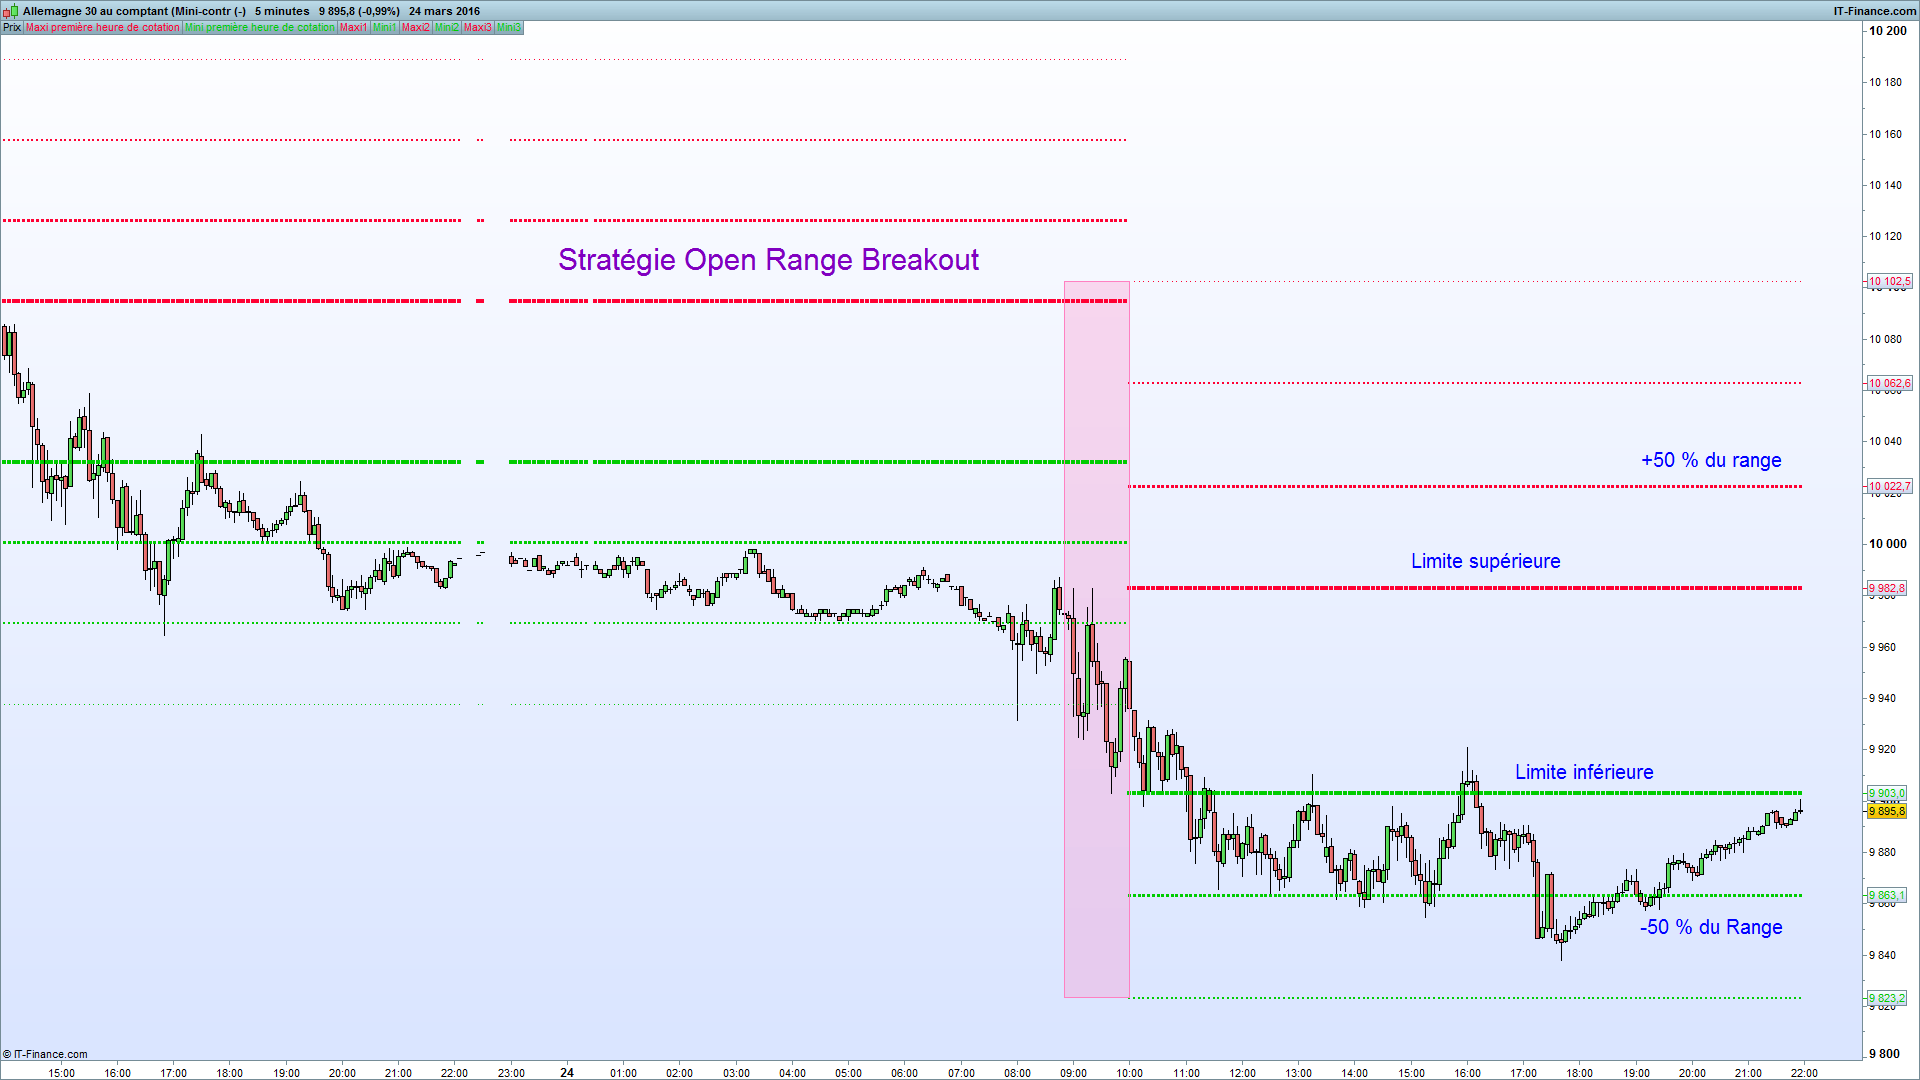
Here is the ORB indicator (Open Range Breakout) used in the famous strategy of Toby Crabel:
http://www.amazon.fr/Trading-Short-Patterns-Opening-Breakout/dp/0934380171
An explanation video:
https://www.youtube.com/watch?v=CAHG_KAhhJw
Some other details here:
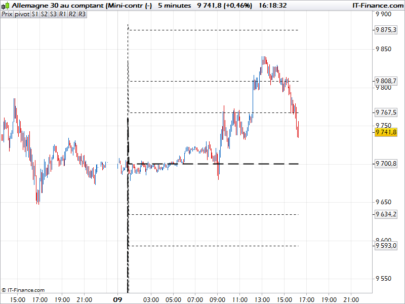
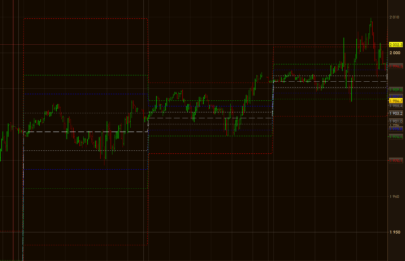
This indicator shows the highest and lowest in the first hour of trading that is very important. Default 9:00AM / 10.00AM. (European time zone)
This defines a Support and Resistance which we monitor breakage / Breakout in this strategy.
Bearings of 50% of the obtained range are also plotted.
It is of course quite possible, if desired, to change the indicator parameter for other time range
Bons trades 🙂
Zilliq
|
1 2 3 4 5 6 7 8 9 10 11 12 13 14 15 16 17 18 19 20 21 22 23 24 25 26 27 28 29 |
once maxii=undefined once minii=undefined once maxi1=undefined once mini1=undefined once maxi2=undefined once mini2=undefined once maxi3=undefined once mini3=undefined if time<090000 then maxi=high mini=low elsif time<100001 and time>=090000 then maxi=max(high,maxi) mini=min(low,mini) lerange=(maxi-mini)/2 else maxii=maxi minii=mini maxi1=maxi+lerange mini1=mini-lerange maxi2=maxi+2*lerange mini2=mini-2*lerange maxi3=maxi+3*lerange mini3=mini-3*lerange endif return maxii as "Maxi première heure de cotation", minii as "Mini première heure de cotation", maxi1 as "Maxi1" ,mini1 as "Mini1",maxi2 as "Maxi2" ,mini2 as "Mini2",maxi3 as "Maxi3" ,mini3 as "Mini3" |
____________________________________
Coding is not a crime 😉
http://www.zilliqtradingresearch.fr/
Share this
No information on this site is investment advice or a solicitation to buy or sell any financial instrument. Past performance is not indicative of future results. Trading may expose you to risk of loss greater than your deposits and is only suitable for experienced investors who have sufficient financial means to bear such risk.
ProRealTime ITF files and other attachments :PRC is also on YouTube, subscribe to our channel for exclusive content and tutorials



Hey zilliq,
thank you for the code. But if I try to import it, it opens as an extra window, right below the normal chart.
how can I get it in the chart?
Cheers
Flo
sorry for asking… I found the problem.
bonjour,
Après import, “
Open Range Breakout Indicator ORB” n’apparaît dans la liste des Proscreener. Pourquoi ?
Bonjour, parce qu’il s’agit d’un indicateur et non d’un screener 🙂
Hi,
Nice indicator.
How do you display just the one set of lines for a given day, rather than all previous lines please?
Regards.
Hi zilliq! I have imported the indicator into Prorealtime but it doesn’t overlay the price chart , it has a seperated like the other indicators eg MACD, am i doing something wrong?
how do you overlay in price chart?
Use the wrench of the price chart.
I really need this ORB indicator in mq4 or EXE file. Who has it Please?
This website is dedicated to prorealtime programming, you’ll not find any MT4 files around here.
Thanks Nicolas.
Thanks Nico for the advice. I was talking about this file “open-range-breakout-orb.itf” and if it can be saved in exe format
good day traders. i tried to download this ORB indi but when i load using wrench it just plots black lines, nothing like the chart here. any suggestion guys? thanks
Hello! This Indicator is not working if i change the displayed time. if i set time for example in the dax from 08.00-22.15 it doesnt work anymore. is there a solution for this problem? thank you in advance
Found the solution in a forum post from nicolas…thank you 🙂
Bonjour merci pour votre contribution
Comment changer les horaire je voudrai mettre l horaire de NY fuseau asie soit 21h30 merci j ai essayer de modifier les heures sur le scrip mais cela m indique RETURN Merci de votre concours
once maxii=undefined
once minii=undefined
once maxi1=undefined
once mini1=undefined
once maxi2=undefined
once mini2=undefined
once maxi3=undefined
once mini3=undefined
if time<093000 then
maxi=high
mini=low
elsif time=093000 then
maxi=max(high,maxi)
mini=min(low,mini)
lerange=(maxi-mini)/2
midrange=(maxi+mini)/2
else
maxii=maxi
minii=mini
maxi1=maxi+lerange
mini1=mini-lerange
maxi2=maxi+2*lerange
mini2=mini-2*lerange
maxi3=maxi+3*lerange
mini3=mini-3*lerange
midrangei =midrange
endif
return maxii as “ORH”, minii as “ORL”, maxi1 as “UpperTarget1” ,mini1 as “LowerTarget1”,maxi2 as “UpperTarget2” ,mini2 as “LowerTarget2”,maxi3 as “UpperTarget3” ,mini3 as “LowerTarget3”, midrangei as “MiddleRange”
Hi, I used the above 5-Min ORB indicator codes for US30 DOW Index, from 9.30am to 9.35am New York Time. Most of the days the ORH (Opening Range High) & ORL (Opening Range Low) are plotted correctly.
However, I noted the ORH for 30-Dec-2024 was plotted incorrectly. It was using the 9.28am High as the ORH for 30-Dec-2024.
May I know why? And how can I correct it? Thank you in advance.