True Multi-Timeframe Dynamically Adapting ATR
This is actually a major overall to an earlier indicator I submitted to the library. The idea behind this indicator is to provide us with an Average True Range indicator than instead of the standard ATR indicator which is calculated with a static look back period, rather give us an ATR indicator that will only look at the most relevant price data. This means the indicator will (depending on the timeframe selected) only consider either market hours, after market hours or current weekly data. In this way, the sampled price data will always be relevant. The look-back period used to calculate the ATR will thus dynamically adapt as the trading day or week progress.
Explanation of the parameters:
- TFMinutes: This parameter is used to input the current timeframe in minutes. (So for 5m TF set the parameter to 5, for hourly set it to 60)
- TFMultiplier1: Those too lazy to work out higher timeframes you can use the multipliers. (Hourly TF is: TFMinutes = 1 and TFMultiplier1 = 60)
- TFMultiplier2: Extention to the above functionality. (4-Hour TF is: TFMinutes = 1, TFMultiplier1 = 60 and TFMultiplier2 = 4)
- stdDev: Standard deviation used to calculate the Relative ATR line
- RecentDataPer: What percentage of the lookback period to sample for the SampledATR calculation (Recent Data)
- MiddleDataPer: What percentage of the lookback period to sample for the SampledATR calculation (Middle Data)
- EarlyDataPer: What percentage of the lookback period to sample for the SampledATR calculation (Early Data)
- ShowCalculationPeriod: Can be enabled to show a line on the indicator with the lookback period used for calculations
- UseCloseOpenvsHighLow: If enabled will use open and close values instead of high and low to calculate the Total Price Range
- GMTOffset: This is used to offset the GMT time difference in the code. (Default is set to GMT+2)
- MarketOpenHour: Enter the hour (24hr) in which the market opens
- MarketCloseHour: Enter the hour (24hr) in which the market closes
- EnableAfterHours: Enable to calculate ATR values for after hours
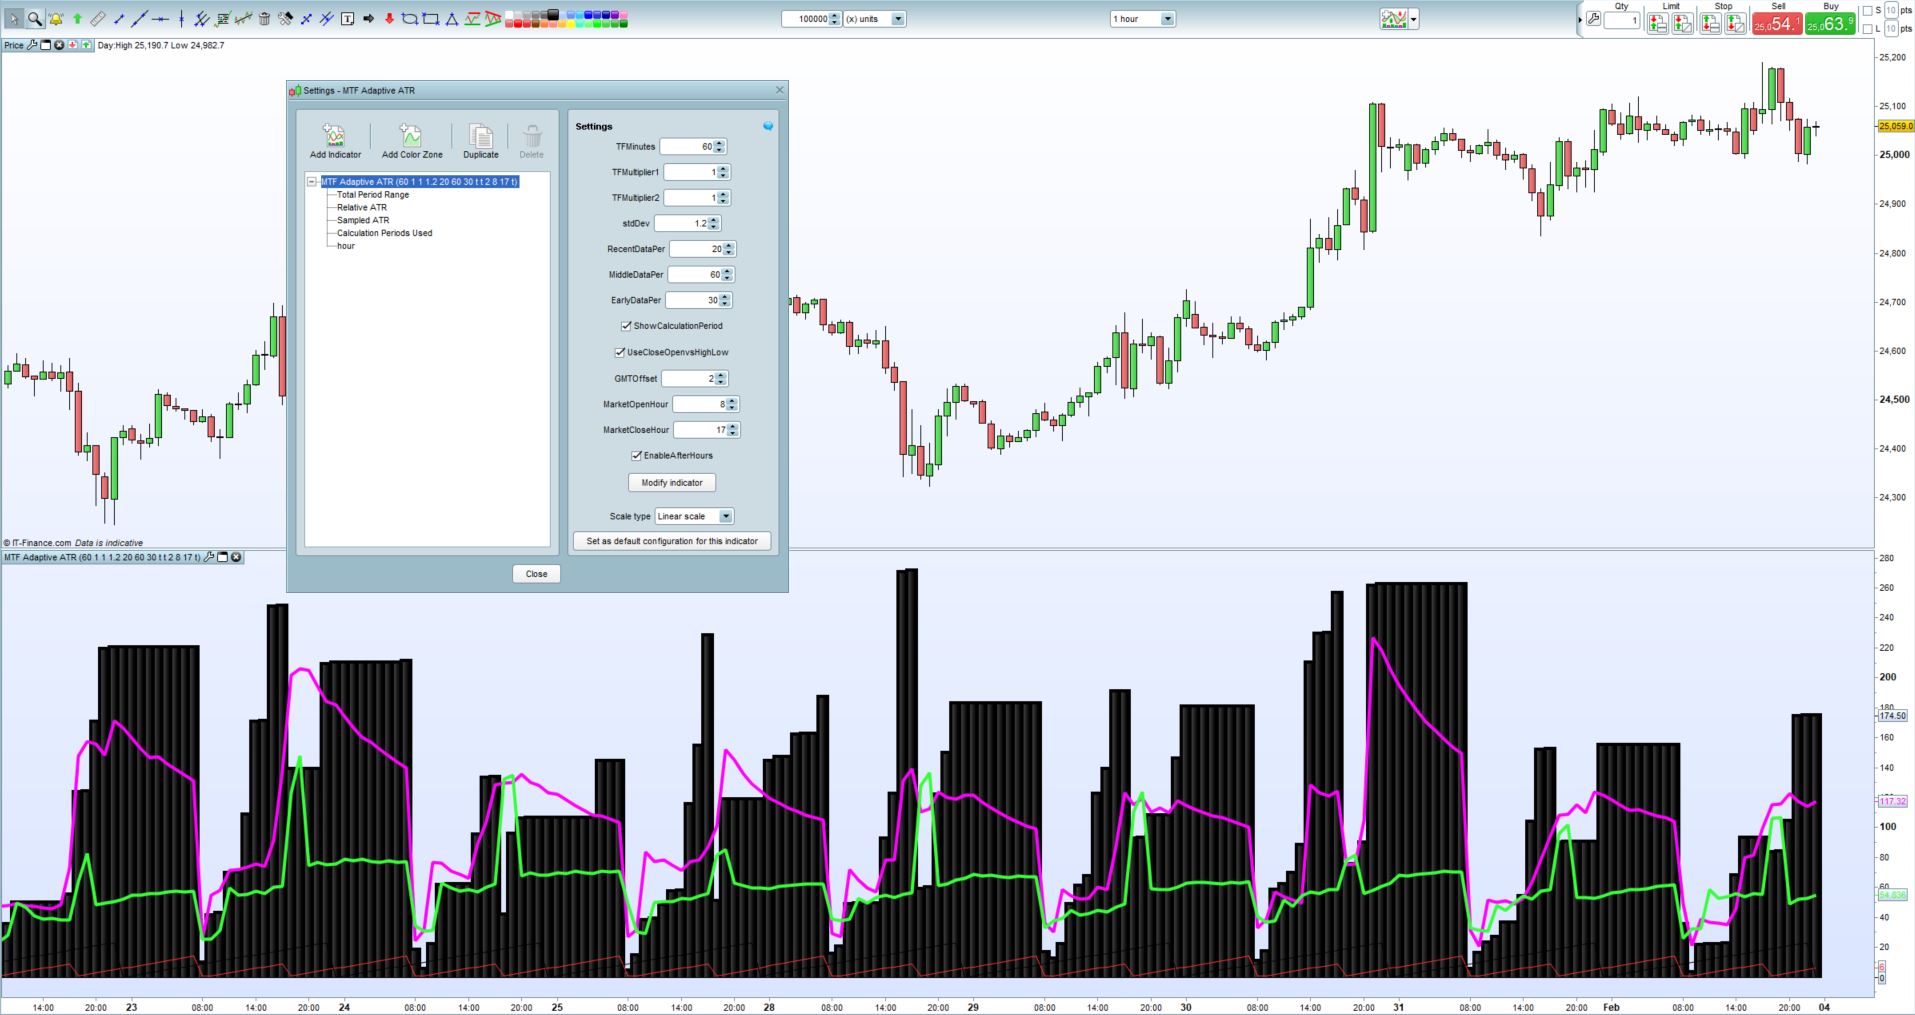
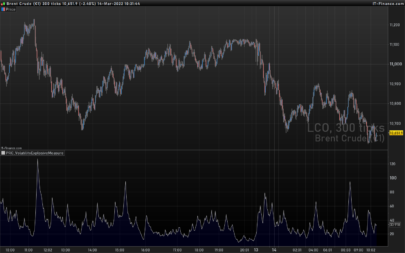
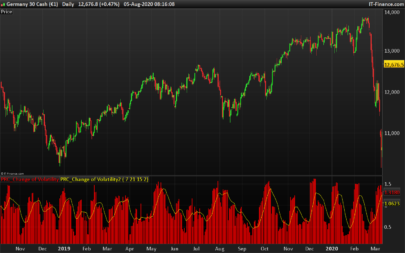
Indicator Output Explained:
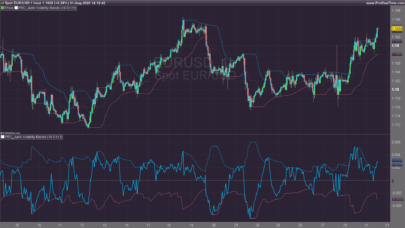
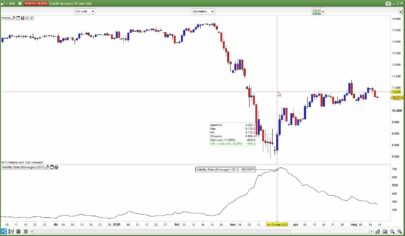
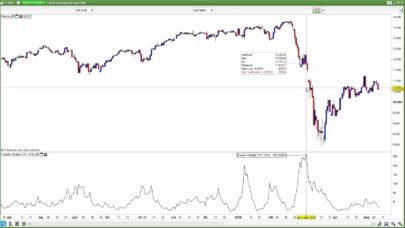
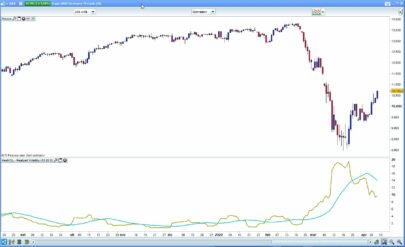
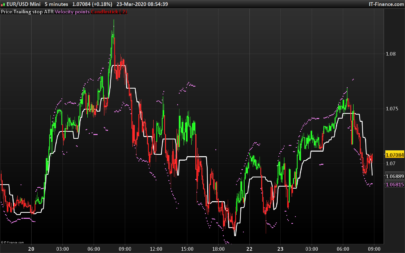
- The black histogram shows the total price range for the evaluated period (be that for in-market hours, after-market hours or current weekly data)
- The pink line called ‘Relative ATR’ shows the standard deviation adjusted ATR value based on the evaluation period
- The green line called ‘Sampled ATR’ shows the averaged ATR as sampled over the 3 different data sets (within the evaluation period)
Possible Interpretations:
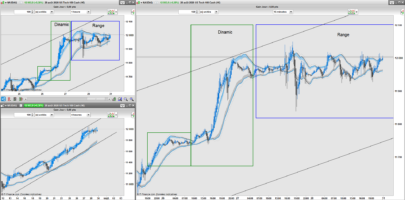
- When the black histogram expands it signifies that price is breaking higher or lower and expanding the current trading range.
- When the black histogram increases in steps without remaining static for extended periods we can assume the market is trending
- When the black histogram remains static we can assume the market is consolidating or ranging (watch for expansion)
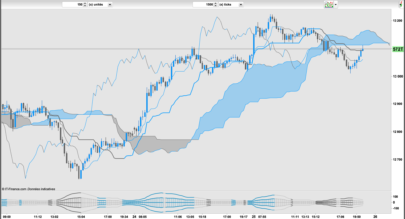
- When the pink line rises with the green line we can assume that volatility is increasing
- When the pink line falls with the green line we can assume that volatility is decreasing
- When the pink line and the green line diverge we can assume a possible direction change is probable
- When either the pink line or the green line extends above the histogram it implies current volatility is extreme
- When the pink line stays high relative to the histogram it implies market is choppy with no clear direction
- When the pink line stays low relative to the histogram it implies the market has a lot of momentum and trending
|
1 2 3 4 5 6 7 8 9 10 11 12 13 14 15 16 17 18 19 20 21 22 23 24 25 26 27 28 29 30 31 32 33 34 35 36 37 38 39 40 41 42 43 44 45 46 47 48 49 50 51 52 53 54 55 56 57 58 59 60 61 62 63 64 65 66 67 68 69 70 71 72 73 74 75 76 77 78 79 80 81 82 83 84 85 86 87 88 89 90 91 92 93 94 95 96 97 98 99 100 101 102 103 104 105 106 107 108 109 110 |
//MTF Adaptive ATR v1.0 (For ProRealTime) //By Juan Jacobs //www.FXautomate.com defparam calculateonlastbars = 1440 //Default Parameters: //TFMinutes = 60 (Integer) //TFMultiplier1 = 1 (Integer) //TFMultiplier2 = 1 (Integer) //stdDev = 1.2 (Decimal) //RecentDataPer = 20 (Integer) //MiddleDataPer = 60 (Integer) //EarlyDataPer = 30 (Integer) //ShowCalculationPeriod = Not Ticked (Boolean) //UseCloseOpenvsHighLow = Ticked (Boolean) //GMTOffset = +2 (Integer) //MarketOpenHour = 8 (Integer) //MarketCloseHour = 17 (Integr) //EnableAfterHours = Ticked (Boolean) TF = TFMinutes*TFMultiplier1*TFMultiplier2 OpenMin = (MarketOpenHour)*60 cGMTOffset = (GMTOffset)*-1 If TF > 60 Then If hour = 0 Then per = per[1]+1 Else per = abs(((DayofWeek*1440)-OpenMin-((24-(Hour+cGMTOffset))*60))/TF) EndIf ElsIf TF = 60 Then If Hour < (MarketOpenHour+((cGMTOffset+1)*-1)) or Hour > (MarketCloseHour+((cGMTOffset+1)*-1)) Then If EnableAfterHours Then If Hour < (MarketOpenHour+((cGMTOffset+1)*-1)) and hour > 0 Then per = (((Hour+cGMTOffset+1)*60) + ((24-MarketCloseHour)*60))/TF Else If hour = 0 Then per = (((24+cGMTOffset+1)-MarketCloseHour)*60)/TF Else per = (((hour+cGMTOffset+1)-MarketCloseHour)*60)/TF EndIf EndIf Else per = 1 EndIf Else per = abs((1440-OpenMin-((24-(Hour+cGMTOffset+1))*60))/TF) EndIf Else If (Hour < (MarketOpenHour+((cGMTOffset+3)*-1))) or (Hour-1 < (MarketOpenHour+((cGMTOffset+3)*-1)) and minute >= 0) or Hour > (MarketCloseHour+((cGMTOffset+3)*-1)) Then If EnableAfterHours Then If Hour < (MarketOpenHour+((cGMTOffset+1)*-1)) and hour > 0 Then per = ((((Hour+cGMTOffset+2)*60)+minute + ((24-MarketCloseHour)*60))/TF)-1 Else If hour = 0 Then per = (((((24+cGMTOffset+2)-MarketCloseHour)*60)+minute)/TF)-1 Else per = (((((hour+cGMTOffset+2)-MarketCloseHour)*60)+minute)/TF)-1 EndIf EndIf Else per = 1 EndIf Else per = abs((1440-OpenMin-((24-(Hour))*60)+minute)/TF)-1 EndIf EndIf If per < 1 Then per = 1 Else per = abs(round(per)) EndIf If UseCloseOpenvsHighLow Then PeriodHigh = Max(Highest[per](close),Highest[per](open)) PeriodLow = Min(Lowest[per](close),Lowest[per](open)) Else PeriodHigh = Highest[per](high) PeriodLow = Lowest[per](low) EndIf PeriodRange = PeriodHigh - PeriodLow RelativeATR = average[per](range)+stdDev*STD[per](range) If abs(Round(per/(100/RecentDataPer))) < 1 Then Sample1 = 1 Else Sample1 = abs(Round((100/RecentDataPer))) //Represents first and last 20% of data EndIf If abs(Round(per/(100/MiddleDataPer))) < 1 Then Sample2 = 1 Else Sample2 = abs(Round(per/(100/MiddleDataPer))) //Represents middle 40% of data EndIf If abs(Round(per/(100/EarlyDataPer))) < 1 Then Sample3 = 1 Else Sample3 = abs(Round(per/(100/EarlyDataPer))) //Represents middle 40% of data EndIf SampledATR = average[per](((AverageTrueRange[Sample3](close)[Sample1+Sample2+1])+(AverageTrueRange[Sample2](close)[Sample1+1])+(AverageTrueRange[Sample1](close)[1]))/3) If ShowCalculationPeriod Then showcalcper = 255 Else showcalcper = 0 EndIf Return PeriodRange coloured(0,0,0) style(histogram,4) as "Total Period Range",RelativeATR coloured(255,0,255) style(line,4) as "Relative ATR", SampledATR coloured(55,255,55) style(line,4) as "Sampled ATR", per coloured(255,50,50,showcalcper) as "Calculation Periods Used", hour as "hour" |
Share this
No information on this site is investment advice or a solicitation to buy or sell any financial instrument. Past performance is not indicative of future results. Trading may expose you to risk of loss greater than your deposits and is only suitable for experienced investors who have sufficient financial means to bear such risk.
ProRealTime ITF files and other attachments :
Find other exclusive trading pro-tools on ![]()
PRC is also on YouTube, subscribe to our channel for exclusive content and tutorials