

MarketProfileLive
February 20, 2024, 10:33 AM
Indicators
7 Comments
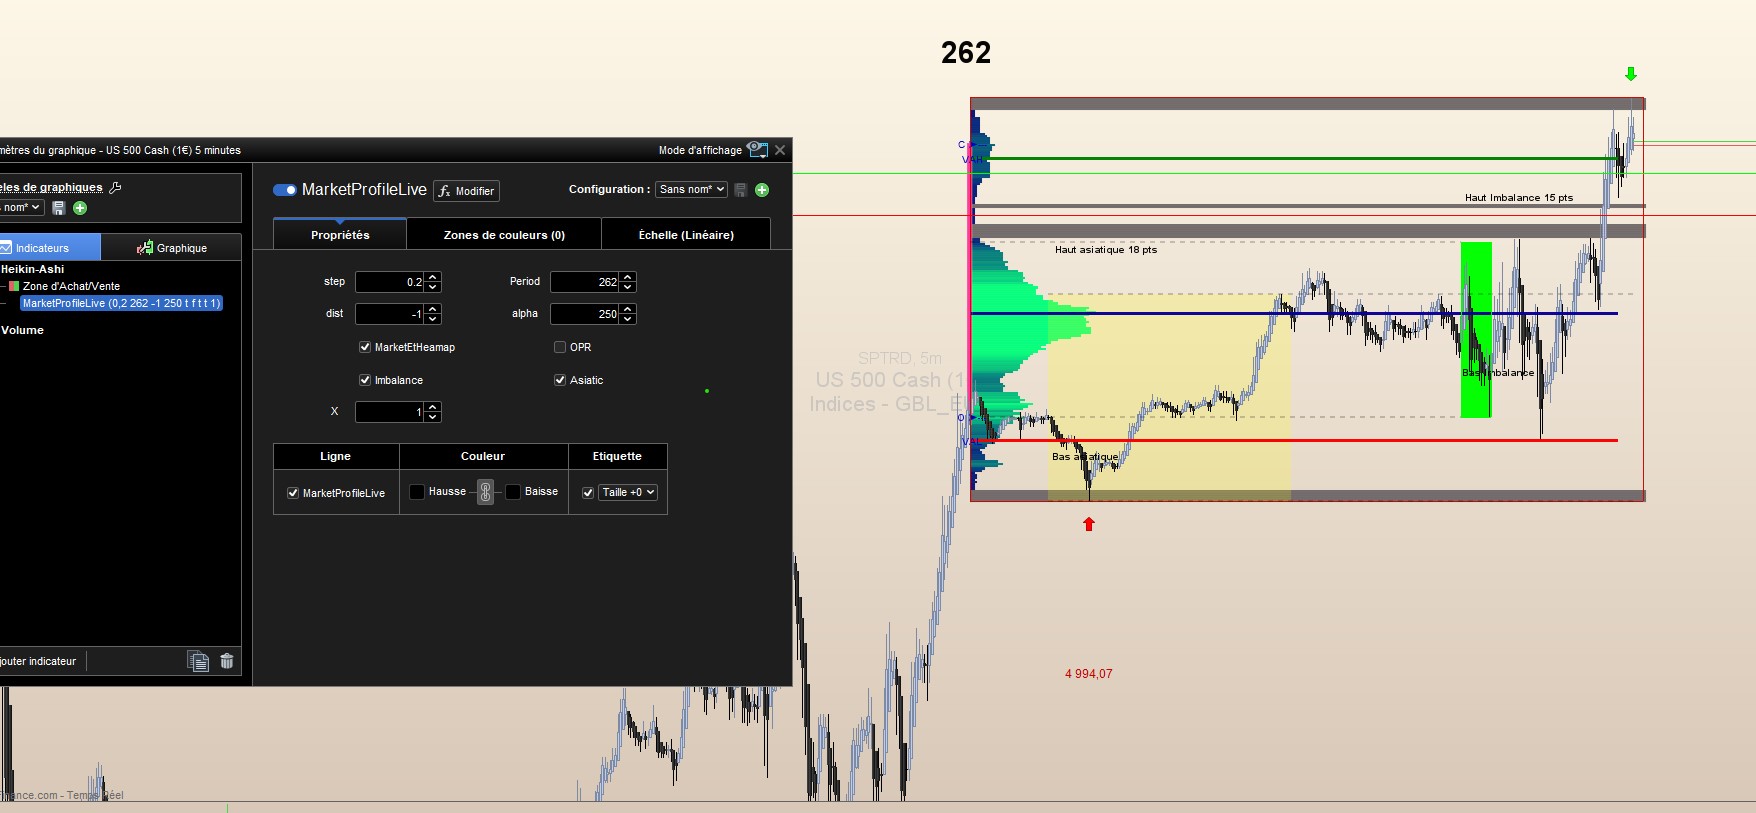
Market profile indicator for the ProRealTime trading platform, designed to analyze and display the distribution of trading activity over the current day. It calculates the market profile by examining the price levels at which trading activity occurs and highlights areas of high and low activity. This script employs several key features:
- Dynamic Range Calculation: It calculates the highest and lowest price levels within a specified period, adjusting dynamically as new data comes in.
- Volume Analysis: The script assesses the volume of trades at different price levels, identifying areas with significant trading activity. This feature uses an array to track the number of touches (i.e., instances where the price hits a specific level) to determine the most traded price levels (MaxTouch1 and MaxTouch2).
- Standard Deviation and Center Line (CL): It computes the standard deviation of prices to determine the volatility around the mean price level, along with the center line, to outline the Value Area High (VAH) and Value Area Low (VAL).
- Visualization Enhancements: The script uses rectangles and text annotations to visually represent the market profile, including the opening (O) and closing (C) prices, VAH, and VAL. It also highlights the highest and lowest prices reached within the session and marks specific periods of interest, such as the Asian session or periods of imbalance.
- Customizability: Parameters such as the period for calculations, ATR (Average True Range) for volatility assessment, and specific session times are customizable, allowing traders to adapt the indicator to their specific needs.
This indicator is particularly useful for traders who rely on volume profile analysis to make informed decisions, offering insights into where and how much trading activity is occurring at different price levels. It helps identify key support and resistance levels, areas of consolidation, and potential price movement directions based on historical trading activity.
defparam drawonlastbaronly=true
once basculejour=1
once conte=0
once count=0
atr=AverageTrueRange[14](close)
cont=period+count
StopLookback=period
voltot=0
pricelevel=0
nb=1
hh = Highest[cont](High)
ll = Lowest[cont](Low)

checkprice = ll
MaxTouch1 = 0

if IsLastBarUpdate then

For j = 1 To nb do
COUNT = COUNT+1
for k = 0 To cont-1 do
ind=0 //reset index of array
//get the price touch occurrences for each level
while checkprice<=hh do
touch=0 //reset price touch for this price level
for m = 0 to cont-1 do
if High[cont*(j-1)+m]>=checkprice and Low[cont*(j-1)+m]<=checkprice then
touch=touch+1
$hm[ind] = touch
endif
next

if $hm[ind] > MaxTouch1 then
MaxTouch1 = $hm[ind]
MaxTouch2 = checkprice
voltot=MaxTouch2

endif
CL=(hh+ll)/2
StdDev = (hh- ll) / 2
VX=0.7
VAH=CL + StdDev *vx
VAL=CL - StdDev * VX

//define color
r = min($hm[ind]*10,255)

//plot the result
if marketEtHeamap=1 then
//drawtext("█",barindex+5+x,checkprice) coloured(r,0,0)
//drawtext("#touch#",barindex+20+x,checkprice,SansSerif,Standard,10) coloured(110,110,110)

if step>5 then

endif
drawrectangle(barindex[cont]-touch/(dist),checkprice-step/2,barindex[cont],checkprice+step/2)coloured(0,r,130,alpha)bordercolor(200,r,0,10)
endif

if touch<=1 then
drawrectangle(barindex+5,checkprice-step/2,barindex[cont],checkprice+step/2)coloured(110,110,110,alpha)bordercolor(200,r,0,10)
endif

checkprice=checkprice+step //increase price check for next round
ind=ind+1 //increase array index
wend
DrawText("#cont#",Barindex[cont+1]+x,hh+atr,Dialog,Bold,30) coloured(0,0,0,250)
DRAWsegment(barindex-5-x, MaxTouch2, Barindex[cont], MaxTouch2) coloured(r,0,150,250)style(line,3)
DRAWsegment(barindex-5-x, VAH, Barindex[cont], VAH) coloured(0,130,0,250)style(line,3)
DRAWsegment(barindex-5-x, VAL, Barindex[cont], VAL) coloured(250,0,0,250)style(line,3)
next
next
endif

O=dopen(0)
c=dclose(0)

drawrectangle(Barindex[cont+1], o,Barindex[cont]+1, close) coloured(255,55,150,250) bordercolor(210,210,210,50)
drawtext("O ➤---",Barindex[cont]+x,o*pipsize,Dialog,Standard,10) coloured(0,0,210,250)
drawtext("C ➤---",Barindex[cont]+x,c*pipsize,Dialog,Standard,10) coloured(0,0,210)
drawtext("VAH",Barindex[cont]+x, VAH*pipsize,Dialog,Standard,10) coloured(0,0,210,250)
drawtext("VAL",Barindex[cont]+x, VAL*pipsize,Dialog,Standard,10) coloured(0,0,210,250)
//drawtext("VAL",coordX+45, val) anchor(MIDDLE ,xshift,value)coloured(r,0,0)
if IsLastBarUpdate then

For j = 1 To nb do
for i = 1 To StopLookback-1 do

IF High[StopLookback*(j-1)+i]=hh[(j-1)*StopLookback] Then

//hh=High[StopLookback*(j-1)+i]
HighestI = BarIndex[StopLookback*(j-1)+i]
//DRAWTEXT(hh[(j-1)*StopLookback]-x, HighestI, hh[(j-1)*StopLookback]+20, Dialog, Standard, 12) COLOURED(0,255,0)
//DRAWARROWDOWN(HighestI-x,hh[(j-1)*StopLookback]+5) COLOURED(0,255,00)
endif
IF Low[StopLookback*(j-1)+i]=ll[(j-1)*StopLookback] Then
//ll=Low[StopLookback*(j-1)+i]
LowestI = BarIndex[StopLookback*(j-1)+i]
//DRAWTEXT(ll[(j-1)*StopLookback]-x, LowestI, ll[(j-1)*StopLookback]-20, Dialog, Standard, 12) COLOURED(200,0,0)
//DRAWARROWUP(LowestI-x,ll[(j-1)*StopLookback]-5) COLOURED(255,0,00)
endif

next
next
endif
drawrectangle(barindex[cont],hh,barindex+4,ll)coloured(0,r,130,1)bordercolor(200,r,0,alpha)

debutN = 150500
finN = 153500

// TRACE DU RECTANGLE DE L'OPR US

IF time = debutN THEN
hautN = 0
basN = 0
barredebutN = barindex
ENDIF

IF time = finN THEN
barrefinN = barindex
ENDIF

IF time >= debutN AND time <= finN THEN
IF high > hautN THEN
hautN = high

ENDIF
IF low < basN OR time = debutN THEN
basN = low
ENDIF
difN = round(abs(hautN-basN))
ENDIF
if OPR=1 then
IF time >= finN THEN
DrawText(" OPR H #difn#pts",barredebutN,hautN+4*pointsize,Dialog,Bold,10) coloured(0,0,0,250)
DrawText(" OPR B",barredebutN,basN+4*pointsize,Dialog,Bold,10) coloured(0,0,0,250)
drawsegment(barredebutN,hautN,Barindex,hautN) coloured(0,0,0,50) STYLE (dottedline,2)
DRAWRECTANGLE(barredebutN,hautN,barrefinN,basN) coloured(0,0,255,Alpha)bordercolor(0,0,255,Alpha)
drawsegment(barredebutN,basN,Barindex,basN) coloured(0,0,0,50) STYLE (dottedline,2)
ENDIF
endif
// heures de session
debut = 010000
fin = 090000
dA = 010000
fA = 013000

// ... (le reste de votre script)

// TRACE Le A
dA = 010000
fA = 013000
barA=barindex
i = 0
if OpenTime =dA and basculejour=1 then

for i = 1 * pipsize to 6 * pipsize
HA=close[i]
NEXT

endif

// TRACE DU RECTANGLE DE SESSION ASIATIQUE

IF time = debut THEN
haut = 0
bas = 0
barredebut = barindex
ENDIF

IF time = fin THEN
barrefin = barindex
ENDIF

IF time >= debut AND time <= fin THEN
IF high > haut THEN
haut = high

ENDIF
IF low < bas OR time = debut THEN
bas = low
ENDIF
dif = round(abs(haut-bas))
ENDIF
if asiatic=1 then
IF time >= fin THEN
DrawText(" Haut asiatique #dif#pts",barredebut,haut+4*pointsize,Dialog,Bold,10) coloured(0,0,0,250)
DrawText(" Bas asiatique",barredebut,bas+4*pointsize,Dialog,Bold,10) coloured(0,0,0,250)
drawsegment(barredebut,haut,Barindex,haut) coloured(0,0,0,50) STYLE (dottedline,2)
DRAWRECTANGLE(barredebut,haut,barrefin,bas) coloured(255,255,0,50)bordercolor(255,255,0,1)
drawsegment(barredebut,bas,Barindex,bas) coloured(0,0,0,50) STYLE (dottedline,2)
ENDIF
endif
debutL = 143500
finL = 153500

// TRACE DU RECTANGLE DE SESSION ASIATIQUE

IF time = debutL THEN
hautL = 0
basL = 0
barredebutL = barindex
ENDIF

IF time = finL THEN
barrefinL = barindex
ENDIF

IF time >= debutL AND time <= finL THEN
IF high > hautL THEN
hautL = high

ENDIF
IF low < basL OR time = debutL THEN
basL = low
ENDIF
difL = round(abs(hautL-basL))
ENDIF
if Imbalance=1 then
IF time >= finL THEN
DrawText(" Haut Imbalance #difL#pts",barredebutL,hautL+4*pointsize,Dialog,Bold,10) coloured(0,0,0,250)
DrawText(" Bas Imbalance",barredebutL,basL+4*pointsize,Dialog,Bold,10) coloured(0,0,0,250)
drawsegment(barredebutL,hautL,Barindex[period],hautL) coloured(0,0,0,50) STYLE (dottedline,2)
DRAWRECTANGLE(barredebutL,hautL,barrefinL,basL) coloured(0,255,0,Alpha)bordercolor(0,255,0,Alpha)
drawsegment(barredebutL,basL,Barindex[period],basL) coloured(0,0,0,50) STYLE (dottedline,2)
ENDIF
endif
if IsLastBarUpdate then

For j = 1 To nb do

for i = 1 To StopLookback-1 do

IF High[StopLookback*(j-1)+i]=hh[(j-1)*StopLookback] Then

//hh=High[StopLookback*(j-1)+i]
HighestI = BarIndex[StopLookback*(j-1)+i]
DRAWTEXT(hh[(j-1)*StopLookback], HighestI, hh[(j-1)*StopLookback]+15, Dialog, Standard, 12) COLOURED(0,255,0)
DRAWARROWDOWN(HighestI,hh[(j-1)*StopLookback]+2) COLOURED(0,255,00)

endif
IF Low[StopLookback*(j-1)+i]=ll[(j-1)*StopLookback] Then
//ll=Low[StopLookback*(j-1)+i]
LowestI = BarIndex[StopLookback*(j-1)+i]
DRAWTEXT(ll[(j-1)*StopLookback], LowestI, ll[(j-1)*StopLookback]-15, Dialog, Standard, 12) COLOURED(200,0,0)
DRAWARROWUP(LowestI,ll[(j-1)*StopLookback]-2) COLOURED(255,0,00)

endif

next
next

endif
// Paramètres
periode = 20 // Periode pour les calculs

// Calcul des moyennes mobiles
moyenneHaut = Average[periode](high)
moyenneBas = Average[periode](low)
volumeTotal = Average[periode](volume)

// Estimation de la Value Area
VAH = moyenneHaut // Estimation de Value Area High
VAL = moyenneBas // Estimation de Value Area Low

// Dessiner la Value Area
DRAWLINE(BarIndex[periode], VAH, BarIndex, VAH) COLOURED(0, 255, 0) // Ligne verte pour la VAH
DRAWLINE(BarIndex[periode], VAL, BarIndex, VAL) COLOURED(255, 0, 0) // Ligne rouge pour la VAL
return
Download
Filename:
MarketProfileLive.itf
Downloads:
382
Senior
Operating in the shadows, I hack problems one by one. My bio is currently encrypted by a complex algorithm. Decryption underway...
Author’s Profile
Loading...