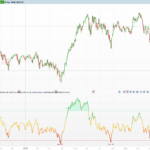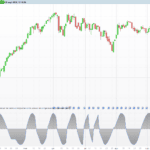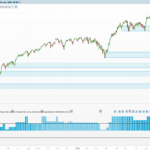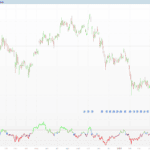






Market Structure Oscillator
Introduction
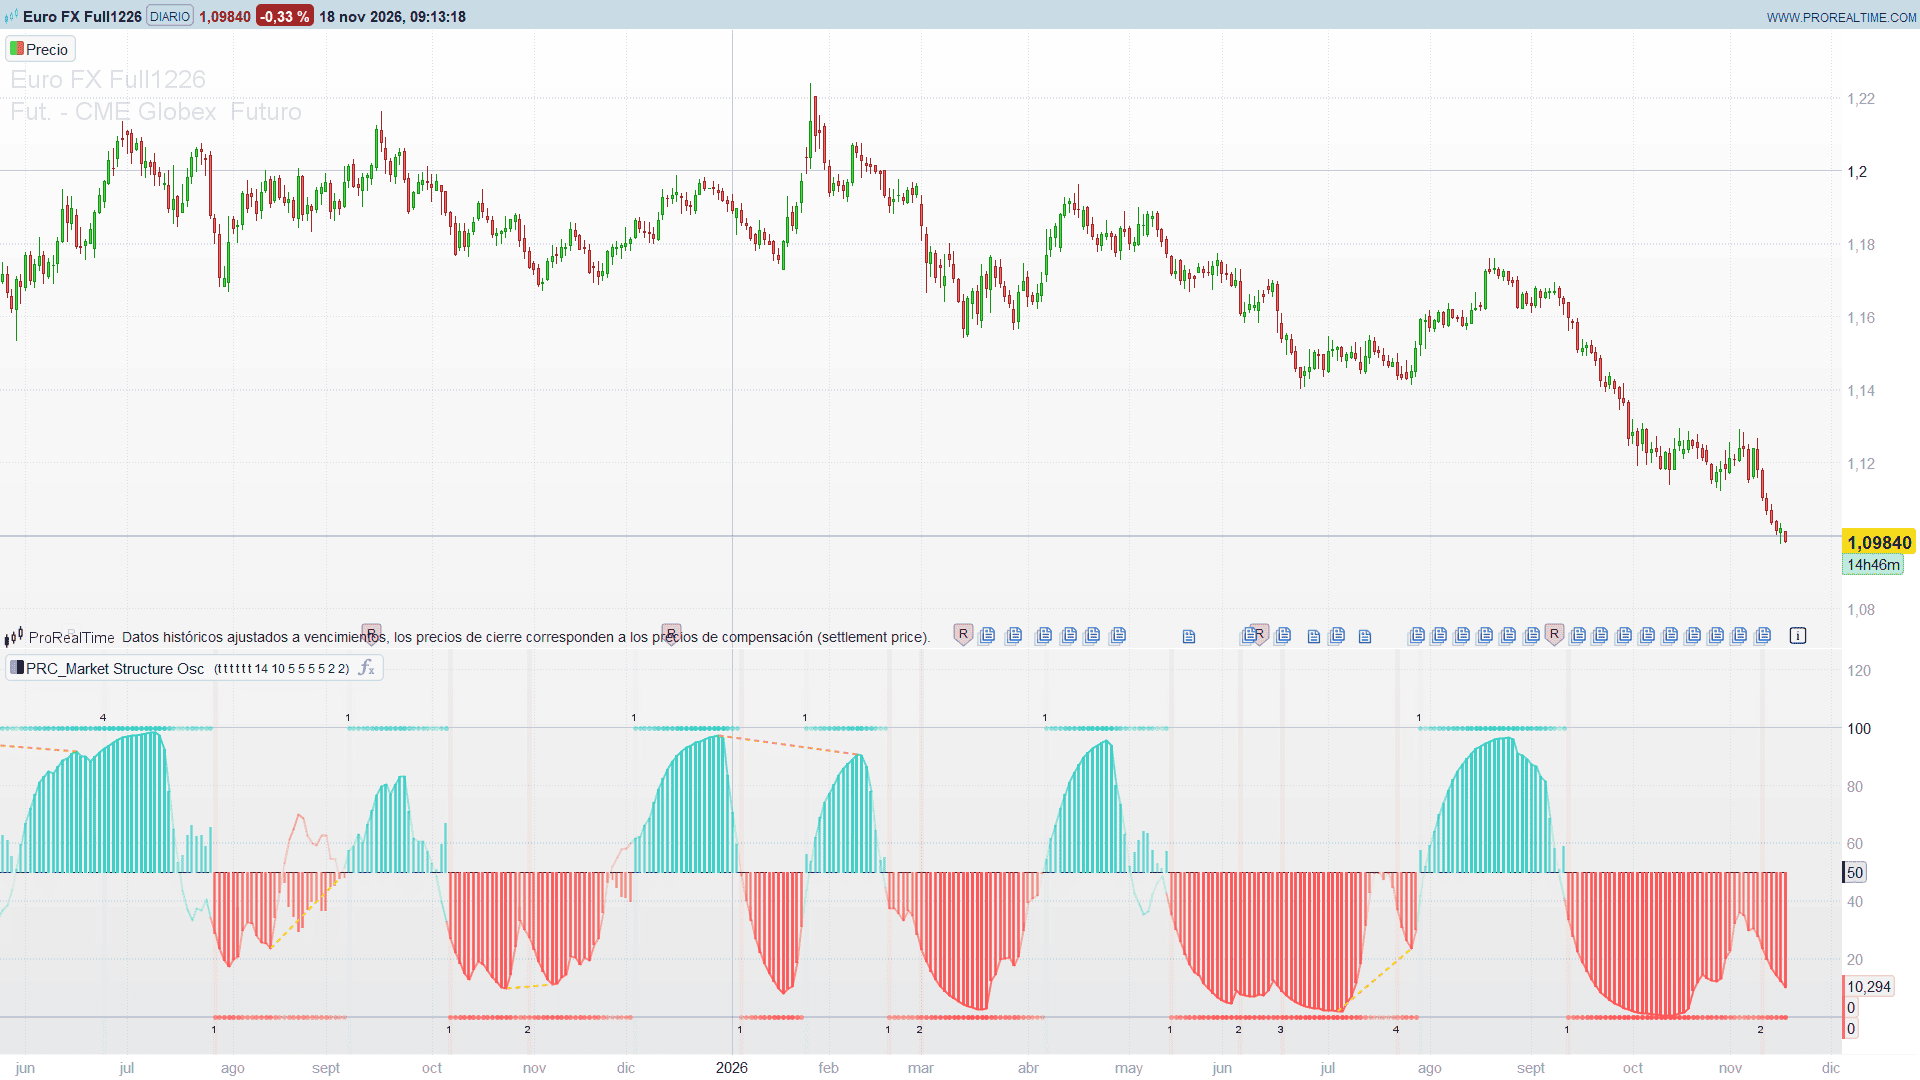
Momentum oscillators react fast but ignore structure; structure tools (higher highs, broken swings) are reliable but slow. The Market Structure Oscillator by BigBeluga puts the two together in one panel: a smooth, bounded momentum reading, and a histogram that only leans to the bullish side after the market has broken a swing high, and to the bearish side after it has broken a swing low.
On top of that it counts consecutive structure breaks, highlights each break with a background colour and draws divergences between the oscillator and price.
Theory Behind the Indicator
Momentum. The rate of change over 14 bars is divided by the standard deviation of the bar-to-bar changes over the same 14 bars. That makes the move comparable across instruments and volatility regimes: it measures how many “typical moves” price has travelled. The result goes through a sigmoid, 100 / (1 + e^-x), which squeezes it into 0-100 with 50 as neutral, and is smoothed with a 10-period EMA. This is the momentum line.
Market structure. Swing highs and lows are pivots with 5 bars on each side. When the close crosses above the latest swing high, the trend turns bullish, the count of consecutive bullish breaks goes up by one and the bearish count resets. A close below the latest swing low does the opposite. A broken swing is discarded until a new pivot forms.
Trend-filtered histogram. The distance of the momentum line from 50 is plotted above 50 in a bullish structure and below 50 in a bearish one. So the columns show how strong momentum is, but their side is decided by structure, not by momentum alone. Their opacity grows towards the extremes.
Divergences. Pivots of the momentum line (5 bars on each side) are compared with price: a higher price high with a lower oscillator high is a bearish divergence; a lower price low with a higher oscillator low is a bullish one. They are confirmed on closed bars.
Key Features at a Glance
- Volatility-normalised momentum mapped to 0-100 by a sigmoid and smoothed with an EMA.
- Histogram around 50 whose side follows the market structure.
- Count of consecutive structure breaks printed at 100 (bullish) or 0 (bearish).
- Background highlight on each structure break.
- Trend dots on the 100 or 0 bound.
- Regular divergence lines in the panel, with selectable style and width.
How to Read the Indicator
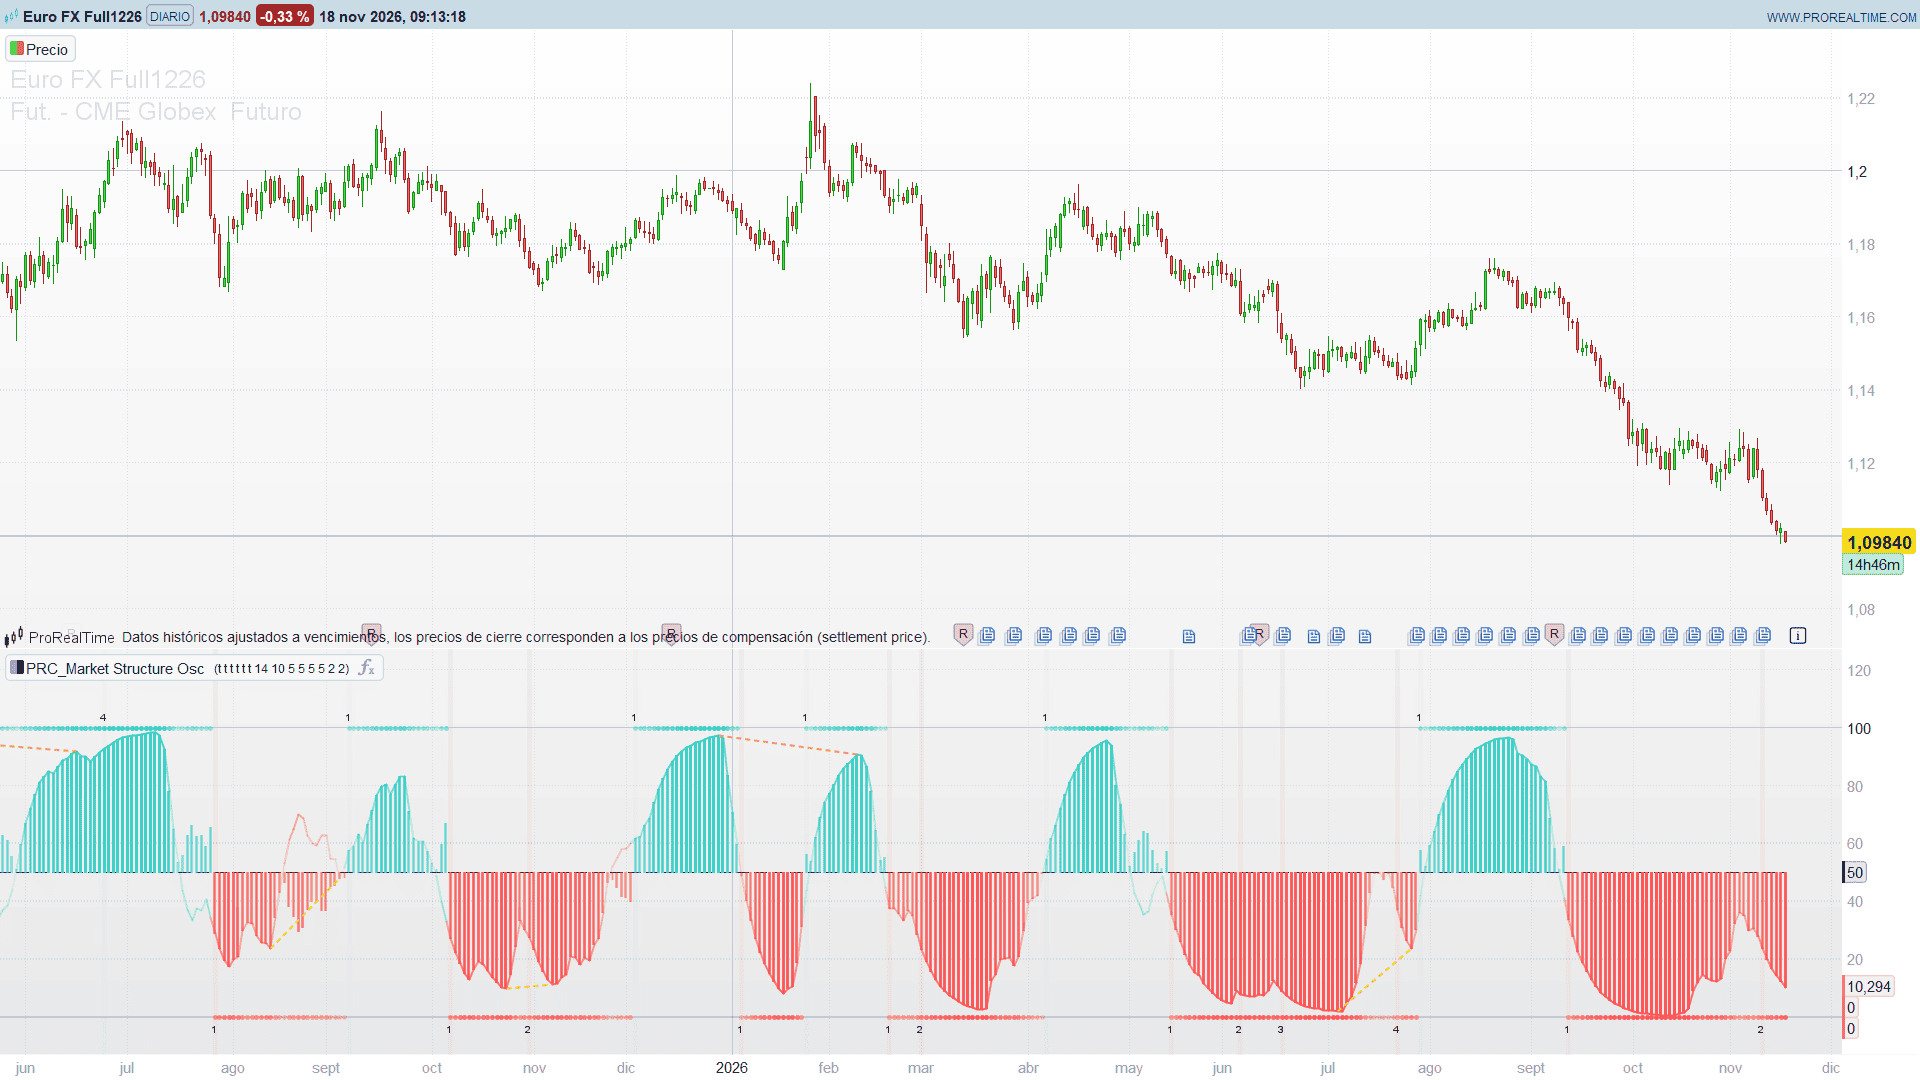
- Columns above 50: bullish structure; taller and more opaque columns mean stronger momentum in that structure.
- Columns below 50: bearish structure.
- Break count: 1 marks the first break against the previous trend, a change of character (ChoCh); 2, 3 and above are breaks of structure (BoS) that continue the trend. A long count is a mature trend.
- Momentum line against the columns: when the line drifts back towards 50 while the columns are still on the trend side, momentum is fading inside the structure.
- Orange divergence line (bearish) or gold divergence line (bullish): price made a new extreme that momentum did not confirm.
Practical Applications
- Trend filter: take long setups only while the columns are above 50, short setups only below.
- Early warning: a divergence near a high break count often comes before the next change of character.
- Pullback timing: in a bullish structure, a momentum line that dips towards 50 and turns up again marks the end of a pullback.
- Regime comparison: the volatility normalisation keeps the reading on the same scale for any instrument and timeframe.
Indicator Configuration
- showOscLabels (default 1): break count labels at 100 / 0.
- showBG (default 1): background highlight on each structure break.
- showHist (default 1): momentum histogram.
- showOscLine (default 1): smoothed momentum line.
- showDivLines (default 1): divergence lines.
- showTrendShape (default 1): trend dots on the 100 / 0 bounds.
- momLength (default 14): rate of change and volatility length.
- smoothLength (default 10): EMA smoothing length.
- msPivotLeft / msPivotRight (default 5 / 5): bars on each side of a structure pivot.
- divPivotLeft / divPivotRight (default 5 / 5): bars on each side of a divergence pivot.
- divLineStyle (default 1): 0 = solid, 1 = dashed, 2 = dotted.
- divLineWidth (default 1): 1 to 4.
The Code
//---------------------------------------------------------------
// PRC_Market Structure Osc
// version = 0
// 18.11.2026
// Iván González @ www.prorealcode.com
// Author: BigBeluga
// Sharing ProRealTime knowledge
//--------------------------------------------------------------------//

// ===================== INPUTS: VISIBILITY =====================
showOscLabels = 1      // 1 = break count labels at the 100 / 0 levels
showBG = 1             // 1 = background highlight on each structure break
showHist = 1           // 1 = momentum histogram
showOscLine = 1        // 1 = smoothed momentum line
showDivLines = 1       // 1 = divergence lines
showTrendShape = 1     // 1 = trend dots on the 100 / 0 bounds

// ===================== INPUTS: PARAMETERS =====================
momLength = 14         // momentum length (rate of change and volatility)
smoothLength = 10      // EMA smoothing length

// ===================== INPUTS: MARKET STRUCTURE =====================
msPivotLeft = 5        // structure pivot, bars on the left
msPivotRight = 5       // structure pivot, bars on the right

// ===================== INPUTS: DIVERGENCES =====================
divPivotLeft = 5       // divergence pivot, bars on the left
divPivotRight = 5      // divergence pivot, bars on the right
divLineStyle = 1       // 0 = solid, 1 = dashed, 2 = dotted
divLineWidth = 1       // 1 to 4

// ===================== COLOURS =====================
// bullish 53,207,197 / bearish 255,84,84
// bullish divergence 253,216,53 / bearish divergence 255,152,0

// ===================== MARKET STRUCTURE =====================
ONCE trendUp = 0
ONCE bullCnt = 0
ONCE bearCnt = 0
ONCE hsOk = 0
ONCE lsOk = 0
ONCE hsP = 0
ONCE lsP = 0

msHHafter = highest[msPivotRight](high)
msHHbefore = highest[msPivotLeft](high)[msPivotRight + 1]
msLLafter = lowest[msPivotRight](low)
msLLbefore = lowest[msPivotLeft](low)[msPivotRight + 1]
IF barindex >= msPivotLeft + msPivotRight THEN
   IF high[msPivotRight] > msHHafter AND high[msPivotRight] >= msHHbefore THEN
      hsP = high[msPivotRight]
      hsOk = 1
   ENDIF
   IF low[msPivotRight] < msLLafter AND low[msPivotRight] <= msLLbefore THEN
      lsP = low[msPivotRight]
      lsOk = 1
   ENDIF
ENDIF

// level as seen by the cross test of this bar (before a break clears it)
argHOk = hsOk
argHP = hsP
argLOk = lsOk
argLP = lsP

bgState = 0
crossUpMS = 0
crossDnMS = 0
IF barindex > 0 THEN
   IF argHOk = 1 AND argHOk[1] = 1 THEN
      IF close > argHP AND close[1] <= argHP[1] THEN
         crossUpMS = 1
      ENDIF
   ENDIF
   IF argLOk = 1 AND argLOk[1] = 1 THEN
      IF close < argLP AND close[1] >= argLP[1] THEN
         crossDnMS = 1
      ENDIF
   ENDIF
ENDIF

IF crossUpMS = 1 THEN
   trendUp = 1
   bullCnt = bullCnt + 1
   bearCnt = 0
   bgState = 1
   hsOk = 0
   IF showOscLabels = 1 THEN
      DRAWTEXT("#bullCnt#", barindex, 104, SansSerif, Standard, 10) COLOURED(0, 0, 0, 255)
   ENDIF
ENDIF
IF crossDnMS = 1 THEN
   trendUp = 0
   bearCnt = bearCnt + 1
   bullCnt = 0
   bgState = -1
   lsOk = 0
   IF showOscLabels = 1 THEN
      DRAWTEXT("#bearCnt#", barindex, -4, SansSerif, Standard, 10) COLOURED(0, 0, 0, 255)
   ENDIF
ENDIF

IF showBG = 1 THEN
   IF bgState = 1 THEN
      BACKGROUNDCOLOR(53, 207, 197, 13)
   ELSIF bgState = -1 THEN
      BACKGROUNDCOLOR(255, 84, 84, 13)
   ENDIF
ENDIF

// ===================== MOMENTUM =====================
chg = close - close[1]
pVol = std[momLength](chg)
IF barindex >= momLength THEN
   rocV = close - close[momLength]
   IF pVol <> 0 THEN
      rawMom = rocV / pVol
   ELSE
      rawMom = 0
   ENDIF
   sigMom = 100 / (1 + exp(0 - rawMom))
ELSE
   sigMom = 50
ENDIF

// EMA seeded with the simple average of its first smoothLength values
emaStart = momLength + smoothLength - 1
alphaE = 2 / (smoothLength + 1)
smaSig = average[smoothLength](sigMom)
oscOk = 0
IF barindex = emaStart THEN
   smOsc = smaSig
   oscOk = 1
ELSIF barindex > emaStart THEN
   smOsc = alphaE * sigMom + (1 - alphaE) * smOsc[1]
   oscOk = 1
ELSE
   smOsc = 50
ENDIF

mOff = abs(smOsc - 50)
IF trendUp = 1 THEN
   tfOsc = 50 + mOff
ELSE
   tfOsc = 50 - mOff
ENDIF

// ===================== COLOUR GRADIENTS =====================
IF tfOsc >= 50 THEN
   tG = max(0, min(1, (tfOsc - 50) / 50))
   cR = 53
   cG = 207
   cB = 197
   hA = round(255 * (0.3 + 0.7 * tG))
   lA = round(255 * (0.1 + 0.9 * tG))
ELSE
   tG = max(0, min(1, tfOsc / 50))
   cR = 255
   cG = 84
   cB = 84
   hA = round(255 * (1 - 0.7 * tG))
   lA = round(255 * (1 - 0.9 * tG))
ENDIF

// histogram columns from the 50 level
IF showHist = 1 AND oscOk = 1 THEN
   DRAWCANDLE(50, max(50, tfOsc), min(50, tfOsc), tfOsc) COLOURED(cR, cG, cB, hA) BORDERCOLOR(cR, cG, cB, hA)
ENDIF

// ===================== DIVERGENCES =====================
ONCE pOHok = 0
ONCE pOLok = 0
divStart = emaStart + divPivotLeft + divPivotRight
oHHafter = highest[divPivotRight](smOsc)
oHHbefore = highest[divPivotLeft](smOsc)[divPivotRight + 1]
oLLafter = lowest[divPivotRight](smOsc)
oLLbefore = lowest[divPivotLeft](smOsc)[divPivotRight + 1]
divBear = 0
divBull = 0
IF barindex >= divStart THEN
   IF smOsc[divPivotRight] > oHHafter AND smOsc[divPivotRight] >= oHHbefore THEN
      curOscH = smOsc[divPivotRight]
      curBarH = barindex - divPivotRight
      curPrcH = high[divPivotRight]
      IF pOHok = 1 AND curPrcH > prevPrcH AND curOscH < prevOscH THEN
         divBear = 1
         dbX1 = prevBarH
         dbY1 = prevOscH
         dbX2 = curBarH
         dbY2 = curOscH
      ENDIF
      prevOscH = curOscH
      prevBarH = curBarH
      prevPrcH = curPrcH
      pOHok = 1
   ENDIF
   IF smOsc[divPivotRight] < oLLafter AND smOsc[divPivotRight] <= oLLbefore THEN
      curOscL = smOsc[divPivotRight]
      curBarL = barindex - divPivotRight
      curPrcL = low[divPivotRight]
      IF pOLok = 1 AND curPrcL < prevPrcL AND curOscL > prevOscL THEN
         divBull = 1
         dlX1 = prevBarL
         dlY1 = prevOscL
         dlX2 = curBarL
         dlY2 = curOscL
      ENDIF
      prevOscL = curOscL
      prevBarL = curBarL
      prevPrcL = curPrcL
      pOLok = 1
   ENDIF
ENDIF

// divergences only on closed bars: drawn when the next bar opens
IF showDivLines = 1 AND barindex > 0 THEN
   FOR kD = 0 TO 1 DO
      drawD = 0
      IF kD = 0 AND divBear[1] = 1 THEN
         drawD = 1
         sX1 = dbX1[1]
         sY1 = dbY1[1]
         sX2 = dbX2[1]
         sY2 = dbY2[1]
         dR = 255
         dG = 152
         dB = 0
      ELSIF kD = 1 AND divBull[1] = 1 THEN
         drawD = 1
         sX1 = dlX1[1]
         sY1 = dlY1[1]
         sX2 = dlX2[1]
         sY2 = dlY2[1]
         dR = 230
         dG = 180
         dB = 0
      ENDIF
      IF drawD = 1 THEN
         IF divLineStyle = 0 THEN
            IF divLineWidth <= 1 THEN
               DRAWSEGMENT(sX1, sY1, sX2, sY2) COLOURED(dR, dG, dB, 255) STYLE(line, 1)
            ELSIF divLineWidth = 2 THEN
               DRAWSEGMENT(sX1, sY1, sX2, sY2) COLOURED(dR, dG, dB, 255) STYLE(line, 2)
            ELSIF divLineWidth = 3 THEN
               DRAWSEGMENT(sX1, sY1, sX2, sY2) COLOURED(dR, dG, dB, 255) STYLE(line, 3)
            ELSE
               DRAWSEGMENT(sX1, sY1, sX2, sY2) COLOURED(dR, dG, dB, 255) STYLE(line, 4)
            ENDIF
         ELSIF divLineStyle = 1 THEN
            IF divLineWidth <= 1 THEN
               DRAWSEGMENT(sX1, sY1, sX2, sY2) COLOURED(dR, dG, dB, 255) STYLE(dottedline2, 1)
            ELSIF divLineWidth = 2 THEN
               DRAWSEGMENT(sX1, sY1, sX2, sY2) COLOURED(dR, dG, dB, 255) STYLE(dottedline2, 2)
            ELSIF divLineWidth = 3 THEN
               DRAWSEGMENT(sX1, sY1, sX2, sY2) COLOURED(dR, dG, dB, 255) STYLE(dottedline2, 3)
            ELSE
               DRAWSEGMENT(sX1, sY1, sX2, sY2) COLOURED(dR, dG, dB, 255) STYLE(dottedline2, 4)
            ENDIF
         ELSE
            IF divLineWidth <= 1 THEN
               DRAWSEGMENT(sX1, sY1, sX2, sY2) COLOURED(dR, dG, dB, 255) STYLE(dottedline, 1)
            ELSIF divLineWidth = 2 THEN
               DRAWSEGMENT(sX1, sY1, sX2, sY2) COLOURED(dR, dG, dB, 255) STYLE(dottedline, 2)
            ELSIF divLineWidth = 3 THEN
               DRAWSEGMENT(sX1, sY1, sX2, sY2) COLOURED(dR, dG, dB, 255) STYLE(dottedline, 3)
            ELSE
               DRAWSEGMENT(sX1, sY1, sX2, sY2) COLOURED(dR, dG, dB, 255) STYLE(dottedline, 4)
            ENDIF
         ENDIF
      ENDIF
   NEXT
ENDIF

// ===================== PLOTS =====================
// momentum line: gradient alpha, invisible while the EMA warms up
IF showOscLine = 1 AND oscOk = 1 THEN
   lineA = lA
ELSE
   lineA = 0
ENDIF
// trend dots: 100 in an uptrend, 0 in a downtrend
IF trendUp = 1 THEN
   dotV = 100
ELSE
   dotV = 0
ENDIF
IF showTrendShape = 1 AND oscOk = 1 THEN
   dotA = hA
ELSE
   dotA = 0
ENDIF

RETURN 50 COLOURED(0, 0, 0, 255) STYLE(dottedline2, 1) AS "Center Line", smOsc COLOURED(cR, cG, cB, lineA) STYLE(line, 2) AS "Smoothed Momentum Line", dotV COLOURED(cR, cG, cB, dotA) STYLE(point, 2) AS "Market Structure Trend"