Synthetic Oscillator: John Ehlers' Whipsaw-Free Cycle Oscillator
Introduction
Classic oscillators such as RSI or Stochastic are built from price differences, so every bit of noise in the price shows up in the oscillator as a small wiggle. Those wiggles are what produce whipsaw trades: the line crosses a threshold, turns back, and crosses again a few bars later.
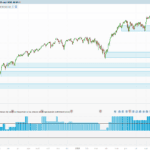
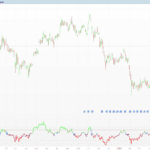
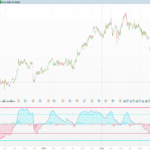
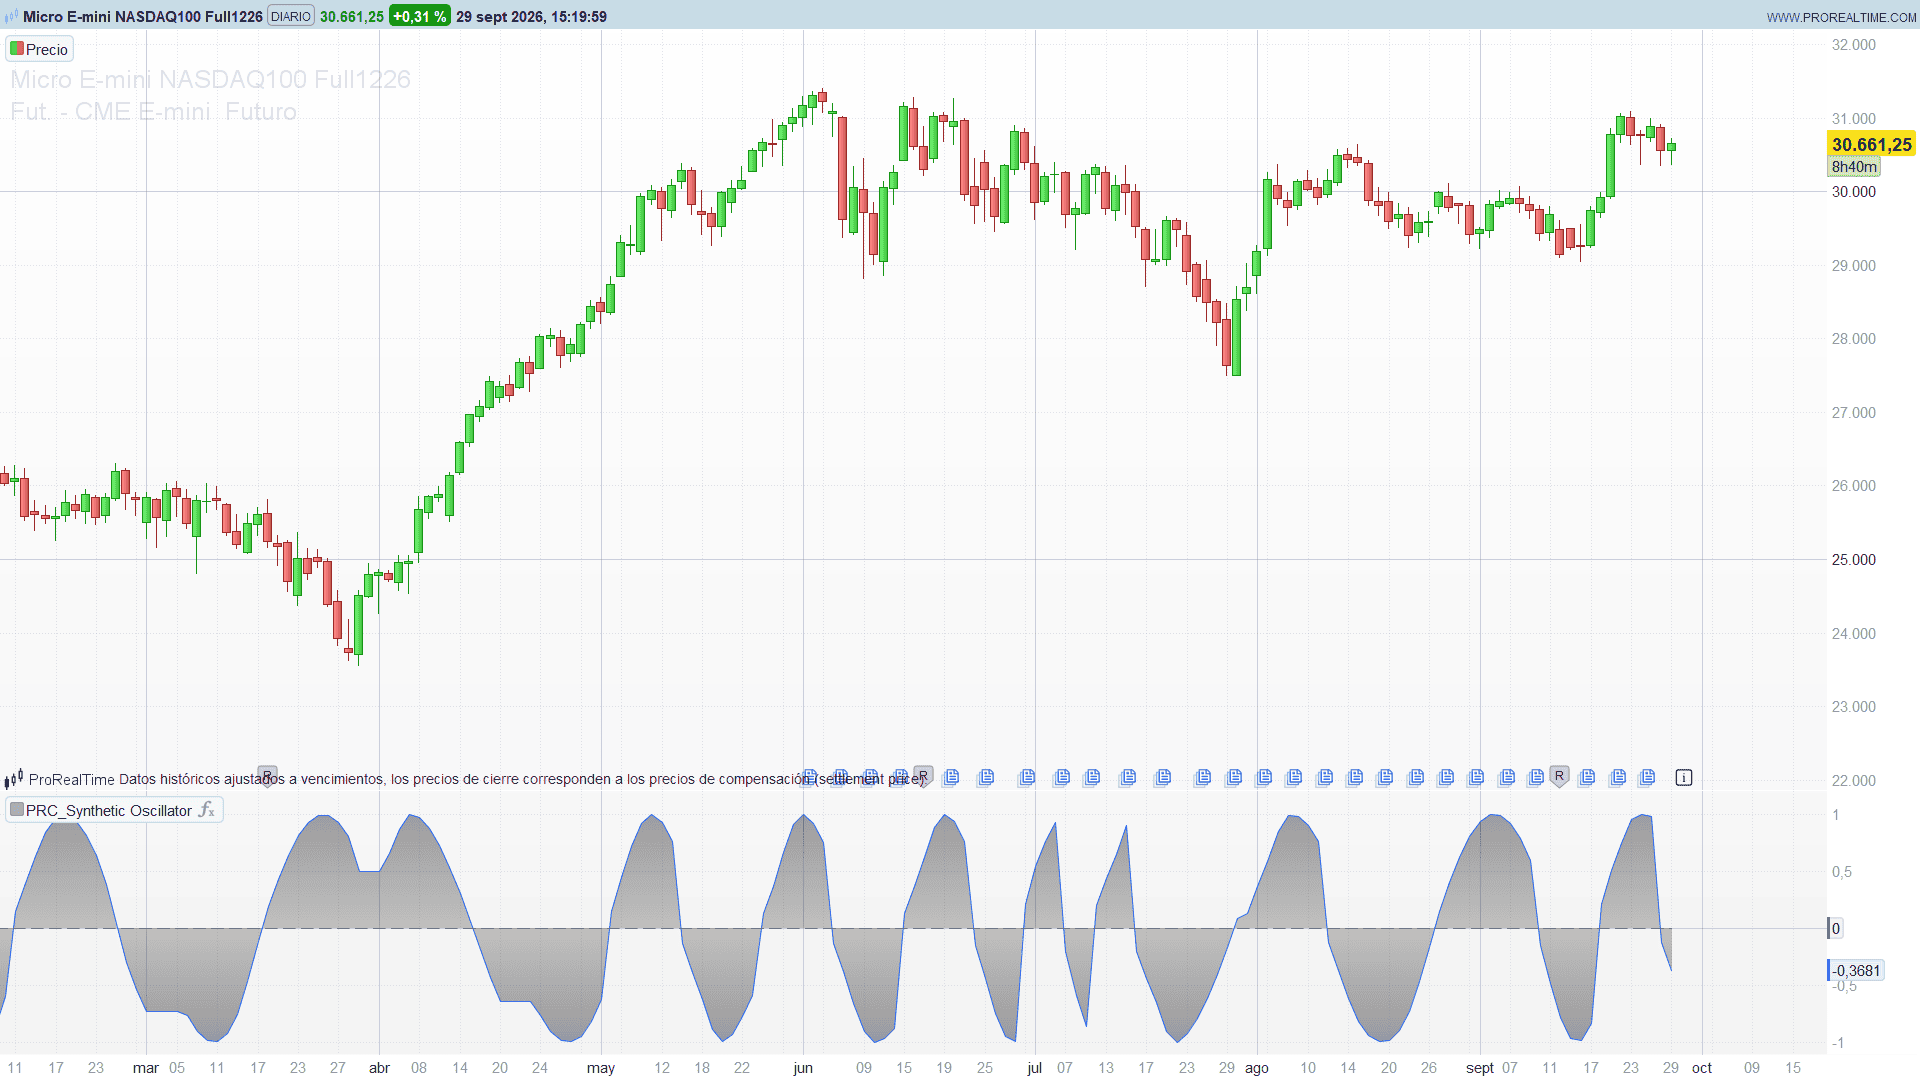
The Synthetic Oscillator, presented by John F. Ehlers in the April 2026 issue of Technical Analysis of Stocks & Commodities (“Avoiding Whipsaw Trades”), takes a different route. Instead of filtering the price and hoping the noise goes away, it measures the market cycle and then synthesizes a clean sine wave that is kept in phase with it. The result is a smooth oscillator between -1 and +1 with no noise of its own.
Theory Behind the Indicator
1. Measuring the dominant cycle
The price is first smoothed with a 12-bar Hann window. A band-pass filter (Ehlers’ high-pass filter at the upper bound followed by a SuperSmoother at the lower bound) keeps only the swings between the two bounds. Normalized by its root mean square over 100 bars, this is the real component of the cycle.
Its bar-to-bar rate of change, normalized the same way, is the imaginary component. Together they form a rotating phasor, and the speed at which that phasor turns gives the dominant cycle period. The measured period is limited to the range between the lower and upper bounds.
2. Building the synthetic wave
On every bar the indicator advances a phase angle by 360 degrees divided by the dominant cycle. The sine of that cumulative phase is the oscillator: if the cycle is 20 bars, the sine completes one full wave in 20 bars.
3. Staying in phase with the market
A synthetic wave on its own would drift away from the market. To keep it anchored, a second band-pass filter is tuned to the average period of the range (the geometric mean of the two bounds). When it crosses above zero the phase is reset to 0 degrees, and when it crosses below zero it is reset to 180 degrees. A final rule removes the small glitch a reset can cause: if the wave would step backwards inside the same quadrant, the previous value is kept.
Key Features at a Glance
- A pure sine wave between -1 and +1, free of the noise that causes whipsaws in classic oscillators
- Speed of the wave driven by the dominant cycle measured on every bar
- Phase re-anchored to the market at each zero crossing of a band-pass filter
- Only two settings: the shortest and the longest cycle you want to follow
- Works on any instrument and timeframe
How to Read the Indicator
- Peaks and troughs. The top of the wave marks the expected top of the current cycle and the bottom marks the expected low. Because the line has no noise, a turn is a turn: there are no false wiggles near the extremes.
- Zero crossings. A cross above zero marks the start of the rising half of the cycle and a cross below zero the start of the falling half. These are the points where the phase is re-anchored to the market.
- Wave speed. A wave that completes quickly shows a short dominant cycle; a slow, stretched wave shows the market is swinging at the long end of the range.
Practical Applications
- Swing timing. Use the troughs of the wave to time entries in the direction of the larger trend and the peaks to take profits or tighten stops.
- Replacing a noisy oscillator. Where a strategy uses RSI or Stochastic crossings, the Synthetic Oscillator crossing zero or its own extremes gives the same kind of timing with far fewer false signals.
- Adapting the range. Narrow the bounds to follow short swings on intraday charts, or widen them to follow longer cycles on daily charts.
Indicator Configuration
lowerBound(default: 15, minimum 3): shortest cycle period, in bars, the indicator will follow.upperBound(default: 25, minimum 4): longest cycle period, in bars. It must be greater thanlowerBound; otherwise nothing is plotted.- Price source: selectable in the indicator settings (close by default).
Apply the indicator in its own panel below the price chart.
Code
//---------------------------------------------------------------
// PRC_Synthetic Oscillator
// version = 0
// 29.09.2026
// Iván González @ www.prorealcode.com
// Author: John F. Ehlers
// Sharing ProRealTime knowledge
//--------------------------------------------------------------------//
// Apply it in its own panel (not on the price).


//----- Inputs
lowerBound = 15        // shortest cycle period allowed (min 3)
upperBound = 25        // longest cycle period allowed (must be greater than lowerBound)
src = customclose


lowerBound = max(3, round(lowerBound))
upperBound = max(4, round(upperBound))
piV = 3.14159265358979


//----- Hann window smoothing of the price (12 bars)
filtH = 0
coefH = 0
FOR cH = 1 TO 12 DO
   pH = cos(360 * cH / 13)
   IF barindex >= cH - 1 THEN
      filtH = filtH + (1 - pH) * src[cH - 1]
   ENDIF
   coefH = coefH + 1 - pH
NEXT
priceH = filtH / coefH


//----- Real component: band-pass (high-pass at upperBound + SuperSmoother at lowerBound)
// ProBuilder trigonometry works in degrees: 1.414*pi/P radians = 1.414*180/P degrees
qA = exp(0 - 1.414 * piV / upperBound)
c1A = 2 * qA * cos(1.414 * 180 / upperBound)
c2A = qA * qA
a0A = (1 + c1A + c2A) / 4
IF barindex >= 4 THEN
   hpA = a0A * (priceH - 2 * priceH[1] + priceH[2]) + c1A * hpA[1] - c2A * hpA[2]
ELSE
   hpA = 0
ENDIF


qS = exp(0 - 1.414 * piV / lowerBound)
c1S = 2 * qS * cos(1.414 * 180 / lowerBound)
c2S = qS * qS
a0S = (1 - c1S + c2S) / 2
IF barindex >= 4 THEN
   lpS = a0S * (hpA + hpA[1]) + c1S * lpS[1] - c2S * lpS[2]
ELSE
   lpS = hpA
ENDIF


// normalized by its RMS over 100 bars
s2 = summation[100](lpS * lpS)
reV = 0
IF barindex >= 99 AND s2 <> 0 THEN
   reV = lpS / sqrt(s2 / 100)
ENDIF


//----- Imaginary component: rate of change of the real one, normalized
rocV = 0
IF barindex >= 1 THEN
   rocV = reV - reV[1]
ENDIF
q2 = summation[100](rocV * rocV)
imV = 0
IF barindex >= 100 AND q2 <> 0 THEN
   imV = rocV / sqrt(q2 / 100)
ENDIF


//----- Dominant cycle: rate of change of the phase (arctangent), limited to the bounds
denom = 0
IF barindex >= 1 THEN
   denom = rocV * imV - (imV - imV[1]) * reV
ENDIF
domCycle = 0
IF denom <> 0 THEN
   domCycle = 6.28 * (reV * reV + imV * imV) / denom
ENDIF
domCycle = max(lowerBound, min(upperBound, domCycle))


//----- Band-pass at the average cycle period (high-pass + UltimateSmoother)
midP = floor(sqrt(lowerBound * upperBound))
qB = exp(0 - 1.414 * piV / midP)
c1B = 2 * qB * cos(1.414 * 180 / midP)
c2B = qB * qB
a0B = (1 + c1B + c2B) / 4
IF barindex >= 4 THEN
   hpB = a0B * (src - 2 * src[1] + src[2]) + c1B * hpB[1] - c2B * hpB[2]
ELSE
   hpB = 0
ENDIF
IF barindex >= 4 THEN
   bpV = (1 - a0B) * hpB + (2 * a0B - c1B) * hpB[1] + (c2B - a0B) * hpB[2] + c1B * bpV[1] - c2B * bpV[2]
ELSE
   bpV = hpB
ENDIF


//----- Cumulative phase, reset to 0 / 180 degrees when the band-pass crosses zero
once phAcc = 0
phAcc = phAcc + 2 * piV / domCycle
IF bpV CROSSES OVER 0 THEN
   phAcc = piV / domCycle
ELSIF bpV CROSSES UNDER 0 THEN
   phAcc = piV + piV / domCycle
ENDIF


//----- Synthetic Oscillator: sine of the cumulative phase
soV = sin(phAcc * 180 / piV)
// remove the reset glitch when the continuity falls in the same quadrant
IF phAcc > 0 AND phAcc < piV / 2 AND soV < soV[1] THEN
   soV = soV[1]
ELSIF phAcc > piV AND phAcc < 3 * piV / 2 AND soV > soV[1] THEN
   soV = soV[1]
ENDIF


// the upper bound must be greater than the lower bound: nothing is plotted otherwise
outSO = soV
IF lowerBound >= upperBound THEN
   outSO = undefined
ENDIF


RETURN outSO COLOURED(41, 98, 255) AS "Synthetic Oscillator", 0 COLOURED(120, 123, 134) STYLE(dottedline2) AS "Zero Line"
Conclusion
The Synthetic Oscillator does not try to clean up a noisy oscillator: it builds a noiseless one from the measured cycle and keeps it in phase with the market. That makes it a simple and readable tool for timing swings without the whipsaws of traditional oscillators.