

Multiple Divergences — A Confluence Counter Across Ten Oscillators
Most divergence tools watch a single oscillator. The Multiple Divergences indicator, originally published by Peter_O on TradingView, takes a different angle: it scans ten oscillators at once and, at every price pivot, counts how many of them are diverging from price simultaneously. Instead of asking “is the RSI diverging?”, it answers the more useful question: “how many independent momentum measures agree that this swing is losing steam?”
That single number is the whole point. One isolated divergence is noise more often than not; five oscillators diverging on the same pivot is a confluence worth respecting. The indicator detects all four divergence types — regular and hidden, bullish and bearish — and it is non-repaint: every label is printed on a pivot that has already closed, so signals never move once drawn.
Theory Behind the Indicator
The ten oscillators
The indicator evaluates divergences on ten different momentum and volume measures:
 | RSI | `RSI(14)` |
| 2 | MACD line | `EMA(12) − EMA(26)` |
| 3 | MACD histogram | `MACD line − EMA(9) of MACD line` |
| 4 | Momentum | `close − close[10]` |
| 5 | CCI | CCI(10) on close |
| 6 | OBV | On-Balance Volume |
| 7 | Stochastic | `SMA(3)` of the raw %K(14) |
| 8 | DI oscillator | `100 · Wilder(ΔHigh+ΔLow) / Wilder(TR)` |
| 9 | VWMACD | Volume-weighted `MACD` (VWMA12 − VWMA26) |
| 10 | Chaikin Money Flow | CMF(21) |
In the ProRealTime version several of these are written out explicitly (rather than relying on a built-in) so that the source and the result match the original TradingView calculation exactly, and so that every oscillator can be toggled on or off individually.
The four divergence types
A divergence compares the last two pivots of price against the last two pivots of the oscillator:
| Type | Price | Oscillator | Meaning |
|---|---|---|---|
| **Regular bullish** ▲ | Lower Low | Higher Low | possible bullish reversal |
| **Regular bearish** ▼ | Higher High | Lower High | possible bearish reversal |
| **Hidden bullish** △ | Higher Low | Lower Low | bullish trend continuation |
| **Hidden bearish** ▽ | Lower High | Higher High | bearish trend continuation |
Regular divergences are reversal signals; hidden divergences are continuation signals. They are not interchangeable — a hidden bullish divergence in an uptrend says “the pullback is exhausted, the trend resumes”, which is the opposite read of a regular divergence.
Pivot detection
Pivots are detected with an asymmetric lookback: lbL bars to the left (search window) and lbR bars to the right (confirmation). A low pivot on an oscillator o is confirmed lbR bars after it forms:
o > o[lbR] and lowest[lbR](o) > o[lbR] and o[lbR] < lowest[lbL](o)[lbR+1]
For every oscillator the indicator keeps the value of the current and previous pivot, together with the price and the bar index at those pivots. That is enough to evaluate the four divergence conditions without storing arrays. A pivot pair is only considered if the two pivots are between minbars and maxbars apart, which discards divergences drawn across windows that are too wide to be meaningful.
The confluence counter
Each oscillator contributes a 1 or a 0 to four counters (regular bull, regular bear, hidden bull, hidden bear). Summing those booleans gives, for each pivot, the number of oscillators in agreement:
posdivergence = (bull1)+(bull2)+ ... +(bull10)
If that number reaches mindivcount, the indicator prints the arrow for that divergence type plus the count, stacked on the pivot candle.
Key Features at a Glance
| Feature | Behaviour |
|---|---|
| Oscillators | 10, each individually switchable |
| Divergence types | 4 (regular/hidden × bull/bear) |
| Output | Arrow + number of confluent oscillators on each pivot |
| Filter | `mindivcount` minimum confluence to display |
| Pivots | Asymmetric `lbL` / `lbR`, distance bounded by `minbars` / `maxbars` |
| Repaint | None — confirmed on a closed pivot (`lbR ≥ 1`) |
| Overlay | Yes, drawn on the price chart |
How to Read the Indicator
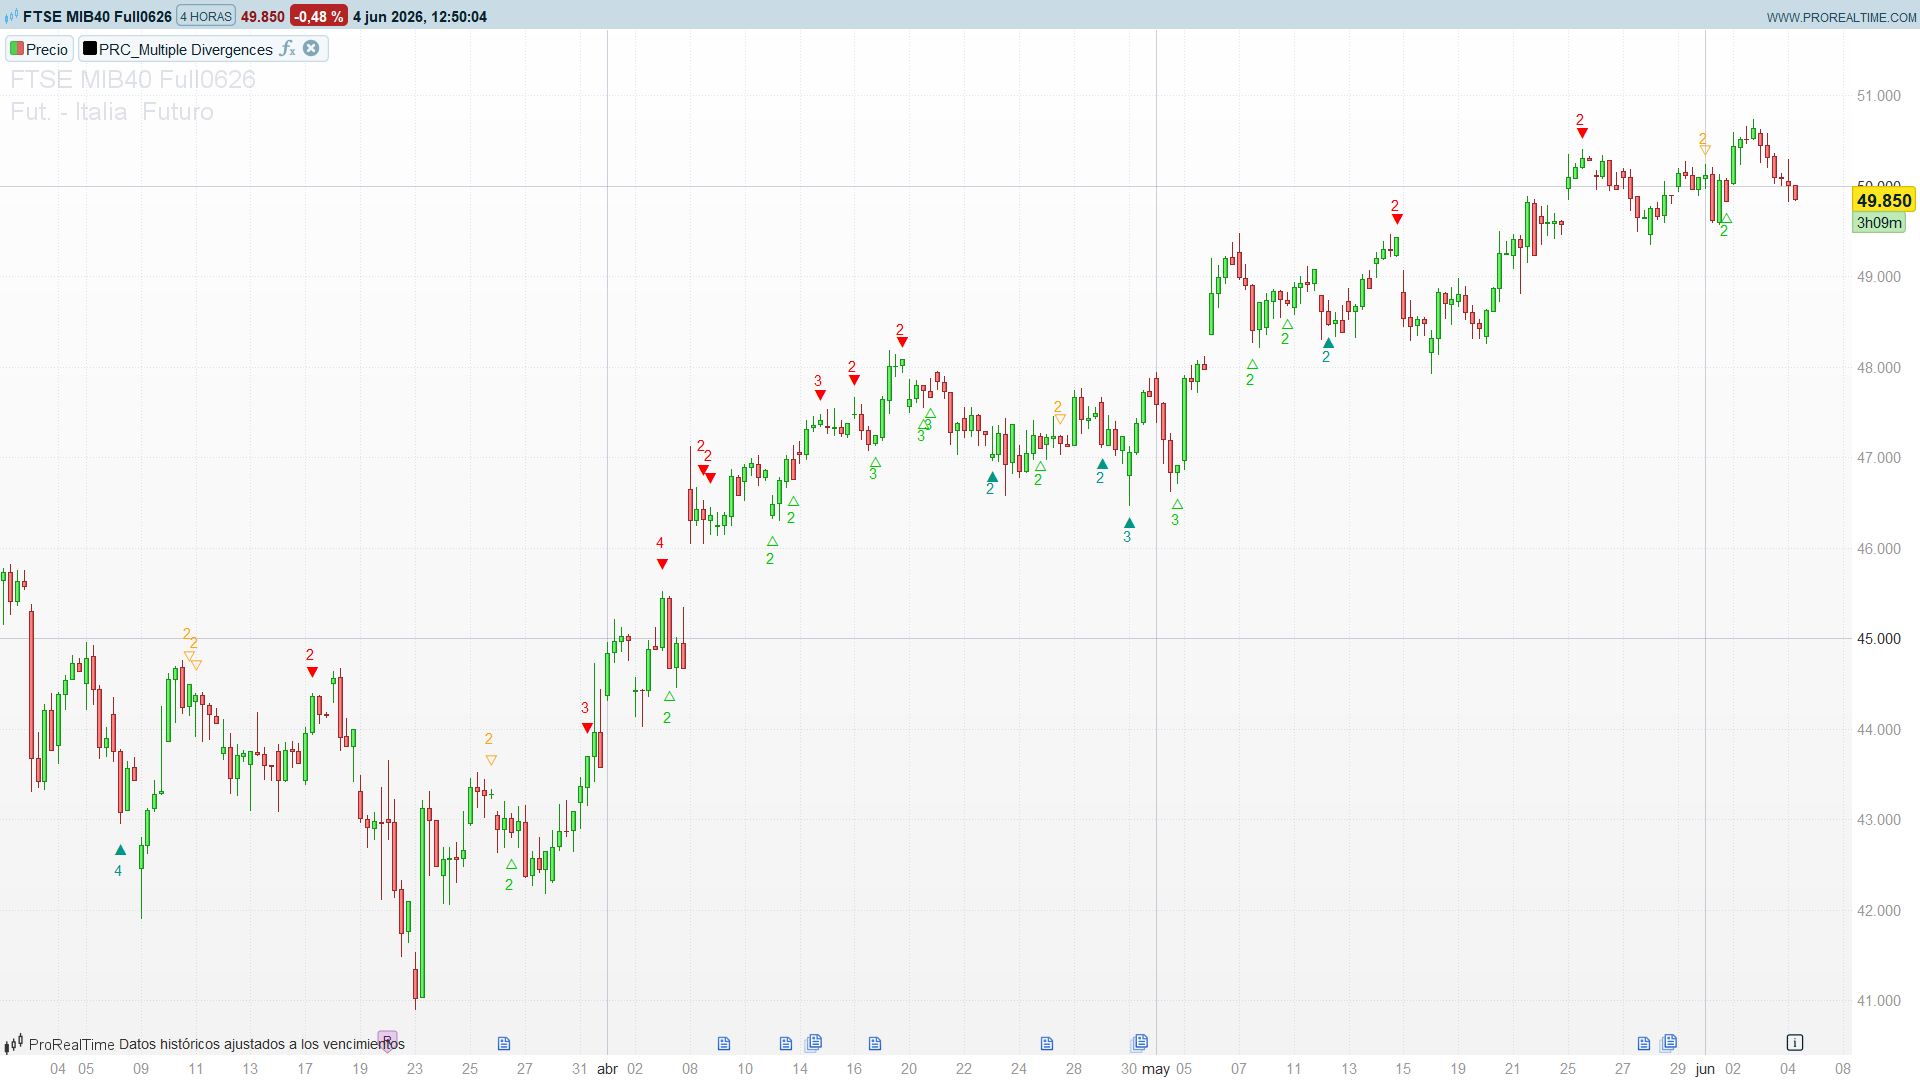
- The number is the signal strength. A
▲5means five oscillators are showing a regular bullish divergence on the same pivot — far more compelling than a single one. Read the number, not just the arrow. mindivcountis your noise filter. Raise it (3, 4, 5…) to keep only the strongest confluences; lower it to see every divergence.- Arrows point to the pivot. Bullish arrows (
▲regular,△hidden) print below the pivot low; bearish arrows (▼,▽) above the pivot high. - Regular vs hidden. Teal/red arrows are reversal warnings; green/orange arrows are continuation signals in the direction of the trend.
- Non-repaint means patience. The label appears
lbRbars after the actual extreme, because the pivot must close first. That delay is the price of a signal that never repaints.
Practical Applications
- Reversal confluence. Wait for a high regular-divergence count (e.g.
mindivcount = 4) at a support/resistance level or a round number before fading a move. Multi-oscillator agreement filters out the single-oscillator false positives. - Trend-continuation entries. In a clear trend, use hidden divergences (
△/▽) on pullbacks as continuation triggers — they tend to be more reliable than regular divergences while a trend is intact. - Tune the oscillator set. Volume-based measures (OBV, CMF, VWMACD) only make sense on instruments with reliable volume. On FX or CFDs, switch them off (
calcobv = 0, etc.) and the counter rescales automatically. - Combine with structure. Divergences are timing tools, not stand-alone systems. They work best confirming a level, a trendline break or a higher-timeframe bias.
- Screener candidate. Because the output is a simple integer per bar, “at least N confluent divergences” translates directly into a ProScreener filter.
Indicator Configuration
| Parameter | Default | Description |
|---|---|---|
| `mindivcount` | 2 | Minimum number of confluent divergences to display a label |
| `lbR` | 1 | Pivot lookback right (confirmation bars) |
| `lbL` | 3 | Pivot lookback left (search bars) |
| `minbars` | 1 | Minimum distance in bars between the two pivots |
| `maxbars` | 60 | Maximum distance in bars between the two pivots |
| `plotBull` / `plotHiddenBull` | 1 | Show regular / hidden bullish divergences |
| `plotBear` / `plotHiddenBear` | 1 | Show regular / hidden bearish divergences |
| `calcrsi … calccmf` | 1 | Enable/disable each of the ten oscillators |
Code
//-------------------------------------------------------------------------------//
//PRC_Multiple Divergences
//version = 0
//04.06.26
//Ivan Gonzalez @ www.prorealcode.com
//Sharing ProRealTime knowledge
//Original: "Multiple divergences rework NON-REPAINT" by Peter_O (TradingView)
//-------------------------------------------------------------------------------//
//Indicador OVERLAY (aplicar sobre el precio).
//Cuenta cuantos de los 10 osciladores divergen a la vez en cada pivote y
//dibuja el numero. 4 tipos: Regular/Hidden x Bull/Bear.
//-------------------------------------------------------------------------------//
//-----Inputs--------------------------------------------------------------------//
mindivcount = 2    //minimo de divergencias confluentes para mostrar la etiqueta
lbR = 1            //pivot lookback right (barras de confirmacion)
lbL = 3            //pivot lookback left (barras de busqueda)
minbars = 1        //rangeLower: distancia minima en barras entre pivotes
maxbars = 60       //rangeUpper: distancia maxima en barras entre pivotes
plotBull = 1       //mostrar divergencias regular alcistas
plotHiddenBull = 1 //mostrar divergencias hidden alcistas
plotBear = 1       //mostrar divergencias regular bajistas
plotHiddenBear = 1 //mostrar divergencias hidden bajistas
//-----Osciladores ON/OFF (1=activo, 0=inactivo)
calcrsi = 1
calcmacd = 1
calcmacdh = 1
calcmom = 1
calccci = 1
calcobv = 1
calcstoc = 1
calcdi = 1
calcvwmacd = 1
calccmf = 1
//-------------------------------------------------------------------------------//
//-----Calculo de los 10 osciladores como series---------------------------------//
//Se calculan manualmente los osciladores cuyo nativo PRT es ambiguo (nombre o
//fuente) para garantizar compilacion y fidelidad exacta al original de TradingView.
o1 = rsi[14](close)                                       //RSI (nativo)
//-----MACD line + histograma (EMA12 - EMA26)
//OJO: "macdline" es palabra reservada en PRT -> se usa "mymacdline"
mymacdline = exponentialaverage[12](close) - exponentialaverage[26](close)
o2 = mymacdline                                             //MACD line
o3 = mymacdline - exponentialaverage[9](mymacdline)           //MACD histograma
o4 = close - close[10]                                    //Momentum
//-----CCI sobre close (fiel a cci(close,10))
ccisma = average[10](close)
ccimd = average[10](abs(close - ccisma))
if ccimd > 0 then
   o5 = (close - ccisma) / (0.015*ccimd)
else
   o5 = 0
endif
//-----OBV (acumulado manual)
if close > close[1] then
   obval = obval[1] + volume
elsif close < close[1] then
   obval = obval[1] - volume
else
   obval = obval[1]
endif
o6 = obval                                                //OBV
//-----Stochastic %K suavizado 3 (manual)
lowest14 = lowest[14](low)
highest14 = highest[14](high)
if highest14 > lowest14 then
   stochk = 100 * (close - lowest14) / (highest14 - lowest14)
else
   stochk = 0
endif
o7 = average[3](stochk)                                   //Stochastic
//-----DI oscillator (custom Peter_O)
diVal = (high - high[1]) + (low - low[1])
truerange = max(high, close[1]) - min(low, close[1])
trur = average[14,3](truerange)
if trur > 0 then
   o8 = 100 * average[14,3](diVal) / trur
else
   o8 = 0
endif
//-----VWMACD (VWMA 12 - VWMA 26, ver learning 011)
volSum12 = summation[12](volume)
volSum26 = summation[26](volume)
if volSum12 > 0 then
   vw12 = summation[12](close*volume) / volSum12
else
   vw12 = close
endif
if volSum26 > 0 then
   vw26 = summation[26](close*volume) / volSum26
else
   vw26 = close
endif
o9 = vw12 - vw26                                          //VWMACD
//-----Chaikin Money Flow
if high > low then
   cmfm = ((close-low) - (high-close)) / (high-low)
else
   cmfm = 0
endif
cmfv = cmfm * volume
volSum21 = summation[21](volume)
if volSum21 > 0 then
   o10 = summation[21](cmfv) / volSum21
else
   o10 = 0
endif
//-------------------------------------------------------------------------------//
//-----Bloque de divergencias por oscilador--------------------------------------//
//Para cada oscilador se mantiene el ultimo pivote (c=current) y el anterior
//(p=prev) tanto del oscilador (oL/oH) como del precio (pL/pH) y su barindex
//(bL/bH). Emula el valuewhen(...,1) del original sin arrays.

//----- o1 RSI
plf1 = o1 > o1[lbR] and lowest[lbR](o1) > o1[lbR] and o1[lbR] < lowest[lbL](o1)[lbR+1]
if plf1 then
   oLp1 = oLc1
   pLp1 = pLc1
   bLp1 = bLc1
   oLc1 = o1[lbR]
   pLc1 = low[lbR]
   bLc1 = barindex[lbR]
endif
phf1 = o1 < o1[lbR] and highest[lbR](o1) < o1[lbR] and o1[lbR] > highest[lbL](o1)[lbR+1]
if phf1 then
   oHp1 = oHc1
   pHp1 = pHc1
   bHp1 = bHc1
   oHc1 = o1[lbR]
   pHc1 = high[lbR]
   bHc1 = barindex[lbR]
endif
inRL1 = bLp1 > 0 and (bLc1-bLp1) >= minbars and (bLc1-bLp1) <= maxbars
inRH1 = bHp1 > 0 and (bHc1-bHp1) >= minbars and (bHc1-bHp1) <= maxbars
bull1  = calcrsi and plotBull and plf1 and pLc1 < pLp1 and oLc1 > oLp1 and inRL1
hbull1 = calcrsi and plotHiddenBull and plf1 and pLc1 > pLp1 and oLc1 < oLp1 and inRL1
bear1  = calcrsi and plotBear and phf1 and pHc1 > pHp1 and oHc1 < oHp1 and inRH1
hbear1 = calcrsi and plotHiddenBear and phf1 and pHc1 < pHp1 and oHc1 > oHp1 and inRH1

//----- o2 MACD line
plf2 = o2 > o2[lbR] and lowest[lbR](o2) > o2[lbR] and o2[lbR] < lowest[lbL](o2)[lbR+1]
if plf2 then
   oLp2 = oLc2
   pLp2 = pLc2
   bLp2 = bLc2
   oLc2 = o2[lbR]
   pLc2 = low[lbR]
   bLc2 = barindex[lbR]
endif
phf2 = o2 < o2[lbR] and highest[lbR](o2) < o2[lbR] and o2[lbR] > highest[lbL](o2)[lbR+1]
if phf2 then
   oHp2 = oHc2
   pHp2 = pHc2
   bHp2 = bHc2
   oHc2 = o2[lbR]
   pHc2 = high[lbR]
   bHc2 = barindex[lbR]
endif
inRL2 = bLp2 > 0 and (bLc2-bLp2) >= minbars and (bLc2-bLp2) <= maxbars
inRH2 = bHp2 > 0 and (bHc2-bHp2) >= minbars and (bHc2-bHp2) <= maxbars
bull2  = calcmacd and plotBull and plf2 and pLc2 < pLp2 and oLc2 > oLp2 and inRL2
hbull2 = calcmacd and plotHiddenBull and plf2 and pLc2 > pLp2 and oLc2 < oLp2 and inRL2
bear2  = calcmacd and plotBear and phf2 and pHc2 > pHp2 and oHc2 < oHp2 and inRH2
hbear2 = calcmacd and plotHiddenBear and phf2 and pHc2 < pHp2 and oHc2 > oHp2 and inRH2

//----- o3 MACD histograma
plf3 = o3 > o3[lbR] and lowest[lbR](o3) > o3[lbR] and o3[lbR] < lowest[lbL](o3)[lbR+1]
if plf3 then
   oLp3 = oLc3
   pLp3 = pLc3
   bLp3 = bLc3
   oLc3 = o3[lbR]
   pLc3 = low[lbR]
   bLc3 = barindex[lbR]
endif
phf3 = o3 < o3[lbR] and highest[lbR](o3) < o3[lbR] and o3[lbR] > highest[lbL](o3)[lbR+1]
if phf3 then
   oHp3 = oHc3
   pHp3 = pHc3
   bHp3 = bHc3
   oHc3 = o3[lbR]
   pHc3 = high[lbR]
   bHc3 = barindex[lbR]
endif
inRL3 = bLp3 > 0 and (bLc3-bLp3) >= minbars and (bLc3-bLp3) <= maxbars
inRH3 = bHp3 > 0 and (bHc3-bHp3) >= minbars and (bHc3-bHp3) <= maxbars
bull3  = calcmacdh and plotBull and plf3 and pLc3 < pLp3 and oLc3 > oLp3 and inRL3
hbull3 = calcmacdh and plotHiddenBull and plf3 and pLc3 > pLp3 and oLc3 < oLp3 and inRL3
bear3  = calcmacdh and plotBear and phf3 and pHc3 > pHp3 and oHc3 < oHp3 and inRH3
hbear3 = calcmacdh and plotHiddenBear and phf3 and pHc3 < pHp3 and oHc3 > oHp3 and inRH3

//----- o4 Momentum
plf4 = o4 > o4[lbR] and lowest[lbR](o4) > o4[lbR] and o4[lbR] < lowest[lbL](o4)[lbR+1]
if plf4 then
   oLp4 = oLc4
   pLp4 = pLc4
   bLp4 = bLc4
   oLc4 = o4[lbR]
   pLc4 = low[lbR]
   bLc4 = barindex[lbR]
endif
phf4 = o4 < o4[lbR] and highest[lbR](o4) < o4[lbR] and o4[lbR] > highest[lbL](o4)[lbR+1]
if phf4 then
   oHp4 = oHc4
   pHp4 = pHc4
   bHp4 = bHc4
   oHc4 = o4[lbR]
   pHc4 = high[lbR]
   bHc4 = barindex[lbR]
endif
inRL4 = bLp4 > 0 and (bLc4-bLp4) >= minbars and (bLc4-bLp4) <= maxbars
inRH4 = bHp4 > 0 and (bHc4-bHp4) >= minbars and (bHc4-bHp4) <= maxbars
bull4  = calcmom and plotBull and plf4 and pLc4 < pLp4 and oLc4 > oLp4 and inRL4
hbull4 = calcmom and plotHiddenBull and plf4 and pLc4 > pLp4 and oLc4 < oLp4 and inRL4
bear4  = calcmom and plotBear and phf4 and pHc4 > pHp4 and oHc4 < oHp4 and inRH4
hbear4 = calcmom and plotHiddenBear and phf4 and pHc4 < pHp4 and oHc4 > oHp4 and inRH4

//----- o5 CCI
plf5 = o5 > o5[lbR] and lowest[lbR](o5) > o5[lbR] and o5[lbR] < lowest[lbL](o5)[lbR+1]
if plf5 then
   oLp5 = oLc5
   pLp5 = pLc5
   bLp5 = bLc5
   oLc5 = o5[lbR]
   pLc5 = low[lbR]
   bLc5 = barindex[lbR]
endif
phf5 = o5 < o5[lbR] and highest[lbR](o5) < o5[lbR] and o5[lbR] > highest[lbL](o5)[lbR+1]
if phf5 then
   oHp5 = oHc5
   pHp5 = pHc5
   bHp5 = bHc5
   oHc5 = o5[lbR]
   pHc5 = high[lbR]
   bHc5 = barindex[lbR]
endif
inRL5 = bLp5 > 0 and (bLc5-bLp5) >= minbars and (bLc5-bLp5) <= maxbars
inRH5 = bHp5 > 0 and (bHc5-bHp5) >= minbars and (bHc5-bHp5) <= maxbars
bull5  = calccci and plotBull and plf5 and pLc5 < pLp5 and oLc5 > oLp5 and inRL5
hbull5 = calccci and plotHiddenBull and plf5 and pLc5 > pLp5 and oLc5 < oLp5 and inRL5
bear5  = calccci and plotBear and phf5 and pHc5 > pHp5 and oHc5 < oHp5 and inRH5
hbear5 = calccci and plotHiddenBear and phf5 and pHc5 < pHp5 and oHc5 > oHp5 and inRH5

//----- o6 OBV
plf6 = o6 > o6[lbR] and lowest[lbR](o6) > o6[lbR] and o6[lbR] < lowest[lbL](o6)[lbR+1]
if plf6 then
   oLp6 = oLc6
   pLp6 = pLc6
   bLp6 = bLc6
   oLc6 = o6[lbR]
   pLc6 = low[lbR]
   bLc6 = barindex[lbR]
endif
phf6 = o6 < o6[lbR] and highest[lbR](o6) < o6[lbR] and o6[lbR] > highest[lbL](o6)[lbR+1]
if phf6 then
   oHp6 = oHc6
   pHp6 = pHc6
   bHp6 = bHc6
   oHc6 = o6[lbR]
   pHc6 = high[lbR]
   bHc6 = barindex[lbR]
endif
inRL6 = bLp6 > 0 and (bLc6-bLp6) >= minbars and (bLc6-bLp6) <= maxbars
inRH6 = bHp6 > 0 and (bHc6-bHp6) >= minbars and (bHc6-bHp6) <= maxbars
bull6  = calcobv and plotBull and plf6 and pLc6 < pLp6 and oLc6 > oLp6 and inRL6
hbull6 = calcobv and plotHiddenBull and plf6 and pLc6 > pLp6 and oLc6 < oLp6 and inRL6
bear6  = calcobv and plotBear and phf6 and pHc6 > pHp6 and oHc6 < oHp6 and inRH6
hbear6 = calcobv and plotHiddenBear and phf6 and pHc6 < pHp6 and oHc6 > oHp6 and inRH6

//----- o7 Stochastic
plf7 = o7 > o7[lbR] and lowest[lbR](o7) > o7[lbR] and o7[lbR] < lowest[lbL](o7)[lbR+1]
if plf7 then
   oLp7 = oLc7
   pLp7 = pLc7
   bLp7 = bLc7
   oLc7 = o7[lbR]
   pLc7 = low[lbR]
   bLc7 = barindex[lbR]
endif
phf7 = o7 < o7[lbR] and highest[lbR](o7) < o7[lbR] and o7[lbR] > highest[lbL](o7)[lbR+1]
if phf7 then
   oHp7 = oHc7
   pHp7 = pHc7
   bHp7 = bHc7
   oHc7 = o7[lbR]
   pHc7 = high[lbR]
   bHc7 = barindex[lbR]
endif
inRL7 = bLp7 > 0 and (bLc7-bLp7) >= minbars and (bLc7-bLp7) <= maxbars
inRH7 = bHp7 > 0 and (bHc7-bHp7) >= minbars and (bHc7-bHp7) <= maxbars
bull7  = calcstoc and plotBull and plf7 and pLc7 < pLp7 and oLc7 > oLp7 and inRL7
hbull7 = calcstoc and plotHiddenBull and plf7 and pLc7 > pLp7 and oLc7 < oLp7 and inRL7
bear7  = calcstoc and plotBear and phf7 and pHc7 > pHp7 and oHc7 < oHp7 and inRH7
hbear7 = calcstoc and plotHiddenBear and phf7 and pHc7 < pHp7 and oHc7 > oHp7 and inRH7

//----- o8 DI oscillator
plf8 = o8 > o8[lbR] and lowest[lbR](o8) > o8[lbR] and o8[lbR] < lowest[lbL](o8)[lbR+1]
if plf8 then
   oLp8 = oLc8
   pLp8 = pLc8
   bLp8 = bLc8
   oLc8 = o8[lbR]
   pLc8 = low[lbR]
   bLc8 = barindex[lbR]
endif
phf8 = o8 < o8[lbR] and highest[lbR](o8) < o8[lbR] and o8[lbR] > highest[lbL](o8)[lbR+1]
if phf8 then
   oHp8 = oHc8
   pHp8 = pHc8
   bHp8 = bHc8
   oHc8 = o8[lbR]
   pHc8 = high[lbR]
   bHc8 = barindex[lbR]
endif
inRL8 = bLp8 > 0 and (bLc8-bLp8) >= minbars and (bLc8-bLp8) <= maxbars
inRH8 = bHp8 > 0 and (bHc8-bHp8) >= minbars and (bHc8-bHp8) <= maxbars
bull8  = calcdi and plotBull and plf8 and pLc8 < pLp8 and oLc8 > oLp8 and inRL8
hbull8 = calcdi and plotHiddenBull and plf8 and pLc8 > pLp8 and oLc8 < oLp8 and inRL8
bear8  = calcdi and plotBear and phf8 and pHc8 > pHp8 and oHc8 < oHp8 and inRH8
hbear8 = calcdi and plotHiddenBear and phf8 and pHc8 < pHp8 and oHc8 > oHp8 and inRH8

//----- o9 VWMACD
plf9 = o9 > o9[lbR] and lowest[lbR](o9) > o9[lbR] and o9[lbR] < lowest[lbL](o9)[lbR+1]
if plf9 then
   oLp9 = oLc9
   pLp9 = pLc9
   bLp9 = bLc9
   oLc9 = o9[lbR]
   pLc9 = low[lbR]
   bLc9 = barindex[lbR]
endif
phf9 = o9 < o9[lbR] and highest[lbR](o9) < o9[lbR] and o9[lbR] > highest[lbL](o9)[lbR+1]
if phf9 then
   oHp9 = oHc9
   pHp9 = pHc9
   bHp9 = bHc9
   oHc9 = o9[lbR]
   pHc9 = high[lbR]
   bHc9 = barindex[lbR]
endif
inRL9 = bLp9 > 0 and (bLc9-bLp9) >= minbars and (bLc9-bLp9) <= maxbars
inRH9 = bHp9 > 0 and (bHc9-bHp9) >= minbars and (bHc9-bHp9) <= maxbars
bull9  = calcvwmacd and plotBull and plf9 and pLc9 < pLp9 and oLc9 > oLp9 and inRL9
hbull9 = calcvwmacd and plotHiddenBull and plf9 and pLc9 > pLp9 and oLc9 < oLp9 and inRL9
bear9  = calcvwmacd and plotBear and phf9 and pHc9 > pHp9 and oHc9 < oHp9 and inRH9
hbear9 = calcvwmacd and plotHiddenBear and phf9 and pHc9 < pHp9 and oHc9 > oHp9 and inRH9

//----- o10 Chaikin Money Flow
plf10 = o10 > o10[lbR] and lowest[lbR](o10) > o10[lbR] and o10[lbR] < lowest[lbL](o10)[lbR+1]
if plf10 then
   oLp10 = oLc10
   pLp10 = pLc10
   bLp10 = bLc10
   oLc10 = o10[lbR]
   pLc10 = low[lbR]
   bLc10 = barindex[lbR]
endif
phf10 = o10 < o10[lbR] and highest[lbR](o10) < o10[lbR] and o10[lbR] > highest[lbL](o10)[lbR+1]
if phf10 then
   oHp10 = oHc10
   pHp10 = pHc10
   bHp10 = bHc10
   oHc10 = o10[lbR]
   pHc10 = high[lbR]
   bHc10 = barindex[lbR]
endif
inRL10 = bLp10 > 0 and (bLc10-bLp10) >= minbars and (bLc10-bLp10) <= maxbars
inRH10 = bHp10 > 0 and (bHc10-bHp10) >= minbars and (bHc10-bHp10) <= maxbars
bull10  = calccmf and plotBull and plf10 and pLc10 < pLp10 and oLc10 > oLp10 and inRL10
hbull10 = calccmf and plotHiddenBull and plf10 and pLc10 > pLp10 and oLc10 < oLp10 and inRL10
bear10  = calccmf and plotBear and phf10 and pHc10 > pHp10 and oHc10 < oHp10 and inRH10
hbear10 = calccmf and plotHiddenBear and phf10 and pHc10 < pHp10 and oHc10 > oHp10 and inRH10

//-------------------------------------------------------------------------------//
//-----Conteo de divergencias confluentes (suma de booleanos, learning 058)------//
posdivergence       = (bull1)+(bull2)+(bull3)+(bull4)+(bull5)+(bull6)+(bull7)+(bull8)+(bull9)+(bull10)
negdivergence       = (bear1)+(bear2)+(bear3)+(bear4)+(bear5)+(bear6)+(bear7)+(bear8)+(bear9)+(bear10)
posdivergencehidden = (hbull1)+(hbull2)+(hbull3)+(hbull4)+(hbull5)+(hbull6)+(hbull7)+(hbull8)+(hbull9)+(hbull10)
negdivergencehidden = (hbear1)+(hbear2)+(hbear3)+(hbear4)+(hbear5)+(hbear6)+(hbear7)+(hbear8)+(hbear9)+(hbear10)

//-------------------------------------------------------------------------------//
//-----Dibujo--------------------------------------------------------------------//
//drawtext NO concatena con "+". El numero se inserta con interpolacion #var#.
//Para que el simbolo quede centrado sobre la vela del pivote, simbolo y numero
//van en DOS drawtext: el simbolo en barindex[lbR] y el numero en la vela
//siguiente (barindex[lbR]+1), ambos a la MISMA altura (yref) para que cuadren.
voffset = 0.5 * averagetruerange[14]
yrefBull = low[lbR] - voffset
yrefBear = high[lbR] + voffset

if posdivergence >= mindivcount then
   drawtext("▲", barindex[lbR], yrefBull) coloured(0,150,136)
   drawtext("#posdivergence#", barindex[lbR], yrefBull-0.8*voffset) coloured(0,150,136)
endif
if negdivergence >= mindivcount then
   drawtext("▼", barindex[lbR], yrefBear) coloured(255,0,0)
   drawtext("#negdivergence#", barindex[lbR], yrefBear+0.8*voffset) coloured(255,0,0)
endif
if posdivergencehidden >= mindivcount then
   drawtext("△", barindex[lbR], yrefBull) coloured(0,200,0)
   drawtext("#posdivergencehidden#", barindex[lbR], yrefBull-0.8*voffset) coloured(0,200,0)
endif
if negdivergencehidden >= mindivcount then
   drawtext("▽", barindex[lbR], yrefBear) coloured(255,165,0)
   drawtext("#negdivergencehidden#", barindex[lbR], yrefBear+0.8*voffset) coloured(255,165,0)
endif

return
