





Fear and Greed Index: a Momentum, Trend and Volume Sentiment Oscillator
Introduction
Market sentiment swings between fear and greed. The well-known Fear & Greed indices built for the whole stock market combine several inputs into a single 0-100 reading; this indicator by BigBeluga applies the same idea to any instrument and any timeframe, using only its own price and volume.
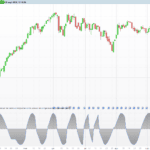
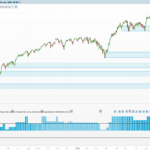
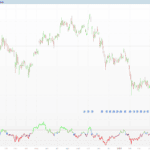
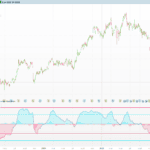
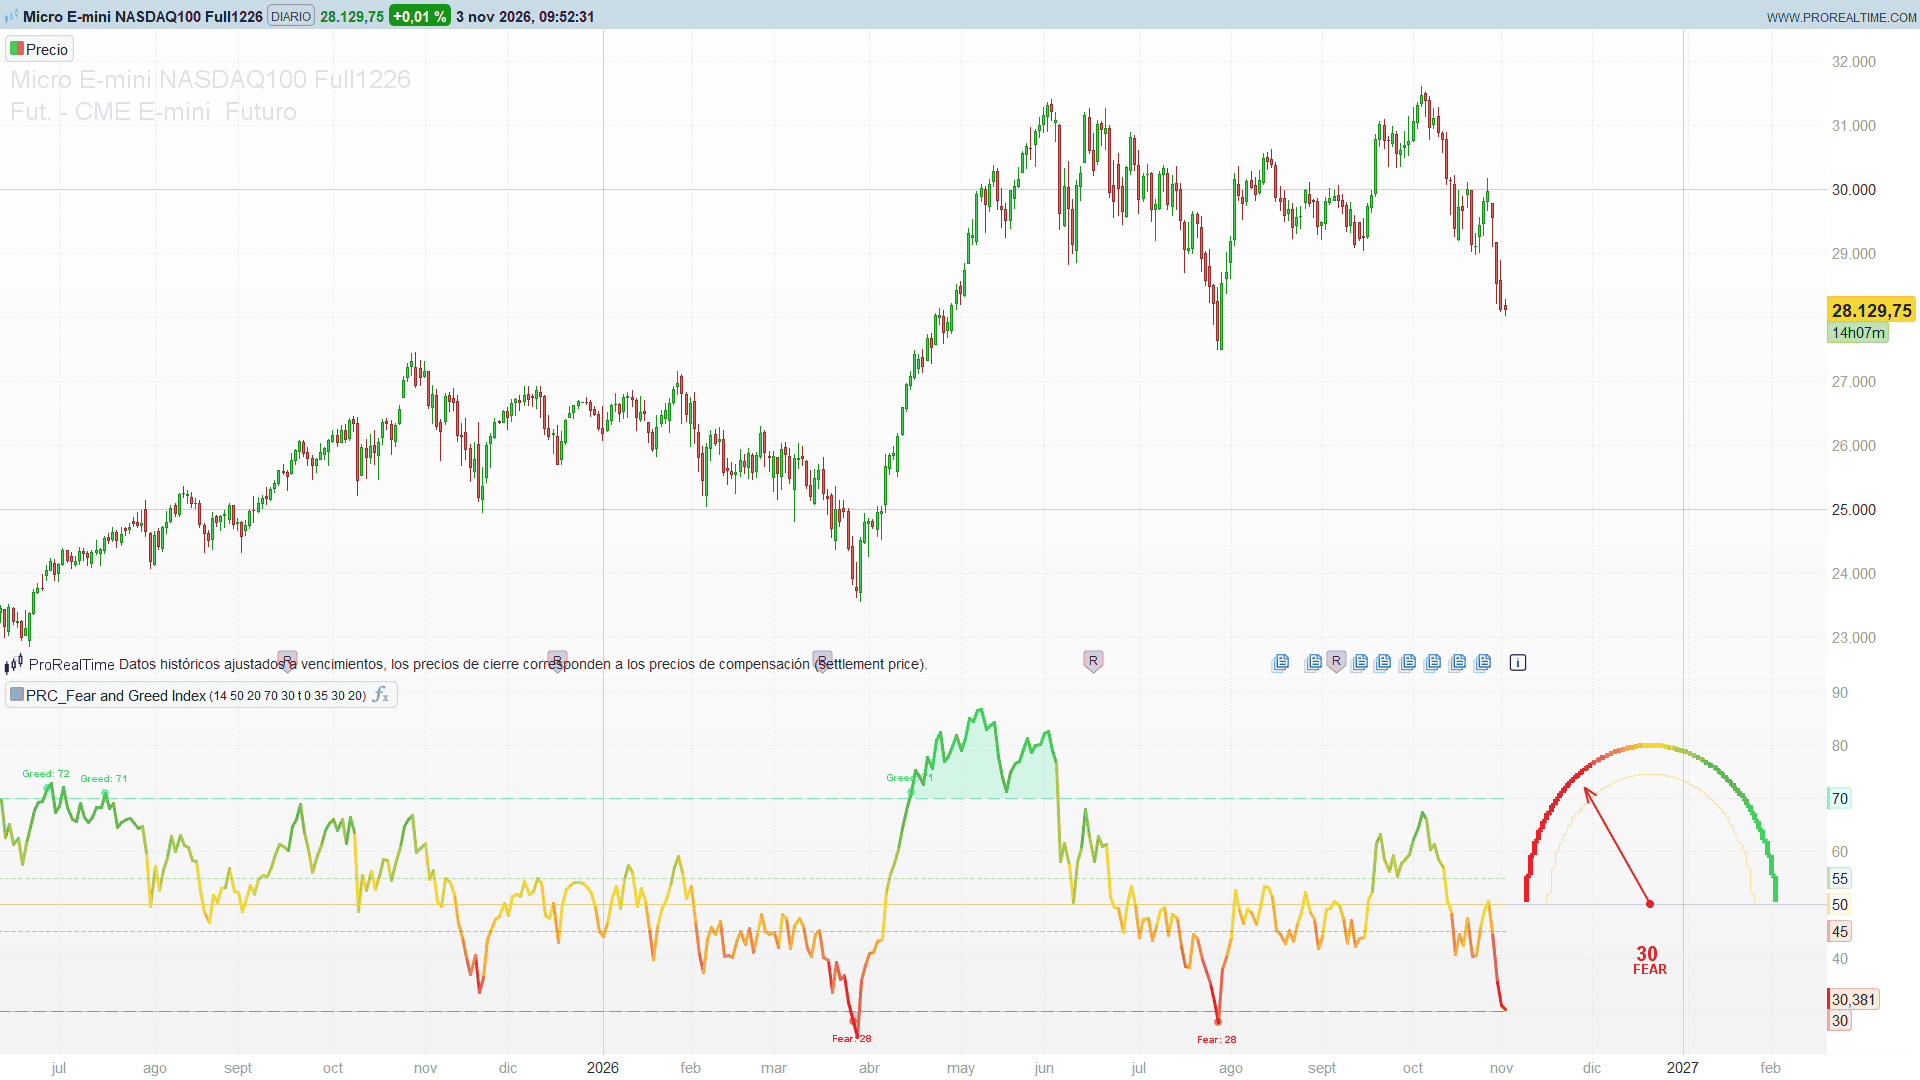
The result is an oscillator in its own panel with a five-colour gradient line, shaded extreme zones, labelled extreme signals and a gauge to the right of the last bar that shows the current reading at a glance, either as a needle on an arc or as a vertical colour scale.
Theory Behind the Indicator
The index is the average of three factors, each on a 0-100 scale:
- Momentum: the RSI of the close (14 bars by default).
- Trend: the distance of the close from its 50-bar simple moving average, in percent, multiplied by 4 and centred on 50, then capped to 0-100. A close 5 % above the average gives 70; 5 % below gives 30.
- Volume flow: the share of the volume of the last 20 bars traded on up bars (close at or above the open). 50 means balanced flow.
The average of the three gives the Fear & Greed reading:
- 70 or more: Extreme Greed.
- 55 to 70: Greed.
- 45 to 55: Neutral.
- 30 to 45: Fear.
- 30 or less: Extreme Fear.
A signal is printed when the index crosses above the extreme greed level or below the extreme fear level on a closed bar, with at least 5 bars since the previous signal.
Key Features at a Glance
- Composite sentiment oscillator from momentum, trend and volume flow.
- Line with a five-colour gradient: dark red, red, yellow, green and bright green.
- Shaded area when the index is beyond the extreme greed or extreme fear level.
- Reference levels at 70, 55, 50, 45 and 30.
- “Greed: N” and “Fear: N” labels with a dot on each extreme crossing.
- Gauge to the right of the last bar: needle on a gradient arc with the value and the state, or a vertical gradient scale with a pointer.
How to Read the Indicator
- Line colour: tells the state at a glance, from dark red (extreme fear) through yellow (neutral) to bright green (extreme greed).
- Green shaded area above 70: euphoria. Momentum, trend and buying volume all agree, which often happens close to short-term tops.
- Red shaded area below 30: panic. The three factors agree on the downside, which often happens close to short-term bottoms.
- Greed / Fear labels: the first bar of each new extreme, with the rounded reading.
- Gauge: the needle (or the pointer of the vertical scale) points at the current value, written in the colour of the line, with the state below it.
Practical Applications
- Contrarian timing: look for reversal setups on price when the index leaves the extreme zones, rather than at the first touch.
- Trend health: in a healthy uptrend the index keeps returning to the greed side after pullbacks; a series of lower readings warns that the trend is losing support.
- Filter for other systems: avoid new longs in extreme greed and new shorts in extreme fear.
- Multi-market dashboard: the same scale on every instrument makes it easy to compare sentiment across a watchlist.
On instruments without volume (some indices and CFDs) the volume flow factor stays at 50, so the index is driven by momentum and trend only.
Indicator Configuration
- rsiLen (default 14): RSI length of the momentum factor.
- trdLen (default 50): length of the moving average of the trend factor.
- flowLen (default 20): length of the volume flow factor.
- obLvl (default 70): extreme greed level (50 to 100).
- osLvl (default 30): extreme fear level (0 to 50).
- shwGauge (default 1): show the gauge to the right of the last bar.
- gType (default 0): gauge type. 0 = arc with needle, 1 = vertical scale.
- gOffset (default 35): distance of the gauge from the last bar, in bars.
- gRadius (default 30): size of the gauge.
- vBoxes (default 20): number of colour boxes of the vertical scale.
The Code
//---------------------------------------------------------------
// PRC_Fear and Greed Index
// version = 0
// 03.11.2026
// Iván González @ www.prorealcode.com
// Author: BigBeluga
// Sharing ProRealTime knowledge
//--------------------------------------------------------------------//
DEFPARAM DRAWONLASTBARONLY = true

// ===================== INPUTS: FACTOR SETTINGS =====================
rsiLen = 14            // momentum (RSI) length
trdLen = 50            // trend (SMA) length
flowLen = 20           // volume flow length
obLvl = 70             // overbought (extreme greed) level, 50 - 100
osLvl = 30             // oversold (extreme fear) level, 0 - 50

// ===================== INPUTS: GAUGE DISPLAY =====================
shwGauge = 1           // 1 = show the gauge to the right of the last bar
gType = 0              // gauge type: 0 = arc, 1 = vertical scale
gOffset = 35           // gauge right offset, in bars (5 - 100)
gRadius = 30           // gauge size (radius), 5 - 100
vBoxes = 20            // number of boxes of the vertical scale (5 - 50)

// ===================== PALETTE =====================
// extreme greed 0,230,118 / greed 76,175,80 / neutral 253,216,53
// fear 241,34,50 / extreme fear 213,0,0

// ===================== CALCULATIONS =====================
// 1. Momentum factor (RSI 0 - 100), 50 while the RSI is warming up
IF barindex >= rsiLen THEN
   fMom = RSI[rsiLen](close)
ELSE
   fMom = 50
ENDIF

// 2. Trend factor: distance from the SMA, in %, times 4 around 50
fgReady = 0
IF barindex >= trdLen - 1 THEN
   fgReady = 1
ENDIF
smaVal = average[trdLen](close)
fTrd = 50
IF fgReady = 1 AND smaVal <> 0 THEN
   tDist = (close - smaVal) / smaVal * 100
   fTrd = max(0, min(100, 50 + tDist * 4))
ENDIF

// 3. Volume flow factor: share of the volume traded on up bars
IF close >= open THEN
   upVol = volume
ELSE
   upVol = 0
ENDIF
totVol = average[flowLen](volume)
bVol = average[flowLen](upVol)
fVol = 50
IF barindex >= flowLen - 1 AND totVol > 0 THEN
   fVol = bVol / totVol * 100
ENDIF

// composite Fear & Greed index
IF fgReady = 1 THEN
   fgIdx = (fMom + fTrd + fVol) / 3
   fgSf = fgIdx
ELSE
   fgIdx = undefined
   fgSf = 50
ENDIF
fgClmp = max(0, min(100, fgSf))

// state: 2 = extreme greed, 1 = greed, 0 = neutral, -1 = fear, -2 = extreme fear
IF fgSf >= obLvl THEN
   stState = 2
ELSIF fgSf >= 55 THEN
   stState = 1
ELSIF fgSf <= osLvl THEN
   stState = -2
ELSIF fgSf <= 45 THEN
   stState = -1
ELSE
   stState = 0
ENDIF

// ===================== LINE COLOUR (5-colour gradient) =====================
gv = fgClmp
IF gv <= osLvl THEN
   gLo = 0
   gHi = osLvl
   c1R = 213
   c1G = 0
   c1B = 0
   c2R = 241
   c2G = 34
   c2B = 50
ELSIF gv <= 50 THEN
   gLo = osLvl
   gHi = 50
   c1R = 241
   c1G = 34
   c1B = 50
   c2R = 253
   c2G = 216
   c2B = 53
ELSIF gv <= obLvl THEN
   gLo = 50
   gHi = obLvl
   c1R = 253
   c1G = 216
   c1B = 53
   c2R = 76
   c2G = 175
   c2B = 80
ELSE
   gLo = obLvl
   gHi = 100
   c1R = 76
   c1G = 175
   c1B = 80
   c2R = 0
   c2G = 230
   c2B = 118
ENDIF
gt = max(0, min(1, (gv - gLo) / max(gHi - gLo, 0.000001)))
lnR = round(c1R + (c2R - c1R) * gt)
lnG = round(c1G + (c2G - c1G) * gt)
lnB = round(c1B + (c2B - c1B) * gt)
IF fgReady = 1 THEN
   lnA = 255
ELSE
   lnA = 0
ENDIF

// ===================== EXTREME ZONE FILLS =====================
IF fgReady = 1 AND fgIdx >= obLvl THEN
   fgOb = fgIdx
ELSE
   fgOb = obLvl
ENDIF
IF fgReady = 1 AND fgIdx <= osLvl THEN
   fgOs = fgIdx
ELSE
   fgOs = osLvl
ENDIF
COLORBETWEEN(fgOb, obLvl, 0, 230, 118, 38)
COLORBETWEEN(fgOs, osLvl, 213, 0, 0, 38)

// ===================== SIGNALS (5-bar gap, closed bars only) =====================
// the live bar is the only bar that is not closed yet
barConfirmed = 1
IF islastbarupdate THEN
   barConfirmed = 0
ENDIF
prevReady = 0
IF barindex > trdLen - 1 THEN
   prevReady = 1
ENDIF
once hasSig = 0
once lsSigBar = 0
gapOk = 0
IF hasSig = 0 THEN
   gapOk = 1
ELSIF barindex - lsSigBar > 5 THEN
   gapOk = 1
ENDIF
// signals stored with a pure assignment indexed by a scalar counter and redrawn on the last bar
once nSig = 0
IF prevReady = 1 AND barConfirmed = 1 AND gapOk = 1 THEN
   IF fgIdx > obLvl AND fgIdx[1] <= obLvl THEN
      hasSig = 1
      lsSigBar = barindex
      $sgX[nSig] = barindex
      $sgY[nSig] = fgIdx
      $sgV[nSig] = round(fgIdx)
      $sgT[nSig] = 1
      nSig = nSig + 1
   ELSIF fgIdx < osLvl AND fgIdx[1] >= osLvl THEN
      hasSig = 1
      lsSigBar = barindex
      $sgX[nSig] = barindex
      $sgY[nSig] = fgIdx
      $sgV[nSig] = round(fgIdx)
      $sgT[nSig] = -1
      nSig = nSig + 1
   ENDIF
ENDIF

// ===================== DRAWING =====================
IF islastbarupdate THEN
   // ---------- signal marks ----------
   // the original keeps its 500 most recent labels: 4 per signal, plus the ones of the gauge
   IF shwGauge = 1 AND gType = 0 THEN
      nKeep = 124
   ELSIF shwGauge = 1 THEN
      nKeep = 123
   ELSE
      nKeep = 125
   ENDIF
   firstSig = max(0, nSig - nKeep)
   IF nSig > 0 THEN
      FOR k = firstSig TO nSig - 1 DO
         sx = $sgX[k]
         sy = $sgY[k]
         sv = $sgV[k]
         IF $sgT[k] = 1 THEN
            DRAWPOINT(sx, sy, 2) COLOURED(0, 230, 118, 127)
            DRAWTEXT("Greed: #sv#", sx, sy + 3, dialog, bold, 10) COLOURED(0, 230, 118, 255)
         ELSE
            DRAWPOINT(sx, sy, 2) COLOURED(213, 0, 0, 127)
            DRAWTEXT("Fear: #sv#", sx, sy - 3, dialog, bold, 10) COLOURED(213, 0, 0, 255)
         ENDIF
      NEXT
   ENDIF

   scV = round(fgSf)

   // ---------- arc gauge ----------
   IF shwGauge = 1 AND gType = 0 THEN
      cX = barindex + gOffset
      cY = 50
      inRad = gRadius * 0.82
      // inner scale line (120 steps from 179 to 1 degree); COS and SIN work in degrees
      FOR i = 0 TO 119 DO
         a0 = 179 - i * 178 / 120
         a1 = 179 - (i + 1) * 178 / 120
         DRAWSEGMENT(cX + inRad * cos(a0), cY + inRad * sin(a0), cX + inRad * cos(a1), cY + inRad * sin(a1)) COLOURED(253, 216, 53, 153) STYLE(line, 1)
      NEXT
      // outer thick line: 50 segments of 12 steps, each in the gradient colour of its midpoint
      FOR i = 0 TO 49 DO
         pctSt = i / 50 * 100
         pctEn = (i + 1) / 50 * 100
         angSt = 179 - pctSt * 1.78
         angEn = 179 - pctEn * 1.78
         gv = (pctSt + pctEn) / 2
         IF gv <= osLvl THEN
            gLo = 0
            gHi = osLvl
            c1R = 213
            c1G = 0
            c1B = 0
            c2R = 241
            c2G = 34
            c2B = 50
         ELSIF gv <= 50 THEN
            gLo = osLvl
            gHi = 50
            c1R = 241
            c1G = 34
            c1B = 50
            c2R = 253
            c2G = 216
            c2B = 53
         ELSIF gv <= obLvl THEN
            gLo = 50
            gHi = obLvl
            c1R = 253
            c1G = 216
            c1B = 53
            c2R = 76
            c2G = 175
            c2B = 80
         ELSE
            gLo = obLvl
            gHi = 100
            c1R = 76
            c1G = 175
            c1B = 80
            c2R = 0
            c2G = 230
            c2B = 118
         ENDIF
         gt = max(0, min(1, (gv - gLo) / max(gHi - gLo, 0.000001)))
         sgR = round(c1R + (c2R - c1R) * gt)
         sgG = round(c1G + (c2G - c1G) * gt)
         sgB = round(c1B + (c2B - c1B) * gt)
         FOR j = 0 TO 11 DO
            a0 = angSt + (angEn - angSt) * j / 12
            a1 = angSt + (angEn - angSt) * (j + 1) / 12
            DRAWSEGMENT(cX + gRadius * cos(a0), cY + gRadius * sin(a0), cX + gRadius * cos(a1), cY + gRadius * sin(a1)) COLOURED(sgR, sgG, sgB, 255) STYLE(line, 5)
         NEXT
      NEXT
      // needle with its arrow head, score, state and hub
      ptrAng = 180 - fgSf / 100 * 180
      tipX = cX + gRadius * 0.90 * cos(ptrAng)
      tipY = cY + gRadius * 0.90 * sin(ptrAng)
      hdLen = gRadius * 0.10
      DRAWSEGMENT(cX, cY, tipX, tipY) COLOURED(lnR, lnG, lnB, 255) STYLE(line, 2)
      DRAWSEGMENT(tipX, tipY, tipX + hdLen * cos(ptrAng + 155), tipY + hdLen * sin(ptrAng + 155)) COLOURED(lnR, lnG, lnB, 255) STYLE(line, 2)
      DRAWSEGMENT(tipX, tipY, tipX + hdLen * cos(ptrAng - 155), tipY + hdLen * sin(ptrAng - 155)) COLOURED(lnR, lnG, lnB, 255) STYLE(line, 2)
      DRAWTEXT("#scV#", cX, cY - gRadius * 0.3, dialog, bold, 20) COLOURED(lnR, lnG, lnB, 255)
      IF stState = 2 THEN
         DRAWTEXT("EXTREME GREED", cX, cY - gRadius * 0.4, dialog, bold, 13) COLOURED(lnR, lnG, lnB, 255)
      ELSIF stState = 1 THEN
         DRAWTEXT("GREED", cX, cY - gRadius * 0.4, dialog, bold, 13) COLOURED(lnR, lnG, lnB, 255)
      ELSIF stState = -2 THEN
         DRAWTEXT("EXTREME FEAR", cX, cY - gRadius * 0.4, dialog, bold, 13) COLOURED(lnR, lnG, lnB, 255)
      ELSIF stState = -1 THEN
         DRAWTEXT("FEAR", cX, cY - gRadius * 0.4, dialog, bold, 13) COLOURED(lnR, lnG, lnB, 255)
      ELSE
         DRAWTEXT("NEUTRAL", cX, cY - gRadius * 0.4, dialog, bold, 13) COLOURED(lnR, lnG, lnB, 255)
      ENDIF
      DRAWPOINT(cX, cY, 2) COLOURED(lnR, lnG, lnB, 255)
   ENDIF

   // ---------- vertical gauge ----------
   IF shwGauge = 1 AND gType = 1 THEN
      vX = barindex + gOffset
      scaleH = gRadius * 1.6
      botY = 50 - scaleH / 2
      topY = 50 + scaleH / 2
      boxW = gRadius * 0.25
      boxH = scaleH / vBoxes
      // gradient boxes: fear at the bottom, greed at the top
      FOR i = 0 TO vBoxes - 1 DO
         yBot = botY + i * boxH
         yTop = yBot + boxH
         gv = (i + 0.5) / vBoxes * 100
         IF gv <= osLvl THEN
            gLo = 0
            gHi = osLvl
            c1R = 213
            c1G = 0
            c1B = 0
            c2R = 241
            c2G = 34
            c2B = 50
         ELSIF gv <= 50 THEN
            gLo = osLvl
            gHi = 50
            c1R = 241
            c1G = 34
            c1B = 50
            c2R = 253
            c2G = 216
            c2B = 53
         ELSIF gv <= obLvl THEN
            gLo = 50
            gHi = obLvl
            c1R = 253
            c1G = 216
            c1B = 53
            c2R = 76
            c2G = 175
            c2B = 80
         ELSE
            gLo = obLvl
            gHi = 100
            c1R = 76
            c1G = 175
            c1B = 80
            c2R = 0
            c2G = 230
            c2B = 118
         ENDIF
         gt = max(0, min(1, (gv - gLo) / max(gHi - gLo, 0.000001)))
         sgR = round(c1R + (c2R - c1R) * gt)
         sgG = round(c1G + (c2G - c1G) * gt)
         sgB = round(c1B + (c2B - c1B) * gt)
         DRAWRECTANGLE(vX, yTop, vX + boxW, yBot) COLOURED(sgR, sgG, sgB, 0) FILLCOLOR(sgR, sgG, sgB, 255)
      NEXT
      // tick labels at 0, oversold, 50, overbought and 100
      tkX = vX + boxW * 1.15
      DRAWTEXT("0", tkX, botY, dialog, bold, 10) COLOURED(120, 123, 134, 255)
      DRAWTEXT("#osLvl#", tkX, botY + osLvl / 100 * scaleH, dialog, bold, 10) COLOURED(120, 123, 134, 255)
      DRAWTEXT("50", tkX, botY + 0.5 * scaleH, dialog, bold, 10) COLOURED(120, 123, 134, 255)
      DRAWTEXT("#obLvl#", tkX, botY + obLvl / 100 * scaleH, dialog, bold, 10) COLOURED(120, 123, 134, 255)
      DRAWTEXT("100", tkX, topY, dialog, bold, 10) COLOURED(120, 123, 134, 255)
      // current value: pointer line across the scale and the value to its left
      ptrY = botY + fgClmp / 100 * scaleH
      DRAWSEGMENT(vX, ptrY, vX + boxW, ptrY) COLOURED(lnR, lnG, lnB, 255) STYLE(line, 2)
      DRAWTEXT("#scV#", vX - boxW * 0.1 - 2, ptrY, dialog, bold, 13) COLOURED(lnR, lnG, lnB, 255)
      // state above the scale
      stX = vX + boxW * 0.5
      stY = topY + boxH * 0.8
      IF stState = 2 THEN
         DRAWTEXT("EXTREME GREED", stX, stY, dialog, bold, 13) COLOURED(lnR, lnG, lnB, 255)
      ELSIF stState = 1 THEN
         DRAWTEXT("GREED", stX, stY, dialog, bold, 13) COLOURED(lnR, lnG, lnB, 255)
      ELSIF stState = -2 THEN
         DRAWTEXT("EXTREME FEAR", stX, stY, dialog, bold, 13) COLOURED(lnR, lnG, lnB, 255)
      ELSIF stState = -1 THEN
         DRAWTEXT("FEAR", stX, stY, dialog, bold, 13) COLOURED(lnR, lnG, lnB, 255)
      ELSE
         DRAWTEXT("NEUTRAL", stX, stY, dialog, bold, 13) COLOURED(lnR, lnG, lnB, 255)
      ENDIF
   ENDIF
ENDIF

RETURN fgIdx COLOURED(lnR, lnG, lnB, lnA) STYLE(line, 3) AS "Fear & Greed Index", obLvl COLOURED(0, 230, 118, 102) STYLE(dottedline2, 1) AS "Extreme Greed", 55 COLOURED(76, 175, 80, 102) STYLE(dottedline, 1) AS "Greed", 50 COLOURED(253, 216, 53, 127) STYLE(line, 1) AS "Neutral", 45 COLOURED(241, 34, 50, 102) STYLE(dottedline, 1) AS "Fear", osLvl COLOURED(213, 0, 0, 102) STYLE(dottedline2, 1) AS "Extreme Fear"