Order Flow Imbalance Oscillator
Introduction
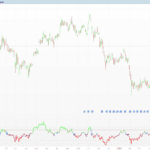
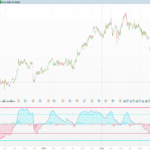
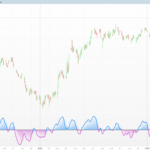
Most volume oscillators answer the question “how much was traded?”. Order Flow Imbalance Oscillator, by StrikePriceLabs, answers a different and far more useful one: how much of what was traded is still unspent, and on which side of the market is it sitting?
The idea is simple to state. Every time an impulse moves price away from an origin candle, the indicator records a supply or demand zone and stores the volume that was traded inside that impulse. The zone stays on the books until price invalidates it. At any moment the indicator adds up the stored volume of every zone still alive above price and every zone still alive below it, and reports the normalised balance between the two:
imbalance = (demand volume - supply volume) / (demand volume + supply volume) * 100
The result is bounded between −100 and +100. A reading of +100 means every surviving zone is a demand zone: all the supply that was built has already been eaten through. A reading of −100 means the opposite. A reading near zero means both sides still have comparable unspent inventory hanging over the market.
This is not a smoothed line, and it should not be read as one. It is a step function that only moves when a zone is born or dies — which is exactly what makes it worth watching.
Theory Behind the Indicator
1. What counts as an impulse
A supply zone starts with a strict trigger: three consecutive bearish candles, with at least one of the three trading above the average volume of the last 1000 bars. Three candles the same colour is a run; the volume filter is what separates a run that matters from drift. A demand zone uses the mirror condition with three bullish candles.
2. Where the zone is anchored
Once the trigger fires, the indicator walks backwards up to six bars looking for the first candle of the opposite colour. That candle is the origin — the last moment the other side was still in control before the impulse took over.
- For a supply zone: the origin is the last bullish candle. The zone runs from its
lowup tolow + 2 × ATR(200). - For a demand zone: the origin is the last bearish candle. The zone runs from its
highdown tohigh − 2 × ATR(200).
Anchoring to the origin rather than to the impulse itself is what makes this an order-block style construction: the interesting price is where the imbalance was created, not where it was revealed. And if no opposite candle is found inside the scan window, no zone is created at all — a run with no identifiable origin is not tradeable information.
3. The stored volume, and why the sign does not matter
While walking back to the origin, the indicator accumulates the volume of every candle it crosses, signed by candle direction. That accumulated figure is the zone’s delta, and it is the number that ends up feeding the oscillator.
When the totals are computed, the magnitudes are what get added up — the sign only records which side built the zone. A supply zone with a delta of −480,000 contributes 480,000 to the supply side. What the oscillator compares is therefore not “buying minus selling” bar by bar, but how much volume went into building the zones each side still has alive.
4. Life and death of a zone
Three rules govern the list, and together they are what gives the oscillator its shape:
- Invalidation. A supply zone dies when a close prints above its top. A demand zone dies when a close prints below its bottom. Price has consumed what was there.
- Overlap. When one zone has its edge inside another, the containing zone is dropped. Two views of the same imbalance should not count twice.
- Cap. Only the five most recent zones per side are kept. The oldest is dropped first, so the reading reflects the current book, not the archive.
There is also a cooldown: after a zone is created, no new zone of the same side is allowed for 14 bars. Without it, a long directional run would stack five nearly identical zones and pin the oscillator at its extreme for no additional reason.
5. Why the reading updates on the close
The zone list is persistent state, and a zone that appears halfway through a candle and undoes itself before the candle closes was never a zone. The engine therefore takes all of its inputs — candle direction, volume, ATR, zone geometry — from the last closed bar. The oscillator steps when a candle closes and stays still in between. On low timeframes, where the forming candle is the permanent state of the chart, this is the difference between a reading you can act on and one that redraws itself under you.
Key Features at a Glance
- Bounded oscillator, −100 to +100, with no smoothing and no parameters to tune for responsiveness
- Zone detection driven by a volume filter measured against a 1000-bar average, not a fixed threshold
- Zone height scaled by ATR(200), so it adapts to the instrument and the timeframe
- Automatic invalidation, overlap cleanup and a five-zone cap per side
- 14-bar cooldown per side to stop a single run from saturating the reading
- Colour follows the sign: demand blue above zero, supply orange below
- Reference levels at 0, +50 and −50
- Runs on closed bars, so the value does not move inside a candle
How to Read the Indicator
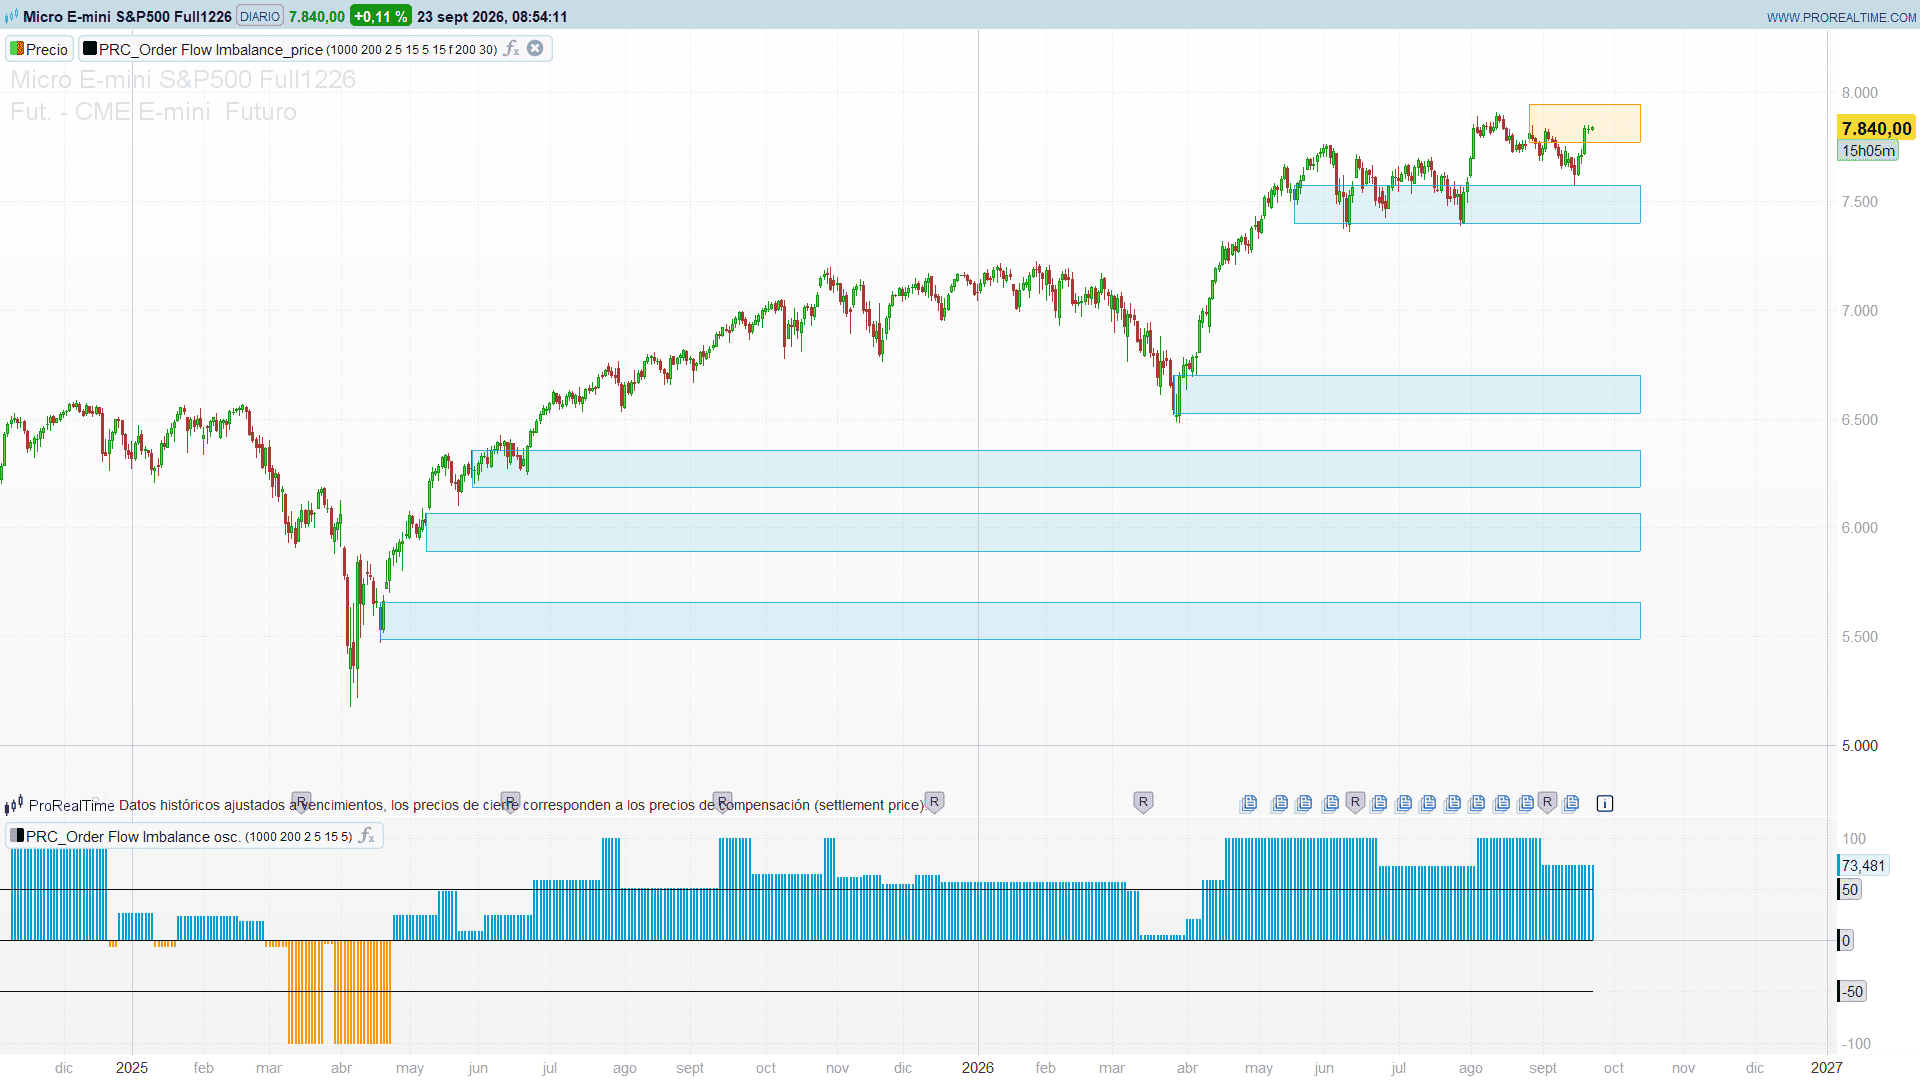
The zero line is the balance point. Above it, the market has more unspent demand than unspent supply still standing. Below it, the reverse.
±50 marks a dominant side. Crossing +50 means demand holds roughly three times the unspent volume that supply does. These are the levels worth marking on the chart.
±100 is not a stronger signal — it is a different one. The reading is pinned at an extreme when one side has no surviving zones at all. That happens after price has run through everything the other side built. In testing on synthetic series the oscillator sat at an extreme around 16% of the time, so it is common rather than exceptional, and it says “nothing left to eat on that side”, not “maximum pressure”.
Watch the steps, not the level. Because the value only changes when a zone is created or destroyed — around 8% of bars in the same testing — every move is a discrete event. A drop from +60 to −20 is not momentum fading; it is a demand zone being invalidated, or a supply zone being born. That is a cleaner signal than a line drifting.
Divergence is the natural use. Price making a new high while the oscillator falls means the advance is consuming demand zones without creating new ones: the move is being paid for out of inventory that is not being replaced.
Practical Applications
Context filter for entries. Taking longs only while the oscillator is above zero keeps you on the side of the market with unspent demand behind it. This is the least demanding way to use it, and the most robust.
Timing a reversal against an extreme. When the reading is pinned at −100 and then steps up, the first demand zone in a long while has just been built. The step itself carries the information: it took a three-candle bullish run on above-average volume to create it.
Confirming a breakout. A breakout that pushes the oscillator further in its own direction is one that destroyed a zone on the opposite side. A breakout that leaves the reading unchanged did not consume anything.
Timeframe. The indicator needs volume, so it is meant for instruments with real volume data — futures, stocks, ETFs. On timeframes below 5 minutes the 1000-bar volume average covers little more than a session, which makes the “high volume” filter far more permissive than it looks.
Indicator Configuration
All parameters sit at the top of the code and can be edited directly:
- volLen (default: 1000): lookback of the average volume that flags a high-volume bar. Lower it to make zone creation more frequent.
- atrLen (default: 200): ATR length that sets zone height.
- atrMult (default: 2): zone height in ATR units. Taller zones survive longer, so the reading changes less often.
- scanBack (default: 5): how far back the origin candle is searched. Raising it creates zones from longer impulses.
- coolBars (default: 15): counter value that releases the block on a new zone of the same side. The effective wait is one bar less than this value, so the default is a 14-bar cooldown.
- zoneMax (default: 5): live zones kept per side.
- supR / supG / supB (default: 255, 152, 0): supply colour, orange.
- demR / demG / demB (default: 0, 159, 212): demand colour, blue.
Important — bars needed. With the default settings the indicator needs roughly 1,200 bars before it produces anything, because the volume average alone is 1,000 bars deep. Make sure the chart is loading at least 2,000 bars, or the panel will look empty. If you want it usable on a shorter history, lower volLen first.
The oscillator is returned as a histogram so it fills from the zero line. If you prefer a line or an area, change it in the indicator’s display properties.
Code
//-------------------------------------//
//PRC_Order Flow Imbalance Oscillator
//version = 0
//22.09.26
//Iván González @ www.prorealcode.com
//Author: StrikePriceLabs
//Sharing ProRealTime knowledge
//-------------------------------------//
// Inputs
//-------------------------------------//
volLen   = 1000   // Lookback of the average volume used to flag a high volume bar
atrLen   = 200    // ATR length that sets the height of a zone
atrMult  = 2      // Zone height, in ATR units
scanBack = 5      // How far back the impulse is scanned for its origin candle
coolBars = 15     // Counter value that releases the block on a new zone (same side)
zoneMax  = 5      // Live zones kept per side

// Supply (orange) and demand (blue) colours
supR = 255
supG = 152
supB = 0
demR = 0
demG = 159
demB = 212

//-------------------------------------//
// Persistent state
//-------------------------------------//
ONCE nSup    = 0   // live supply zones
ONCE nDem    = 0   // live demand zones
ONCE cntBear = 0   // supply cooldown counter
ONCE cntBull = 0   // demand cooldown counter
ONCE supSum  = 0
ONCE demSum  = 0

//-------------------------------------//
// Closed-bar inputs
//-------------------------------------//
avgVol = average[volLen](volume)
atrRaw = averagetruerange[atrLen](close)

atrV   = atrRaw[1] * atrMult
warmUp = max(volLen, atrLen) + scanBack + 2

IF barindex > warmUp THEN

   // Three consecutive candles of the same colour, at least one of them on
   // above average volume. On the closed-bar engine those are bars 1, 2 and 3.
   bearRun = 0
   IF close[1] < open[1] AND close[2] < open[2] AND close[3] < open[3] THEN
      bearRun = 1
   ENDIF

   bullRun = 0
   IF close[1] > open[1] AND close[2] > open[2] AND close[3] > open[3] THEN
      bullRun = 1
   ENDIF

   hotVol = 0
   IF volume[1] > avgVol[1] OR volume[2] > avgVol[2] OR volume[3] > avgVol[3] THEN
      hotVol = 1
   ENDIF

   //-------------------------------------//
   // Supply zone (bearish impulse)
   // The zone is anchored to the last bullish candle found within scanBack
   // bars: that candle is where the sellers took over. The delta adds up the
   // volume of every candle between the impulse and that origin.
   //-------------------------------------//
   IF bearRun = 1 AND hotVol = 1 AND cntBear = 0 THEN
      flowDelta = 0
      found     = 0
      origin    = 0

      FOR iSc = 0 TO scanBack DO
         IF found = 0 THEN
            IF close[iSc+1] > open[iSc+1] THEN
               found  = 1
               origin = iSc
            ELSIF close[iSc+1] < open[iSc+1] THEN
               flowDelta = flowDelta - volume[iSc+1]
            ELSE
               flowDelta = flowDelta + volume[iSc+1]
            ENDIF
         ENDIF
      NEXT

      // No bullish candle within the scan window means no origin, no zone.
      IF found = 1 THEN
         cntBear = 1
         nSup    = nSup + 1
         $spBot[nSup] = low[origin+1]
         $spTop[nSup] = low[origin+1] + atrV
         $spDlt[nSup] = flowDelta
      ENDIF
   ENDIF

   IF cntBear >= 1 THEN
      cntBear = cntBear + 1
   ENDIF
   IF cntBear >= coolBars THEN
      cntBear = 0
   ENDIF

   //-------------------------------------//
   // Demand zone (bullish impulse)
   //-------------------------------------//
   IF bullRun = 1 AND hotVol = 1 AND cntBull = 0 THEN
      flowDelta = 0
      found     = 0
      origin    = 0

      FOR iSc = 0 TO scanBack DO
         IF found = 0 THEN
            IF close[iSc+1] < open[iSc+1] THEN
               found  = 1
               origin = iSc
            ELSIF close[iSc+1] > open[iSc+1] THEN
               flowDelta = flowDelta + volume[iSc+1]
            ELSE
               flowDelta = flowDelta - volume[iSc+1]
            ENDIF
         ENDIF
      NEXT

      IF found = 1 THEN
         cntBull = 1
         nDem    = nDem + 1
         $dmTop[nDem] = high[origin+1]
         $dmBot[nDem] = high[origin+1] - atrV
         $dmDlt[nDem] = flowDelta
      ENDIF
   ENDIF

   IF cntBull >= 1 THEN
      cntBull = cntBull + 1
   ENDIF
   IF cntBull >= coolBars THEN
      cntBull = 0
   ENDIF

   //-------------------------------------//
   // Invalidation: a close above a supply top, or below a demand bottom,
   // removes the zone. Compacting in place is safe because the write index
   // never runs ahead of the read index.
   //-------------------------------------//
   kZ = 0
   FOR iZ = 1 TO nSup DO
      IF close[1] <= $spTop[iZ] THEN
         kZ = kZ + 1
         $spTop[kZ] = $spTop[iZ]
         $spBot[kZ] = $spBot[iZ]
         $spDlt[kZ] = $spDlt[iZ]
      ENDIF
   NEXT
   nSup = kZ

   kZ = 0
   FOR iZ = 1 TO nDem DO
      IF close[1] >= $dmBot[iZ] THEN
         kZ = kZ + 1
         $dmTop[kZ] = $dmTop[iZ]
         $dmBot[kZ] = $dmBot[iZ]
         $dmDlt[kZ] = $dmDlt[iZ]
      ENDIF
   NEXT
   nDem = kZ

   //-------------------------------------//
   // Overlapping supply zones: a zone is dropped when another zone has its
   // top inside it. The scan deletes in place and restarts the inner search
   // after every deletion. That order matters: a single marking pass over the
   // whole list is not the same thing, because it would also drop a zone whose
   // only witness has already been deleted. Keep the loop as it is.
   //-------------------------------------//
   iZ = 1
   WHILE iZ <= nSup DO
      gone = 0
      jZ   = 1
      WHILE jZ <= nSup AND gone = 0 DO
         IF jZ <> iZ AND $spTop[jZ] < $spTop[iZ] AND $spTop[jZ] > $spBot[iZ] THEN
            IF iZ < nSup THEN
               FOR qZ = iZ TO nSup - 1 DO
                  $spTop[qZ] = $spTop[qZ+1]
                  $spBot[qZ] = $spBot[qZ+1]
                  $spDlt[qZ] = $spDlt[qZ+1]
               NEXT
            ENDIF
            nSup = nSup - 1
            gone = 1
         ENDIF
         jZ = jZ + 1
      WEND
      IF gone = 0 THEN
         iZ = iZ + 1
      ENDIF
   WEND

   // Cap: the oldest zone is dropped first
   WHILE nSup > zoneMax DO
      FOR qZ = 1 TO nSup - 1 DO
         $spTop[qZ] = $spTop[qZ+1]
         $spBot[qZ] = $spBot[qZ+1]
         $spDlt[qZ] = $spDlt[qZ+1]
      NEXT
      nSup = nSup - 1
   WEND

   //-------------------------------------//
   // Overlapping demand zones: same idea, tested against the bottom edge
   //-------------------------------------//
   iZ = 1
   WHILE iZ <= nDem DO
      gone = 0
      jZ   = 1
      WHILE jZ <= nDem AND gone = 0 DO
         IF jZ <> iZ AND $dmBot[jZ] < $dmTop[iZ] AND $dmBot[jZ] > $dmBot[iZ] THEN
            IF iZ < nDem THEN
               FOR qZ = iZ TO nDem - 1 DO
                  $dmTop[qZ] = $dmTop[qZ+1]
                  $dmBot[qZ] = $dmBot[qZ+1]
                  $dmDlt[qZ] = $dmDlt[qZ+1]
               NEXT
            ENDIF
            nDem = nDem - 1
            gone = 1
         ENDIF
         jZ = jZ + 1
      WEND
      IF gone = 0 THEN
         iZ = iZ + 1
      ENDIF
   WEND

   WHILE nDem > zoneMax DO
      FOR qZ = 1 TO nDem - 1 DO
         $dmTop[qZ] = $dmTop[qZ+1]
         $dmBot[qZ] = $dmBot[qZ+1]
         $dmDlt[qZ] = $dmDlt[qZ+1]
      NEXT
      nDem = nDem - 1
   WEND

   //-------------------------------------//
   // Totals: the sign of the stored delta only records which side built the
   // zone, so the magnitudes are what is added up.
   //-------------------------------------//
   supSum = 0
   FOR iZ = 1 TO nSup DO
      supSum = supSum + abs($spDlt[iZ])
   NEXT

   demSum = 0
   FOR iZ = 1 TO nDem DO
      demSum = demSum + abs($dmDlt[iZ])
   NEXT

ENDIF

//-------------------------------------//
// Normalised imbalance, -100 to +100
//-------------------------------------//
denom = demSum + supSum
IF denom <> 0 THEN
   ofi = (demSum - supSum) / denom * 100
ELSE
   ofi = 0
ENDIF

IF ofi >= 0 THEN
   cr = demR
   cg = demG
   cb = demB
ELSE
   cr = supR
   cg = supG
   cb = supB
ENDIF

RETURN ofi COLOURED(cr, cg, cb) STYLE(histogram) AS "Order Flow Imbalance", 0 AS "Balance", 50 AS "+50 Strong Demand", -50 AS "-50 Strong Supply"
Companion Overlay: Seeing the Zones
The oscillator summarises the zones into one number. If you want to see where they actually sit, the code below is a companion indicator that paints the same zones on the price chart — same detection, same invalidation, same overlap cleanup, same five-per-side cap. It has to be a separate indicator because the oscillator lives on a −100 to +100 scale and the zones live on the price scale.
Apply it on the price chart, not in a panel. Supply zones are drawn in orange above price, demand zones in blue below it, each one starting at the origin candle that created it and extending to the right edge.
One thing to be aware of: only the zones alive on the last bar are drawn. A zone that was created and then invalidated three months ago leaves no trace, because the whole picture is redrawn from the current state. What you see is the book as it stands, not its history.
Its own parameters:
- extRight (default: 15): bars the zone is extended to the right of the last bar.
- showLbl (default: 0): set to 1 to print the stored volume next to each zone.
- edgeA (default: 200) and fillA (default: 30): opacity of the border and of the fill, 0 to 255.
//-------------------------------------//
//PRC_Order Flow Imbalance Zones
//version = 0
//23.09.26
//Iván González @ www.prorealcode.com
//Sharing ProRealTime knowledge
//-------------------------------------//
// Companion OVERLAY for the Order Flow Imbalance Oscillator, by StrikePriceLabs.
// Apply this one ON THE PRICE CHART. It draws the supply and demand zones that
// the oscillator counts, so you can see where the unspent volume is sitting
// instead of only reading its balance.

DEFPARAM drawonlastbaronly = true


//-------------------------------------//
// Inputs
//-------------------------------------//
volLen   = 1000   // Lookback of the average volume used to flag a high volume bar
atrLen   = 200    // ATR length that sets the height of a zone
atrMult  = 2      // Zone height, in ATR units
scanBack = 5      // How far back the impulse is scanned for its origin candle
coolBars = 15     // Counter value that releases the block on a new zone (same side)
zoneMax  = 5      // Live zones kept per side


extRight = 15     // Bars the zone is extended to the right of the last bar
showLbl  = 0      // 1 = print the stored volume next to each zone, 0 = hide it
edgeA    = 200    // Opacity of the zone border, 0 to 255
fillA    = 30     // Opacity of the zone fill, 0 to 255


// Supply (orange) and demand (blue) colours
supR = 255
supG = 152
supB = 0
demR = 0
demG = 159
demB = 212


//-------------------------------------//
// Persistent state
//-------------------------------------//
ONCE nSup    = 0   // live supply zones
ONCE nDem    = 0   // live demand zones
ONCE cntBear = 0   // supply cooldown counter
ONCE cntBull = 0   // demand cooldown counter


//-------------------------------------//
// Closed-bar inputs
//-------------------------------------//
avgVol = average[volLen](volume)
atrRaw = averagetruerange[atrLen](close)


atrV   = atrRaw[1] * atrMult
warmUp = max(volLen, atrLen) + scanBack + 2


IF barindex > warmUp THEN


   // Three consecutive candles of the same colour, at least one of them on
   // above average volume. On the closed-bar engine those are bars 1, 2 and 3.
   bearRun = 0
   IF close[1] < open[1] AND close[2] < open[2] AND close[3] < open[3] THEN
      bearRun = 1
   ENDIF


   bullRun = 0
   IF close[1] > open[1] AND close[2] > open[2] AND close[3] > open[3] THEN
      bullRun = 1
   ENDIF


   hotVol = 0
   IF volume[1] > avgVol[1] OR volume[2] > avgVol[2] OR volume[3] > avgVol[3] THEN
      hotVol = 1
   ENDIF


   //-------------------------------------//
   // Supply zone (bearish impulse)
   // The zone is anchored to the last bullish candle found within scanBack
   // bars: that candle is where the sellers took over. Its bar index is stored
   // as well, so the rectangle starts where the imbalance was created and not
   // where it was spotted.
   //-------------------------------------//
   IF bearRun = 1 AND hotVol = 1 AND cntBear = 0 THEN
      flowDelta = 0
      found     = 0
      origin    = 0


      FOR iSc = 0 TO scanBack DO
         IF found = 0 THEN
            IF close[iSc+1] > open[iSc+1] THEN
               found  = 1
               origin = iSc
            ELSIF close[iSc+1] < open[iSc+1] THEN
               flowDelta = flowDelta - volume[iSc+1]
            ELSE
               flowDelta = flowDelta + volume[iSc+1]
            ENDIF
         ENDIF
      NEXT


      // No bullish candle within the scan window means no origin, no zone.
      IF found = 1 THEN
         cntBear = 1
         nSup    = nSup + 1
         $spBot[nSup] = low[origin+1]
         $spTop[nSup] = low[origin+1] + atrV
         $spDlt[nSup] = flowDelta
         $spLft[nSup] = barindex - 1 - origin
      ENDIF
   ENDIF


   IF cntBear >= 1 THEN
      cntBear = cntBear + 1
   ENDIF
   IF cntBear >= coolBars THEN
      cntBear = 0
   ENDIF


   //-------------------------------------//
   // Demand zone (bullish impulse)
   //-------------------------------------//
   IF bullRun = 1 AND hotVol = 1 AND cntBull = 0 THEN
      flowDelta = 0
      found     = 0
      origin    = 0


      FOR iSc = 0 TO scanBack DO
         IF found = 0 THEN
            IF close[iSc+1] < open[iSc+1] THEN
               found  = 1
               origin = iSc
            ELSIF close[iSc+1] > open[iSc+1] THEN
               flowDelta = flowDelta + volume[iSc+1]
            ELSE
               flowDelta = flowDelta - volume[iSc+1]
            ENDIF
         ENDIF
      NEXT


      IF found = 1 THEN
         cntBull = 1
         nDem    = nDem + 1
         $dmTop[nDem] = high[origin+1]
         $dmBot[nDem] = high[origin+1] - atrV
         $dmDlt[nDem] = flowDelta
         $dmLft[nDem] = barindex - 1 - origin
      ENDIF
   ENDIF


   IF cntBull >= 1 THEN
      cntBull = cntBull + 1
   ENDIF
   IF cntBull >= coolBars THEN
      cntBull = 0
   ENDIF


   //-------------------------------------//
   // Invalidation: a close above a supply top, or below a demand bottom,
   // removes the zone. Compacting in place is safe because the write index
   // never runs ahead of the read index.
   //-------------------------------------//
   kZ = 0
   FOR iZ = 1 TO nSup DO
      IF close[1] <= $spTop[iZ] THEN
         kZ = kZ + 1
         $spTop[kZ] = $spTop[iZ]
         $spBot[kZ] = $spBot[iZ]
         $spDlt[kZ] = $spDlt[iZ]
         $spLft[kZ] = $spLft[iZ]
      ENDIF
   NEXT
   nSup = kZ


   kZ = 0
   FOR iZ = 1 TO nDem DO
      IF close[1] >= $dmBot[iZ] THEN
         kZ = kZ + 1
         $dmTop[kZ] = $dmTop[iZ]
         $dmBot[kZ] = $dmBot[iZ]
         $dmDlt[kZ] = $dmDlt[iZ]
         $dmLft[kZ] = $dmLft[iZ]
      ENDIF
   NEXT
   nDem = kZ


   //-------------------------------------//
   // Overlapping supply zones: a zone is dropped when another zone has its
   // top inside it. The scan deletes in place and restarts the inner search
   // after every deletion. That order matters: a single marking pass over the
   // whole list is not the same thing, because it would also drop a zone whose
   // only witness has already been deleted. Keep the loop as it is.
   //-------------------------------------//
   iZ = 1
   WHILE iZ <= nSup DO
      gone = 0
      jZ   = 1
      WHILE jZ <= nSup AND gone = 0 DO
         IF jZ <> iZ AND $spTop[jZ] < $spTop[iZ] AND $spTop[jZ] > $spBot[iZ] THEN
            IF iZ < nSup THEN
               FOR qZ = iZ TO nSup - 1 DO
                  $spTop[qZ] = $spTop[qZ+1]
                  $spBot[qZ] = $spBot[qZ+1]
                  $spDlt[qZ] = $spDlt[qZ+1]
                  $spLft[qZ] = $spLft[qZ+1]
               NEXT
            ENDIF
            nSup = nSup - 1
            gone = 1
         ENDIF
         jZ = jZ + 1
      WEND
      IF gone = 0 THEN
         iZ = iZ + 1
      ENDIF
   WEND


   // Cap: the oldest zone is dropped first
   WHILE nSup > zoneMax DO
      FOR qZ = 1 TO nSup - 1 DO
         $spTop[qZ] = $spTop[qZ+1]
         $spBot[qZ] = $spBot[qZ+1]
         $spDlt[qZ] = $spDlt[qZ+1]
         $spLft[qZ] = $spLft[qZ+1]
      NEXT
      nSup = nSup - 1
   WEND


   //-------------------------------------//
   // Overlapping demand zones: same idea, tested against the bottom edge
   //-------------------------------------//
   iZ = 1
   WHILE iZ <= nDem DO
      gone = 0
      jZ   = 1
      WHILE jZ <= nDem AND gone = 0 DO
         IF jZ <> iZ AND $dmBot[jZ] < $dmTop[iZ] AND $dmBot[jZ] > $dmBot[iZ] THEN
            IF iZ < nDem THEN
               FOR qZ = iZ TO nDem - 1 DO
                  $dmTop[qZ] = $dmTop[qZ+1]
                  $dmBot[qZ] = $dmBot[qZ+1]
                  $dmDlt[qZ] = $dmDlt[qZ+1]
                  $dmLft[qZ] = $dmLft[qZ+1]
               NEXT
            ENDIF
            nDem = nDem - 1
            gone = 1
         ENDIF
         jZ = jZ + 1
      WEND
      IF gone = 0 THEN
         iZ = iZ + 1
      ENDIF
   WEND


   WHILE nDem > zoneMax DO
      FOR qZ = 1 TO nDem - 1 DO
         $dmTop[qZ] = $dmTop[qZ+1]
         $dmBot[qZ] = $dmBot[qZ+1]
         $dmDlt[qZ] = $dmDlt[qZ+1]
         $dmLft[qZ] = $dmLft[qZ+1]
      NEXT
      nDem = nDem - 1
   WEND


ENDIF


//-------------------------------------//
// Drawing: every surviving zone, from its origin candle to the right edge.
// The label is placed to the RIGHT of the rectangle rather than inside it:
// rectangle width is measured in bars and text size in pixels, so a caption
// sitting inside the box spills out of it as soon as you zoom out.
//-------------------------------------//
rightX = barindex + extRight


IF islastbarupdate THEN


   FOR iZ = 1 TO nSup DO
      DRAWRECTANGLE($spLft[iZ], $spBot[iZ], rightX, $spTop[iZ]) COLOURED(supR, supG, supB, edgeA) FILLCOLOR(supR, supG, supB, fillA)
      IF showLbl = 1 THEN
         supVol = abs($spDlt[iZ])
         supMid = ($spTop[iZ] + $spBot[iZ]) / 2
         DRAWTEXT("#supVol#", rightX + 4, supMid) COLOURED(supR, supG, supB, 255)
      ENDIF
   NEXT


   FOR iZ = 1 TO nDem DO
      DRAWRECTANGLE($dmLft[iZ], $dmBot[iZ], rightX, $dmTop[iZ]) COLOURED(demR, demG, demB, edgeA) FILLCOLOR(demR, demG, demB, fillA)
      IF showLbl = 1 THEN
         demVol = abs($dmDlt[iZ])
         demMid = ($dmTop[iZ] + $dmBot[iZ]) / 2
         DRAWTEXT("#demVol#", rightX + 4, demMid) COLOURED(demR, demG, demB, 255)
      ENDIF
   NEXT


ENDIF


RETURN
Conclusion
What makes this indicator worth the panel space is the question it asks. Volume oscillators measure activity; this one measures leftovers — the imbalances that were created and have not yet been resolved. That is a stock, not a flow, and it behaves differently: it holds a level for a long time and then steps, because something concrete happened on the chart. Read the steps and the side, not the wiggle, and it will tell you which way the unfinished business is leaning.