




More from ProRealCode
ProRealCode - Trading & Coding with ProRealTime™



Market Phase
May 27, 2019, 9:41 AM
Indicators
10 Comments
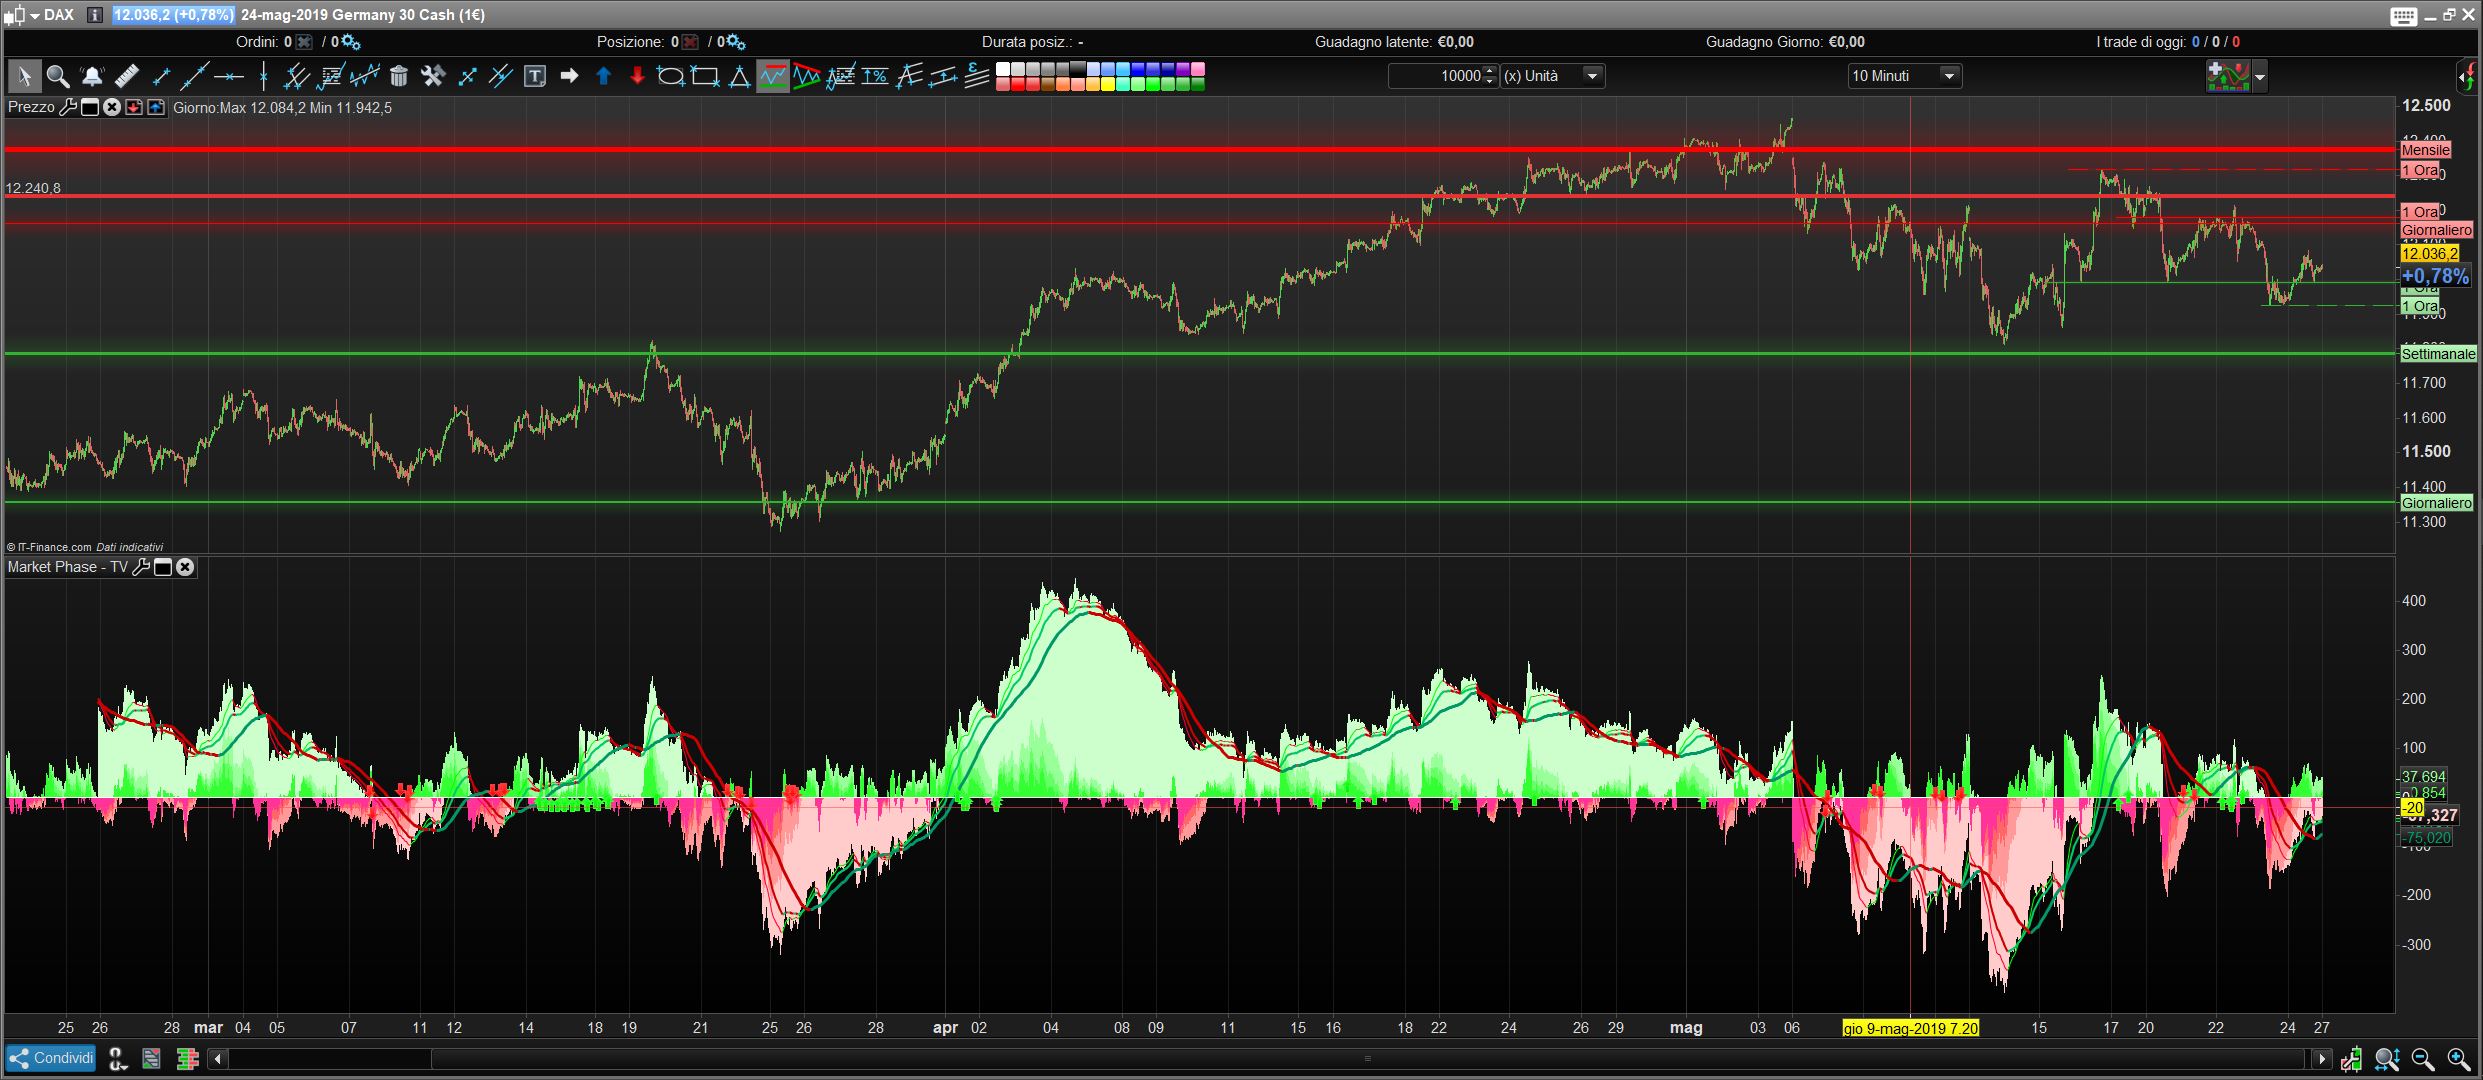
Inspired by a script seen on TradingView, I translated and adapted this indicator.
It shows the relation of price against different period moving averages.
The arrows indicates possible retracements in a general trend direction, so they can be used as entry point.
No ground breaking math here, but I am finding very useful and some algo based on it is giving good results in demo live.
// This indicator shows the relation of price against different period ma's.
// When put in daily Timeframe it gives the 1400 Day (= 200 Weekly) and the 200 ,100 an 50 Daily.
// Features:
// - The lines show the 200,100 and 50 ma in relation to the 1400 ma.
// - The  arrows indicate possible (retracement) entry points
// Coded by AlexF

ma50=close-ExponentialAverage[50](close)
ma100=close-ExponentialAverage[100](close)
ma200=close-Average[200](close)
ma1400=close-Average[1400](close)
dma50=ma1400-ma50
dma100=ma1400-ma100
dma200=ma1400-ma200

if dma50<dma50[1] and dma100<dma100[1] and dma200<dma200[1] and ma50<0 and ma100<0 and ma200<0 and ma1400<0 then
trend=-1
elsif dma50>dma50[1] and dma100>dma100[1] and dma200>dma200[1] and ma50>0 and ma100>0 and ma200>0 and ma1400>0 then
trend=1
elsif trend<>1 or trend<>-1 then
trend=0
endif

if trend=-1 and ma50 crosses under 0 then
drawarrowdown(barindex,ma50+5*pipsize)coloured(255,0,0)
endif

if trend=1 and ma50 crosses over 0 then
drawarrowup(barindex,ma50-5*pipsize)coloured(0,255,0)
endif

return ma1400 as "1400 phase",ma200 as "200 phase", ma100 as "100 phase", ma50 as "50 phase", dma50 as "50", dma100 as "100", dma200 as "200", 0 as "zero"
Download
Filename:
Market-Phase.itf
Downloads:
260
Master
This author is like an anonymous function, present but not directly identifiable. More details on this code architect as soon as they exit 'incognito' mode.
Author’s Profile
Loading...