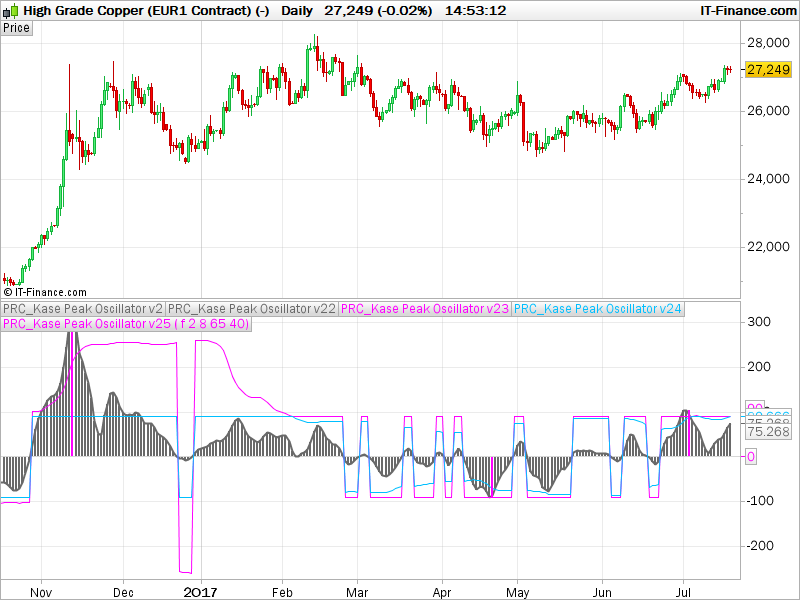
The Kase Peak Oscillator technical indicator was developed by Cynthia Kase.
The Kase Peak Oscillator indicator algorithm combines an Average True Range indicator and a Standard Deviation volatility indicator.
The logarithmic models used better reflect the true nature of the market and allow the indicator to automatically adapt to cycle time and volatility.
Second version of this indicator already in the library, but this time converted from a more advanced code translated from MT4 code, by a request in forums.
|
1 2 3 4 5 6 7 8 9 10 11 12 13 14 15 16 17 18 19 20 21 22 23 24 25 26 27 28 29 30 31 32 33 34 35 36 37 38 39 40 41 42 43 44 45 46 47 48 49 50 51 52 53 54 55 56 57 58 59 60 61 62 63 64 65 66 67 68 69 |
//PRC_Kase Peak Oscillator V2 | indicator //19.07.2017 //Nicolas @ www.prorealcode.com //Sharing ProRealTime knowledge //translated from MT4 code // --- settings //kpoDeviations = 2.0 // Kase peak oscillator deviations //kpoShortCycle = 8 // Kase peak oscillator short cycle //kpoLongCycle = 65 // Kase peak oscillator long cycle //kpoSensitivity = 40 //allPeaksMode = 0 //1=true ; 0=false // --- end of settings if barindex>kpoLongCycle*2 then ccLog = Log(Close[0]/Close[1]) ccDev = std[9](ccLog) avg = average[30](ccDev) if (avg>0) then max1 = 0 maxs = 0 for k = kpoShortCycle to kpoLongCycle-1 do max1 = Max(Log(High[0]/Low[0+k])/Sqrt(k),max1) maxs = Max(Log(High[0+k]/Low[0])/Sqrt(k),maxs) next x1 = max1/avg xs = maxs/avg endif xp = kpoSensitivity*(average[3](x1)-average[3](xs)) xpAbs = Abs(xp) kpoBuffer = xp kphBuffer = xp tmpVal = average[50](xpAbs)+kpoDeviations*std[50](xpAbs) maxVal = Max(90.0,tmpVal) minVal = Min(90.0,tmpVal) if (kpoBuffer > 0) then kpdBuffer = maxVal kpmBuffer = minVal else kpdBuffer = -maxVal kpmBuffer = -minVal endif kppbuffer=0 if (not allPeaksMode) then if (kpoBuffer[1]>0 and kpoBuffer[1]>kpoBuffer[0] and kpoBuffer[1]>=kpoBuffer[2] and kpoBuffer[1]>= maxVal) then kppBuffer = kpoBuffer[1] endif if (kpoBuffer[1]<0 and kpoBuffer[1]<kpoBuffer[0] and kpoBuffer[1]<=kpoBuffer[2] and kpoBuffer[1]<=-maxVal) then kppBuffer = kpoBuffer[1] endif else if (kpoBuffer[1]>0 and kpoBuffer[1]>kpoBuffer[0] and kpoBuffer[1]>=kpoBuffer[2]) then kppBuffer = kpoBuffer[1] endif if (kpoBuffer[1]<0 and kpoBuffer[1]<kpoBuffer[0] and kpoBuffer[1]<=kpoBuffer[2]) then kppBuffer = kpoBuffer[1] endif endif endif return kphBuffer coloured(105,105,105) style(histogram), kpoBuffer coloured(105,105,105) style(line,2), kpdBuffer coloured(255,0,255), kpmBuffer coloured(0,191,255), kppBuffer coloured(255,0,255) style(histogram,2) |
Share this
No information on this site is investment advice or a solicitation to buy or sell any financial instrument. Past performance is not indicative of future results. Trading may expose you to risk of loss greater than your deposits and is only suitable for experienced investors who have sufficient financial means to bear such risk.
ProRealTime ITF files and other attachments :
Find other exclusive trading pro-tools on ![]()
PRC is also on YouTube, subscribe to our channel for exclusive content and tutorials


Thank you Nicolas, surely you can’t sleep more than 4 hours per night? 🙂
Discussions going on re Kase on the Link below (copy and paste into browser) from post #40945 onwards so you don’t have to read it all!.
It’s more of a monologue (me!) up to now … so please join in? 🙂
https://www.prorealcode.com/topic/kase-peak-oscillator-kase-cd-and-kase-permission/#post-41360
Ha I just looked back and I only did two posts in the Thread above; I’ve been dreaming about Kase overnight as I was convinced I’d done 3 or 4 posts on Kase! 🙂
Thanks Nicolas.
This looks very interresting, despite I am not sure I fully understand it yet. (v23 and v24 not so clear for me. v25 is just to show peaks in pink if I understand well, so it could be valuable in the “allPeaksMode” on to highlight the “unfiltered” peaks (those which don’t appear in the “allPeaksMode” on) in a different color.
Moreover, would it be possible to code as well the “little brother” : KaseCD. “KCD is the PeakOscillator minus its own average”.
Many thanks and in advance again Nicolas.
The KaseCD should also be coded, it is discussed in the Bard’s topic here: https://www.prorealcode.com/topic/kase-peak-oscillator-kase-cd-and-kase-permission/
Salve sig. Nicolas…sono andato ad inserire l’indicatore nella piattaforma ma mi da Errore nella programmazione…………Errori di sintassi: Definisci la variabile kpolongcycle,kposhortcycle,kposensitivity,kpodeviations e allpeaksmode. Puo’ aiutarmi? Grazie.
Please download the file or delete all // before these variables names.
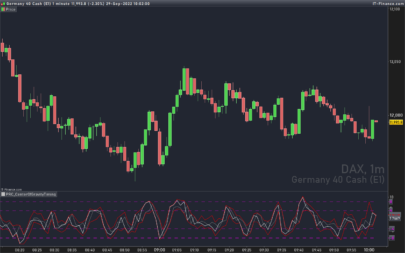
Hi, I can’t understand from the code why the histogram turns violet in certain points…
Violet histogram is plotted with “kppBuffer” variable. Calculated between lines 51 to 66.
Can anyone explain this code to me?
Log(Close[0]/Close[1]) Does Close[0] mean the current index and Close[1] means the previous index?
Yes.
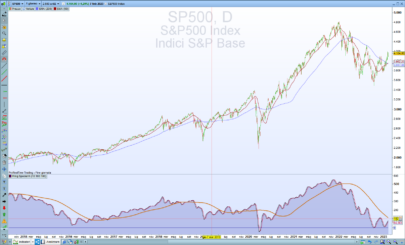
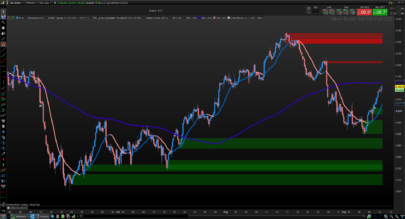
Kase Peak Out using Williams High Volatility Vix Fix Formula: (This finds market tops and bottoms based on Volatility)
Kase PO William’s Vix Fix:
(Add PRT Code not Working)
//PRC_Kase Peak Oscillator V2 | indicator
//19.07.2017
//Nicolas @ http://www.prorealcode.com
//Sharing ProRealTime knowledge
//translated from MT4 code
// — settings
kpoDeviations= 2.0 // Kase peak oscillator deviations
kpoShortCycle= 8 // Kase peak oscillator short cycle
kpoLongCycle = 65 // Kase peak oscillator long cycle
kpoSensitivity = 40
allPeaksMode = 0 //1=true ; 0=false
// — end of settings
pd = 10
if barindex>kpoLongCycle*2 then
//ccLog = Log(Close[0]/Close[1])
wvf = ((highest[pd](close)-low)/(highest[pd](close)))
ccWVF = wvf
ccDev = std[9](ccWVF)
avg = average[30](ccDev)
if (avg>0) then
max1 = 0
maxs = 0
for k = kpoShortCycle to kpoLongCycle-1 do
max1 = Max(Log(High[0]/Low[0+k])/Sqrt(k),max1)
maxs = Max(Log(High[0+k]/Low[0])/Sqrt(k),maxs)
next
x1 = max1/avg
xs = maxs/avg
endif
xp= kpoSensitivity*(average[3](x1)-average[3](xs))
xpAbs = Abs(xp)
kpoBuffer = xp
kphBuffer = xp
tmpVal = average[50](xpAbs)+kpoDeviations*std[50](xpAbs)
maxVal = Max(90.0,tmpVal)
minVal = Min(90.0,tmpVal)
if (kpoBuffer > 0) then
kpdBuffer = maxVal
kpmBuffer = minVal
else
kpdBuffer = -maxVal
kpmBuffer = -minVal
endif
kppbuffer=0
if (not allPeaksMode) then
if (kpoBuffer[1]>0 and kpoBuffer[1]>kpoBuffer[0] and kpoBuffer[1]>=kpoBuffer[2] and kpoBuffer[1]>= maxVal) then
kppBuffer = kpoBuffer[1]
endif
if (kpoBuffer[1]<0 and kpoBuffer[1]<kpoBuffer[0] and kpoBuffer[1]<=kpoBuffer[2] and kpoBuffer[1]0 and kpoBuffer[1]>kpoBuffer[0] and kpoBuffer[1]>=kpoBuffer[2]) then
kppBuffer = kpoBuffer[1]
endif
if (kpoBuffer[1]<0 and kpoBuffer[1]<kpoBuffer[0] and kpoBuffer[1]<=kpoBuffer[2]) then
kppBuffer = kpoBuffer[1]
endif
endif
endif
return kphBuffer coloured(105,105,105) style(histogram), kpoBuffer coloured(105,105,105) style(line,2), kpdBuffer coloured(255,0,255), kpmBuffer coloured(0,191,255), kppBuffer coloured(255,0,255) style(histogram,2) as "kpp buffer"
//105,105,105=grey
//255,0,255=pink
//0,191,255=blue
*Correction:
if barindex>kpoLongCycle*2 then
//ccLog = Log(Close[0]/Close[1])
ccWVF = ((highest[pd](close)-low)/(highest[pd](close)))
ccDev = std[9](ccWVF)
Better colour scheme with Green Peak Outs to avoid confusion with KPO pink Peak Outs:
return kphBuffer coloured(105,105,105) style(histogram), kpoBuffer coloured(105,105,105) style(line,2), kpdBuffer coloured(124,252,0), kpmBuffer coloured(0,191,255), kppBufferPO coloured(0,255,0) style(histogram,2) as “kpp buffer”
//105,105,105=grey
//255,0,255 =old pink Histogram PO
//0,191,255 =blue
//124,252,0 =green line
//0,255,0 =green Histogram PO