Intraday Intensity Index

v10.3
Intraday Intensity Index

DEFINITION of ‘Intraday Intensity Index’
A volume based indicator that depicts the flow of funds for a security according to where it closes in its high and low range.

This indicator was developed by Dave Bostian. Its goal is to track the activity of institutional block traders.

A technical indicator that approximates the volume of trading for a specified security in a given day. It is designed to help track the activity of institutional block traders and is calculated by subtracting the day’s high and low from double the closing price, divided by the volume and multiplied by the difference between the high and the low.

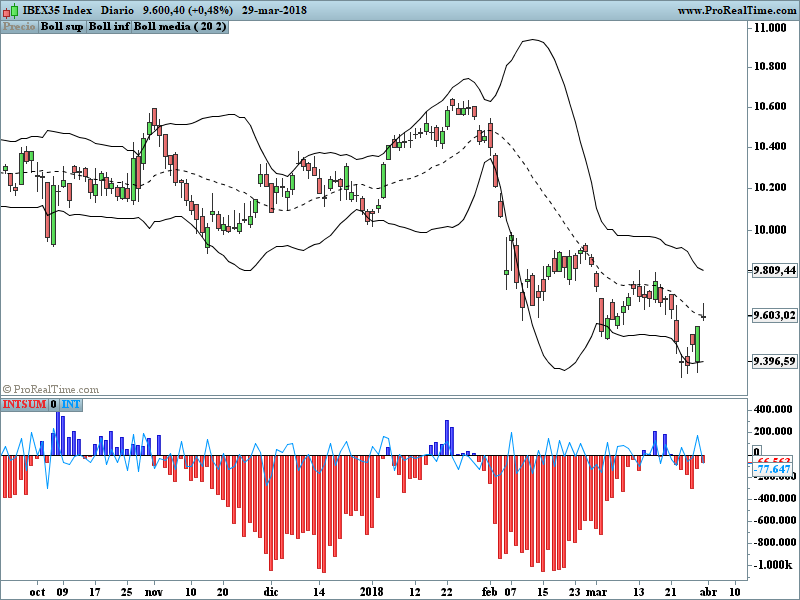
John Bollinger advised to use this indicator as a confirmation tool with the Bollinger Bands.

this indicator is an adaptation for the platform Prorealtime v10.3 of a Tradingview code.

If price tags the lower BBand, look for IIIX has positive values to enter a trade.
Conversely; If price tags the upper BBand, look for IIIX has negative values to exit.

Share this

Risk disclosure:

No information on this site is investment advice or a solicitation to buy or sell any financial instrument. Past performance is not indicative of future results. Trading may expose you to risk of loss greater than your deposits and is only suitable for experienced investors who have sufficient financial means to bear such risk.

ProRealTime ITF files and other attachments : How to import ITF files into ProRealTime platform?

PRC is also on YouTube, subscribe to our channel for exclusive content and tutorials

  1. Carlos Garcia • 04/03/2018 #

    If price tags the lower BBand, look for IIIX has positive values to enter a trade.
    Conversely; If price tags the upper BBand, look for IIIX has negative values to exit.
    A qué te refieres con esto? cuando el precio llega a la banda superior o inferior de las BB Bands esperar a que se den 7 barras positivas o negativas dependiendo, para abrir trade?
    Gracias y un saludo

avatar
Register or

Likes

avatar avatar avatar avatar avatar avatar avatar avatar
Related users ' posts
Real Pro Great work gabri. I have this coded on Amibroker and I have done lots of backtesting but ne...
gabri Hi Real Pro, this indicator assists novices of the Wyckoff system. Wyckoff himself thought t...
tatie hi Gabri, I just came across the wyckoff method and was looking for the weiss wave indica...
Jesper Great share!
eckaw Hi Nicolas, I'm using this indicator when there is confluence over 3 different timeframes (5...
Nicolas Yes it is indeed possible. Create a topic in the screener forum and explain what you need an...
KyleReed i've been using this for a few days now and it's really helped me a lot in timing the execut...
Ben Ji Bonjour Nicolas, je souhaiterais exploiter votre screener sur la plateforme TradingView. Pou...
Nicolas Non désolé, je ne fournis pas de support pour cette plateforme.
luxrun Thanks, bolsatrilera, for a very good and solid screener!
luxrun sorry... indicator!
Lily Rios Gracias por el indicador, tengo una pregunta necesito programar un screener de valores que e...
mmoren44 no esta el color azul (Fade //Blue), No aparece en las barras el color azul.
larouedegann changer fade coloured (0,0,255)
Nicolas 1. yes 2. maybe yes?! 3. why not?
patapouf Bonjour Nicolas. Je viens de découvrir cet indicateur, que je trouve bien intéressant Mais...
Nicolas Tu peux modifier le paramètre "scalefactor" pour adapter la hauteur des barres à ton graphiq...
bolsatrilera EM MONEY FLOW INDEX + ALERTS //@version=3 // on platform Tradingview by DreamsDefined //a...
Carlos Garcia Enorme. Gracias!
Andraxx Buen indicador.... Gracias
TAC Bolsa All indicators share some code of other TAC indicators that improve the functioning of this ...
ramonjp Hi Tac, Great job. Please, can you provide latest code version of this indicator without ...
Tze Khai Lim Hi Tac, pls provide latest code version of this indicator. Thanks in advance.
TAC Bolsa Estas equivocado al 99,9%. La correlación entre las series de precios y volúmenes las des...
Domenec Si hablas de un indice regional como el Ibex es posible que sea asi yo nunca lo he operado y...
TAC Bolsa Regional de Mostoles, en una cosa tienes razón mejor dejarlo aquí...
Xusto Hello, Fully Agree, I will update it with your advice. Btw Can would you like share you co...
Niklas johansson hägglund do you now if it's possible to use this strategy with this code in tradingview also?
Alexander9 This code for metastock ?, can for amibroker . Thanks
TACBOLSA
6 years ago
luxrun Thank you so much Tac BOLSA, I can not post the picture tonight I'll try tomorrow. I loaded ...
TAC Bolsa A new version of TAC Volume HPI DIV10.4 is available. that marks the divergence In the fo...
Raymundo Buenas tardes. Como puedo descargar algunos indicadores de esta pagina ?
mangiaragni Buongiorno io non riesco a visualizzare nessun tipo di volume , mi torna sempre una linea dr...
Nicolas Assicurati che lo strumento che stai guardando abbia dei volumi! È il caso?
Thally Thanks for the quick response Nicholas. Would you have any idea how to resolve. Manually ref...
Thally Do you think adjusting the below code might help? newperiod = minuteminute[1] if newperi...
Nicolas There is no "second" instruction.
YvesRobert Merci beaucoup Nicolas. Existe t'il un petit programme qui permet de tracer sur la graphe en...
Nicolas Oui il y a celui ci: https://market.prorealcode.com/product/prt-renko/?lang=fr
YvesRobert Bonjour Nicolas, j'ai une question technique à te poser. Je visualise souvent le cours en RE...
GenesisEX Thank you all for your contributions this is a great submission. Thanks for your inputs.
tino Bonjour nicolas. Je ne parviens pas à recopier le screener de l'indicateur. Auriez vous la g...
Nicolas Quel screener svp? C'est dans un des sujets du forum? Merci de fournir le lien.
gabri Ha ragione in computer, ho sbagliato io BullAD = summation[period](ADvolbull*((Close-Low) –...
marcov66 Perfetto! Funziona. Grazie di tutto!
SkrHugo Bonjour, J'essaye d'utiliser le script avec le graphique renko mais sa ne marche pas, quelq...

Top