

ICT Donchian Smart Money Structure (Expo)
█ Concept Overview
The Inner Circle Trader (ICT) methodology is focused on understanding the actions and implications of the so-called “smart money” – large institutions and professional traders who often influence market movements. Key to this is the concept of market structure and how it can provide insights into potential price moves.
Over time, however, there has been a notable shift in how some traders interpret and apply this methodology. Initially, it was designed with a focus on the fractal nature of markets. Fractals are recurring patterns in price action that are self-similar across different time scales, providing a nuanced and dynamic understanding of market structure.
However, as the ICT methodology has grown in popularity, there has been a drift away from this fractal-based perspective. Instead, many traders have started to focus more on pivot points as their primary tool for understanding market structure.
Pivot points provide static levels of potential support and resistance. While they can be useful in some contexts, relying heavily on them could provide a skewed perspective of market structure. They offer a static, backward-looking view that may not accurately reflect real-time changes in market sentiment or the dynamic nature of markets.
This shift from a fractal-based perspective to a pivot point perspective has significant implications. It can lead traders to misinterpret market structure and potentially make incorrect trading decisions.
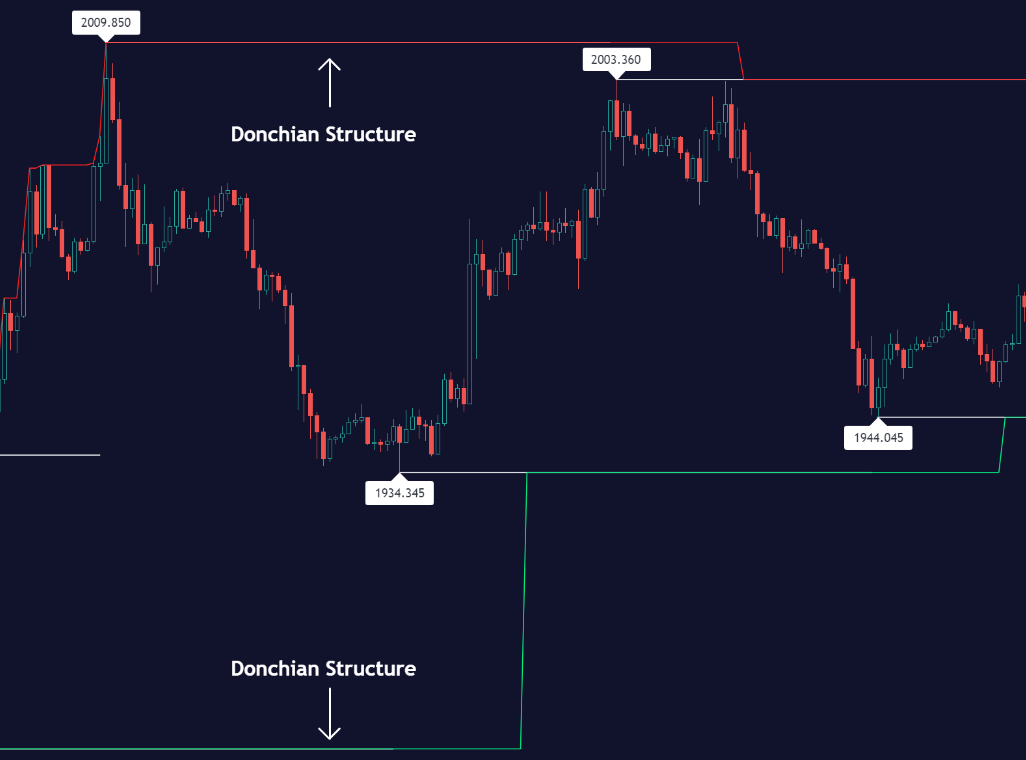
To highlight this issue, you’ve developed a Donchian Structure indicator that mirrors the use of pivot points. The Donchian Channels are formed by the highest high and the lowest low over a certain period, providing another representation of potential market extremes. The fact that the Donchian Structure indicator produces the same results as pivot points underscores the inherent limitations of relying too heavily on these tools.
While the Donchian Structure indicator or pivot points can be useful tools, they should not replace the original, fractal-based perspective of the ICT methodology. These tools can provide a broad overview of market structure but may not capture the intricate dynamics and real-time changes that a fractal-based approach can offer.
It’s essential for traders to understand these differences and to apply these tools correctly within the broader context of the ICT methodology and the Smart Money Concept Structure. A well-rounded approach that incorporates fractals, along with other tools and forms of analysis, is likely to provide a more accurate and comprehensive understanding of market structure.
█ Smart Money Concept – Misunderstandings
The Smart Money Concept is a popular concept among traders, and it’s based on the idea that the “smart money” – typically large institutional investors, market makers, and professional traders – have superior knowledge or information, and their actions can provide valuable insight for other traders.
One of the biggest misunderstandings with this concept is the belief that tracking smart money activity can guarantee profitable trading.
█ Here are a few common misconceptions:
- Following Smart Money Equals Guaranteed Success: Many traders believe that if they can follow the smart money, they will be successful. However, tracking the activity of large institutional investors and other professionals isn’t easy, as they use complex strategies, have access to information not available to the public, and often intentionally hide their moves to prevent others from detecting their strategies.
- Instantaneous Reaction and Results: Another misconception is that market movements will reflect smart money actions immediately. However, large institutions often slowly accumulate or distribute positions over time to avoid moving the market drastically. As a result, their actions might not produce an immediate noticeable effect on the market.
- Smart Money Always Wins: It’s not accurate to assume that smart money always makes the right decisions. Even the most experienced institutional investors and professional traders make mistakes, misjudge market conditions, or are affected by unpredictable events.
- Smart Money Activity is Transparent: Understanding what constitutes smart money activity can be quite challenging. There are many indicators and metrics that traders use to try and track smart money, such as the COT (Commitments of Traders) reports, Level II market data, block trades, etc. However, these can be difficult to interpret correctly and are often misleading.
- Assuming Uniformity Among Smart Money: ‘Smart Money’ is not a monolithic entity. Different institutional investors and professional traders have different strategies, risk tolerances, and investment horizons. What might be a good trade for a long-term institutional investor might not be a good trade for a short-term professional trader, and vice versa.
█ Market Structure
The Smart Money Concept Structure deals with the interpretation of price action that forms the market structure, focusing on understanding key shifts or changes in the market that may indicate where ‘smart money’ (large institutional investors and professional traders) might be moving in the market.
█ Three common concepts in this regard are Change of Character (CHoCH), and Shift in Market Structure (SMS), Break of Structure (BMS/BoS).
- Change of Character (CHoCH): This refers to a noticeable change in the behavior of price movement, which could suggest that a shift in the market might be about to occur. This might be signaled by a sudden increase in volatility, a break of a trendline, or a change in volume, among other things.
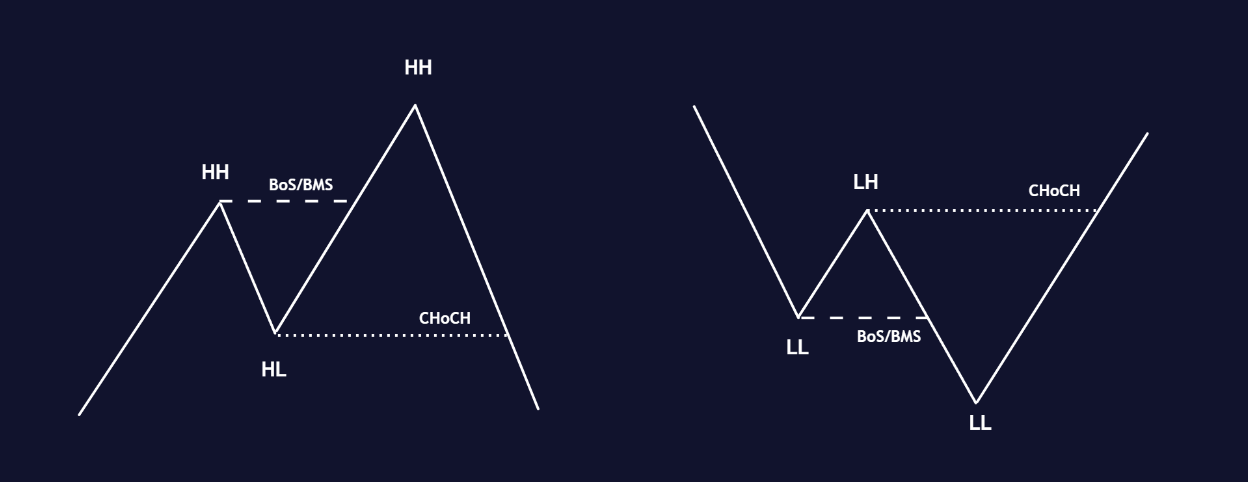
- Shift in Market Structure (SMS): This is when the overall structure of the market changes, suggesting a potential new trend. It usually involves a sequence of lower highs and lower lows for a downtrend, or higher highs and higher lows for an uptrend.

- Break of Structure (BMS/BoS): This is when a previously defined trend or pattern in the price structure is broken, which may suggest a trend continuation.

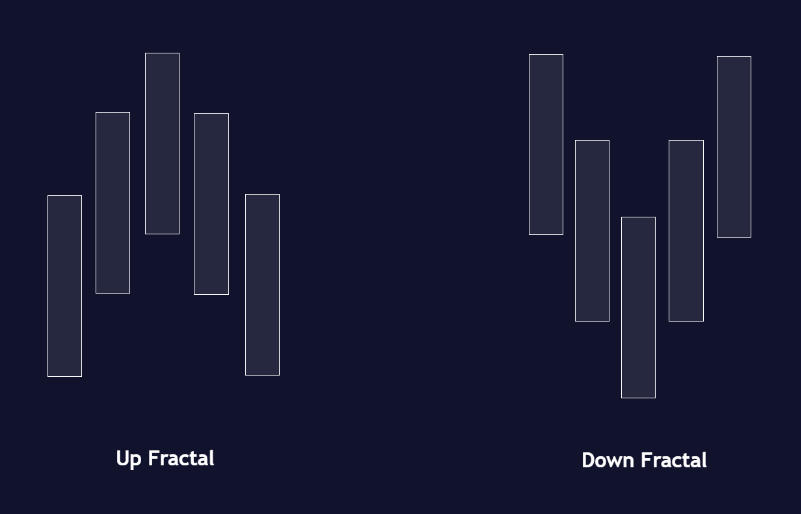
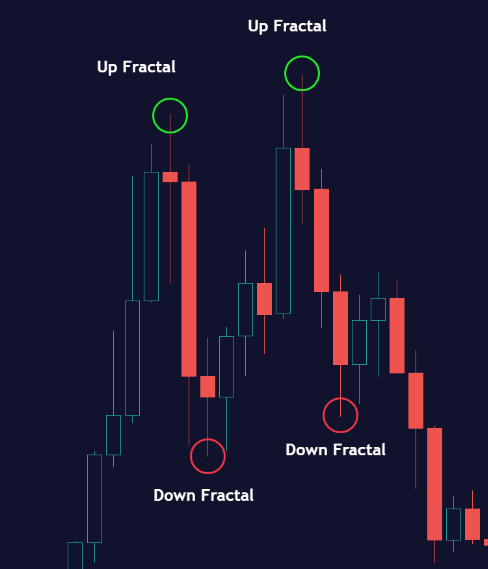
A key component of this approach is the use of fractals, which are repeating patterns in price action that can give insights into potential market reversals. They appear at all scales of a price chart, reflecting the self-similar nature of markets.
█ Market Structure – Misunderstandings
One of the biggest misunderstandings about the ICT approach is the over-reliance or incorrect application of pivot points. Pivot points are a popular tool among traders due to their simplicity and easy-to-understand nature. However, when it comes to the Smart Money Concept and trying to follow the steps of professional traders or large institutions, relying heavily on pivot points can create misconceptions and lead to confusion. Here’s why:
- Delayed and Static Information: Pivot points are inherently backward-looking because they’re calculated based on the previous period’s data. As such, they may not reflect real-time market dynamics or sudden changes in market sentiment. Furthermore, they present a static view of market structure, delineating pre-defined levels of support and resistance. This static nature can be misleading because markets are fundamentally dynamic and constantly changing due to countless variables.
- Inadequate Representation of Market Complexity: Markets are influenced by a myriad of factors, including economic indicators, geopolitical events, institutional actions, and market sentiment, among others. Relying on pivot points alone for reading market structure oversimplifies this complexity and can lead to a myopic understanding of market dynamics.
- False Signals and Misinterpretations: Pivot points can often give false signals, especially in volatile markets. Prices might react to these levels temporarily but then continue in the original direction, leading to potential misinterpretation of market structure and sentiment. Also, a trader might wrongly perceive a break of a pivot point as a significant market event, when in fact, it could be due to random price fluctuations or temporary volatility.
- Over-simplification: Viewing market structure only through the lens of pivot points simplifies the market to static levels of support and resistance, which can lead to misinterpretation of market dynamics. For instance, a trader might view a break of a pivot point as a definite sign of a trend, when it could just be a temporary price spike.
- Ignoring the Fractal Nature of Markets: In the context of the Smart Money Concept Structure, understanding the fractal nature of markets is crucial. Fractals are self-similar patterns that repeat at all scales and provide a more dynamic and nuanced understanding of market structure. They can help traders identify shifts in market sentiment or direction in real-time, providing more relevant and timely information compared to pivot points.
The key takeaway here is not that pivot points should be entirely avoided or that they’re useless. They can provide valuable insights and serve as a useful tool in a trader’s toolbox when used correctly. However, they should not be the sole or primary method for understanding the market structure, especially in the context of the Smart Money Concept Structure.
█ Fractals
Instead, traders should aim for a comprehensive understanding of markets that incorporates a range of tools and concepts, including but not limited to fractals, order flow, volume analysis, fundamental analysis, and, yes, even pivot points. Fractals offer a more dynamic and nuanced view of the market. They reflect the recursive nature of markets and can provide valuable insights into potential market reversals. Because they appear at all scales of a price chart, they can provide a more holistic and real-time understanding of market structure.
In contrast, the Smart Money Concept Structure, focusing on fractals and comprehensive market analysis, aims to capture a more holistic and real-time view of the market. Fractals, being self-similar patterns that repeat at different scales, offer a dynamic understanding of market structure. As a result, they can help to identify shifts in market sentiment or direction as they happen, providing a more detailed and timely perspective.
Furthermore, a comprehensive market analysis would consider a broader set of factors, including order flow, volume analysis, and fundamental analysis, which could provide additional insights into ‘smart money’ actions.
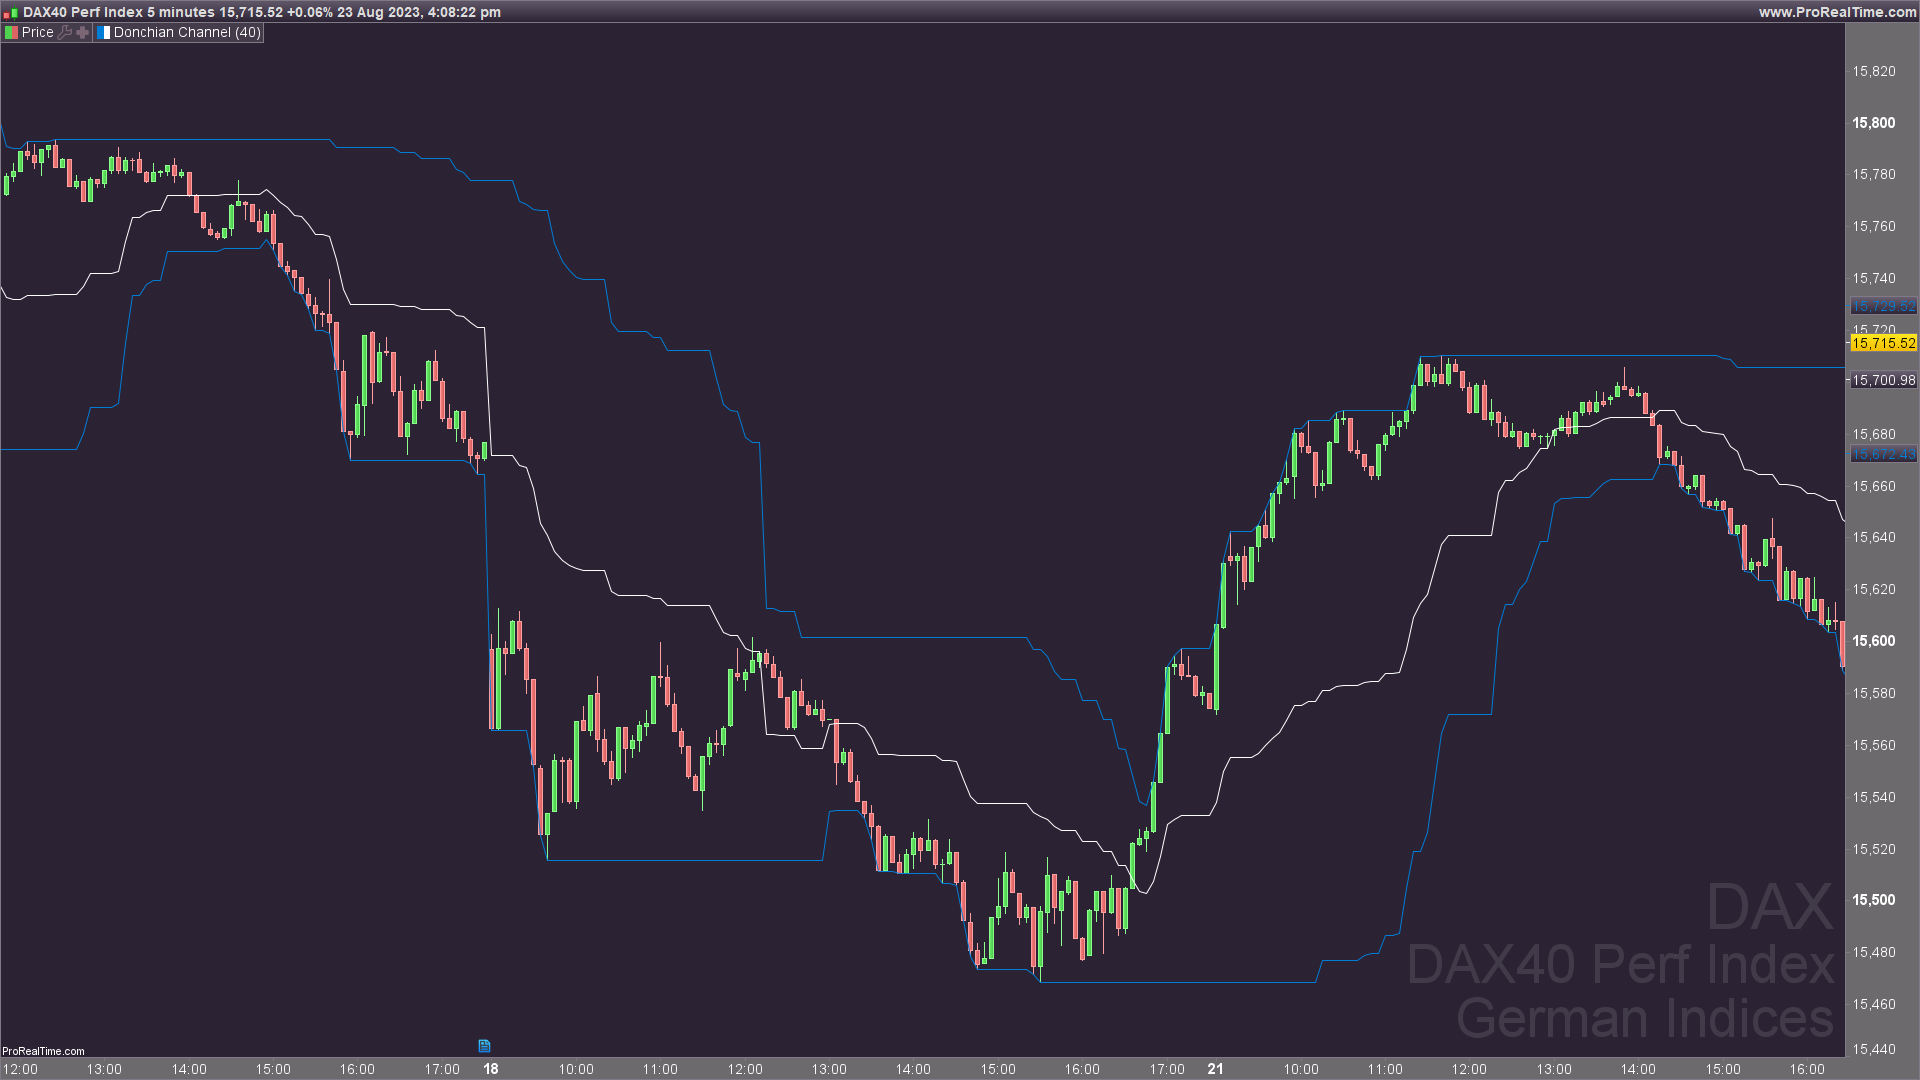
█ Donchian Structure
Donchian Channels are a type of indicator used in technical analysis to identify potential price breakouts and trends, and they may also serve as a tool for understanding market structure. The channels are formed by taking the highest high and the lowest low over a certain number of periods, creating an envelope of price action.

Donchian Channels (or pivot points) can be useful tools for providing a general view of market structure, and they may not capture the intricate dynamics associated with the Smart Money Concept Structure. A more nuanced approach, centered on real-time fractals and a comprehensive analysis of various market factors, offers a more accurate understanding of ‘smart money’ actions and market structure.
█ Here is why Donchian Structure may be misleading:
- Lack of Nuance: Donchian Channels, like pivot points, provide a simplified view of market structure. They don’t take into account the nuanced behaviors of price action or the complex dynamics between buyers and sellers that can be critical in the Smart Money Concept Structure.
- Limited Insights into ‘Smart Money’ Actions: While Donchian Channels can highlight potential breakout points and trends, they don’t necessarily provide insights into the actions of ‘smart money’. These large institutional traders often use sophisticated strategies that can’t be easily inferred from price action alone.
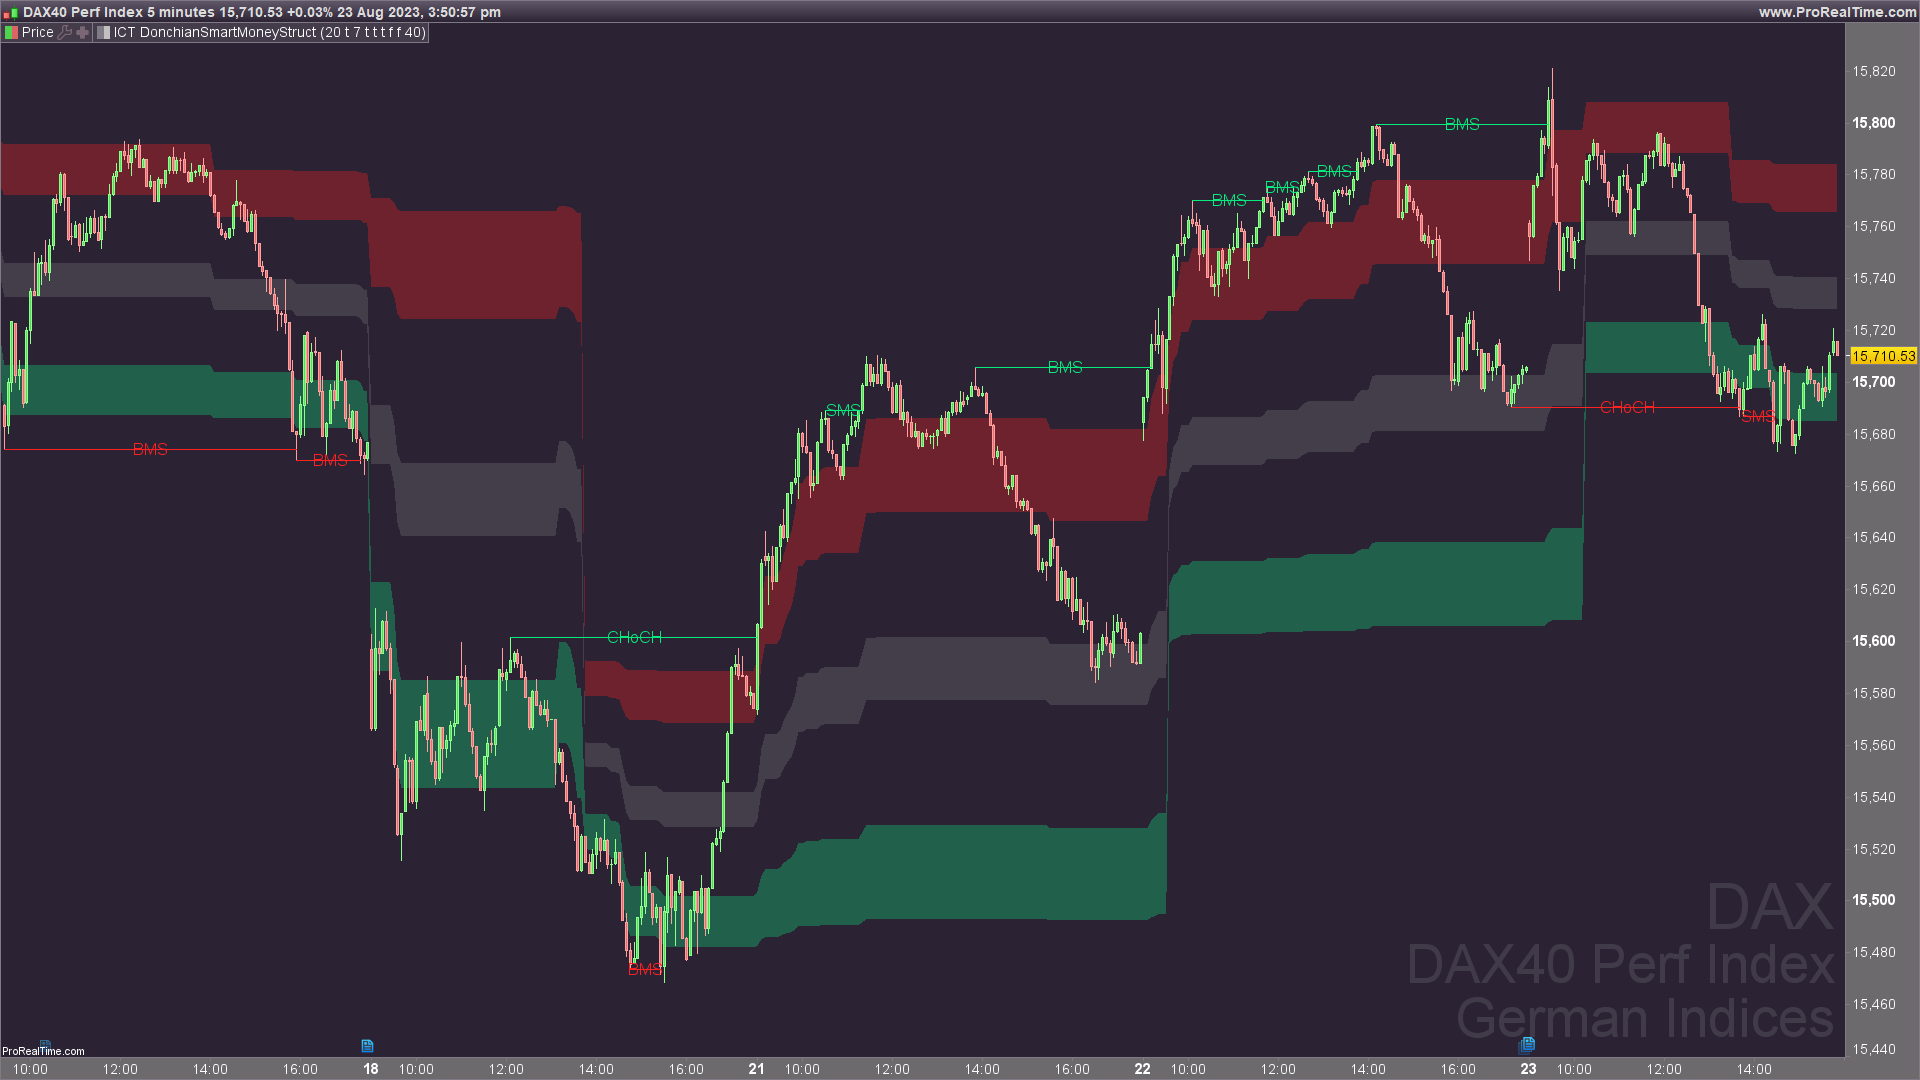
█ Indicator Overview
We have built this Donchian Structure indicator to show that it returns the same results as using pivot points. The Donchian Structure indicator can be a useful tool for market analysis. However, it should not be seen as a direct replacement or equivalent to the original Smart Money concept, nor should any indicator based on pivot points. The indicator highlights the importance of understanding what kind of trading tools we use and how they can affect our decisions.
The Donchian Structure Indicator displays CHoCH, SMS, BoS/BMS, as well as premium and discount areas. This indicator plots everything in real-time and allows for easy backtesting on any market and timeframe. A unique candle coloring has been added to make it more engaging and visually appealing when identifying new trading setups and strategies. This candle coloring is “leading,” meaning it can signal a structural change before it actually happens, giving traders ample time to plan their next trade accordingly.

█ How to use
The indicator is great for traders who want to simplify their view on the market structure and easily backtest Smart Money Concept Strategies. The added candle coloring function serves as a heads-up for structure change or can be used as trend confirmation. This new candle coloring feature can generate many new Smart Money Concepts strategies.
█ Features
Market Structure
The market structure is based on the Donchian channel, to which we have added what we call ‘Structure Response’. This addition makes the indicator more useful, especially in trending markets. The core concept involves traders buying at a discount and selling or shorting at a premium, depending on the order flow. Structure response enables traders to determine the order flow more clearly. Consequently, more trading opportunities will appear in trending markets.
Structure Candles
Structure Candles highlight the current order flow and are significantly more responsive to structural changes. They can provide traders with a heads-up before a break in structure occurs
—————–
Disclaimer
The information contained in my Scripts/Indicators/Ideas/Algos/Systems does not constitute financial advice or a solicitation to buy or sell any securities of any type. I will not accept liability for any loss or damage, including without limitation any loss of profit, which may arise directly or indirectly from the use of or reliance on such information.
All investments involve risk, and the past performance of a security, industry, sector, market, financial product, trading strategy, backtest, or individual’s trading does not guarantee future results or returns. Investors are fully responsible for any investment decisions they make. Such decisions should be based solely on an evaluation of their financial circumstances, investment objectives, risk tolerance, and liquidity needs.
My Scripts/Indicators/Ideas/Algos/Systems are only for educational purposes!
b = barindex
//~~~~~~~~~~~~~~~~~~~~~~~~~~~~~~~~~~~~~~~~~~~~~~~~~~~~~~~~~~~~~~~~~~~~~~~~~~~~~~}

// ~~ Pivots {
IF barindex >= 2*prd+1 then
 Up   = max(Up[1],high)
 Dn   = min(Dn[1],low)
 if high[prd] >= highest[(prd)*2+1](high) then
  Up = high[prd]
  barup = b[prd]
 endif

 if low[prd] <= lowest[(prd)*2+1](low)  then
  Dn = low[prd]
  bardn = b[prd]
 endif
endif
//~~~~~~~~~~~~~~~~~~~~~~~~~~~~~~~~~~~~~~~~~~~~~~~~~~~~~~~~~~~~~~~~~~~~~~~~~~~~~~}

// ~~ Structure {
if s1 then
 period = resp
else
 period = prd
endif

if Up>Up[1] then
 iUp = b
 centerBull = (iUp+iUp[1])/2
 if pos<=0 then
  if bull then
   drawtext("CHoCH",centerbull,Up[1],dialog,standard,16) coloured(8, 236, 126)
   drawsegment(barup[1],Up[1],barindex,Up[1]) coloured(8, 236, 126)
   pos = 1
  endif
 elsif pos=1 and Up>Up[1] and Up[1]=Up[period] then
  if bull then
   drawtext("SMS",centerbull,Up[1],dialog,standard,16) coloured(8, 236, 126)
   drawsegment(iup[1],Up[1],barindex,Up[1]) coloured(8, 236, 126)
   pos = 2
  endif
 elsif pos>1 and Up>Up[1] and Up[1]=Up[period] then
  if bull then
   drawtext("BMS",centerbull,Up[1],dialog,standard,16) coloured(8, 236, 126)
   drawsegment(iup[1],Up[1],barindex,Up[1]) coloured(8, 236, 126)
   pos = pos + 1
  endif
 endif

elsif Up<Up[1] then
 iUp = b-prd
endif

if Dn<Dn[1] then
 iDn = b
 centerBear = (iDn+iDn[1])/2
 if pos>=0 then
  if bear then
   drawtext("CHoCH",centerBear,Dn[1],dialog,standard,16) coloured(255, 34, 34)
   drawsegment(bardn[1],Dn[1],barindex,Dn[1]) coloured(255, 34, 34)
   pos = -1
  endif
 elsif pos=-1 and Dn<Dn[1] and Dn[1]=Dn[period] then
  if bear then
   drawtext("SMS",centerBear,Dn[1],dialog,standard,16) coloured(255, 34, 34)
   drawsegment(idn[1],Dn[1],barindex,Dn[1]) coloured(255, 34, 34)
   pos = -2
  endif
 elsif pos<-1 and Dn<Dn[1] and Dn[1]=Dn[period] then
  if bear then
   drawtext("BMS",centerBear,Dn[1],dialog,standard,16) coloured(255, 34, 34)
   drawsegment(idn[1],Dn[1],barindex,Dn[1]) coloured(255, 34, 34)
   pos = pos - 1
  endif
 endif
elsif Dn>Dn[1] then
 iDn = b-prd
endif


//~~~~~~~~~~~~~~~~~~~~~~~~~~~~~~~~~~~~~~~~~~~~~~~~~~~~~~~~~~~~~~~~~~~~~~~~~~~~~~}

// ~~ Premium & Discount {
PremiumTop   = Up-(Up-Dn)*.1
PremiumBot   = Up-(Up-Dn)*.25
DiscountTop  = Dn+(Up-Dn)*.25
DiscountBot  = Dn+(Up-Dn)*.1
MidTop       = Up-(Up-Dn)*.45
MidBot       = Dn+(Up-Dn)*.45
//~~~~~~~~~~~~~~~~~~~~~~~~~~~~~~~~~~~~~~~~~~~~~~~~~~~~~~~~~~~~~~~~~~~~~~~~~~~~~~}

// ~~ Plots {
r1=undefined
rr2=undefined
if don then
r1=Up
rr2=Dn
endif

p1=undefined
p2=undefined
d1=undefined
d2=undefined
if showPD then
p1=PremiumTop
p2=PremiumBot
d1=DiscountTop
d2=DiscountBot
m1=MidTop
m2=MidBot
endif

colorbetween(p1,p2,255, 34, 34,80)
colorbetween(d1,d2,8, 236, 126,80)
colorbetween(m1,m2,"gray",75)
//~~~~~~~~~~~~~~~~~~~~~~~~~~~~~~~~~~~~~~~~~~~~~~~~~~~~~~~~~~~~~~~~~~~~~~~~~~~~~~}

once initial = close
if Candle and barindex>length then
 DonHigh=Highest[length](up)
 DonLow=Lowest[length](dn)
 Norm      = ((close - DonLow) / (DonHigh - DonLow))
 initial = (Norm * close + ((1 - Norm*2)) * initial[1])
 FactorO = (1-Norm*2)*initial[1] //true
 FactorH = (1-Norm/2)*initial[1] //false
 FactorL = (1-Norm/2)*initial[1] //false
 FactorC = (1-Norm*2)*initial[1] //true
 outputO = (Norm*Open) + FactorO
 outputH = (Norm*High) + FactorH
 outputL = (Norm*Low) + FactorL
 outputC = (Norm*Close) + FactorC

 condopen = outputH>open
 condhigh = outputH>high
 condlow = outputH>low
 condclose = outputH>close
 sign = (condopen or condhigh or condlow or condclose)

 if sign then
  drawcandle(open,high,low,close) coloured("lime")
 else
  drawcandle(open,high,low,close) coloured("red")
 endif
endif

return r1 coloured(255, 34, 34) as "Range High", rr2 coloured(8, 236, 126) as "Range Low",pos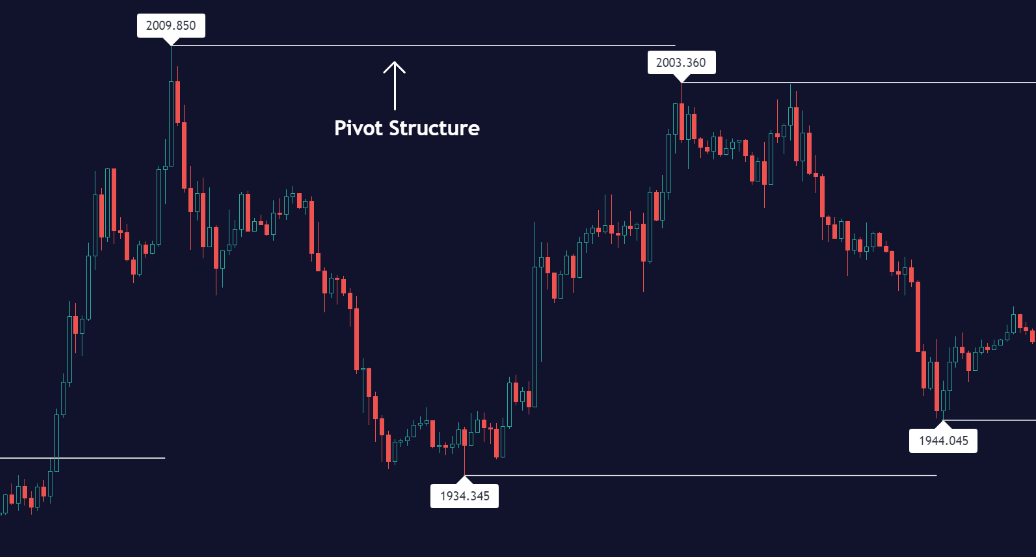