







Heikin Ashi Candles Built on the RSI
Introduction
Most oscillators give you a line. A line tells you where momentum is, but not how it got there: a bar that opened at 40, spiked to 70 and closed back at 45 looks identical on a line chart to one that drifted quietly from 44 to 45.
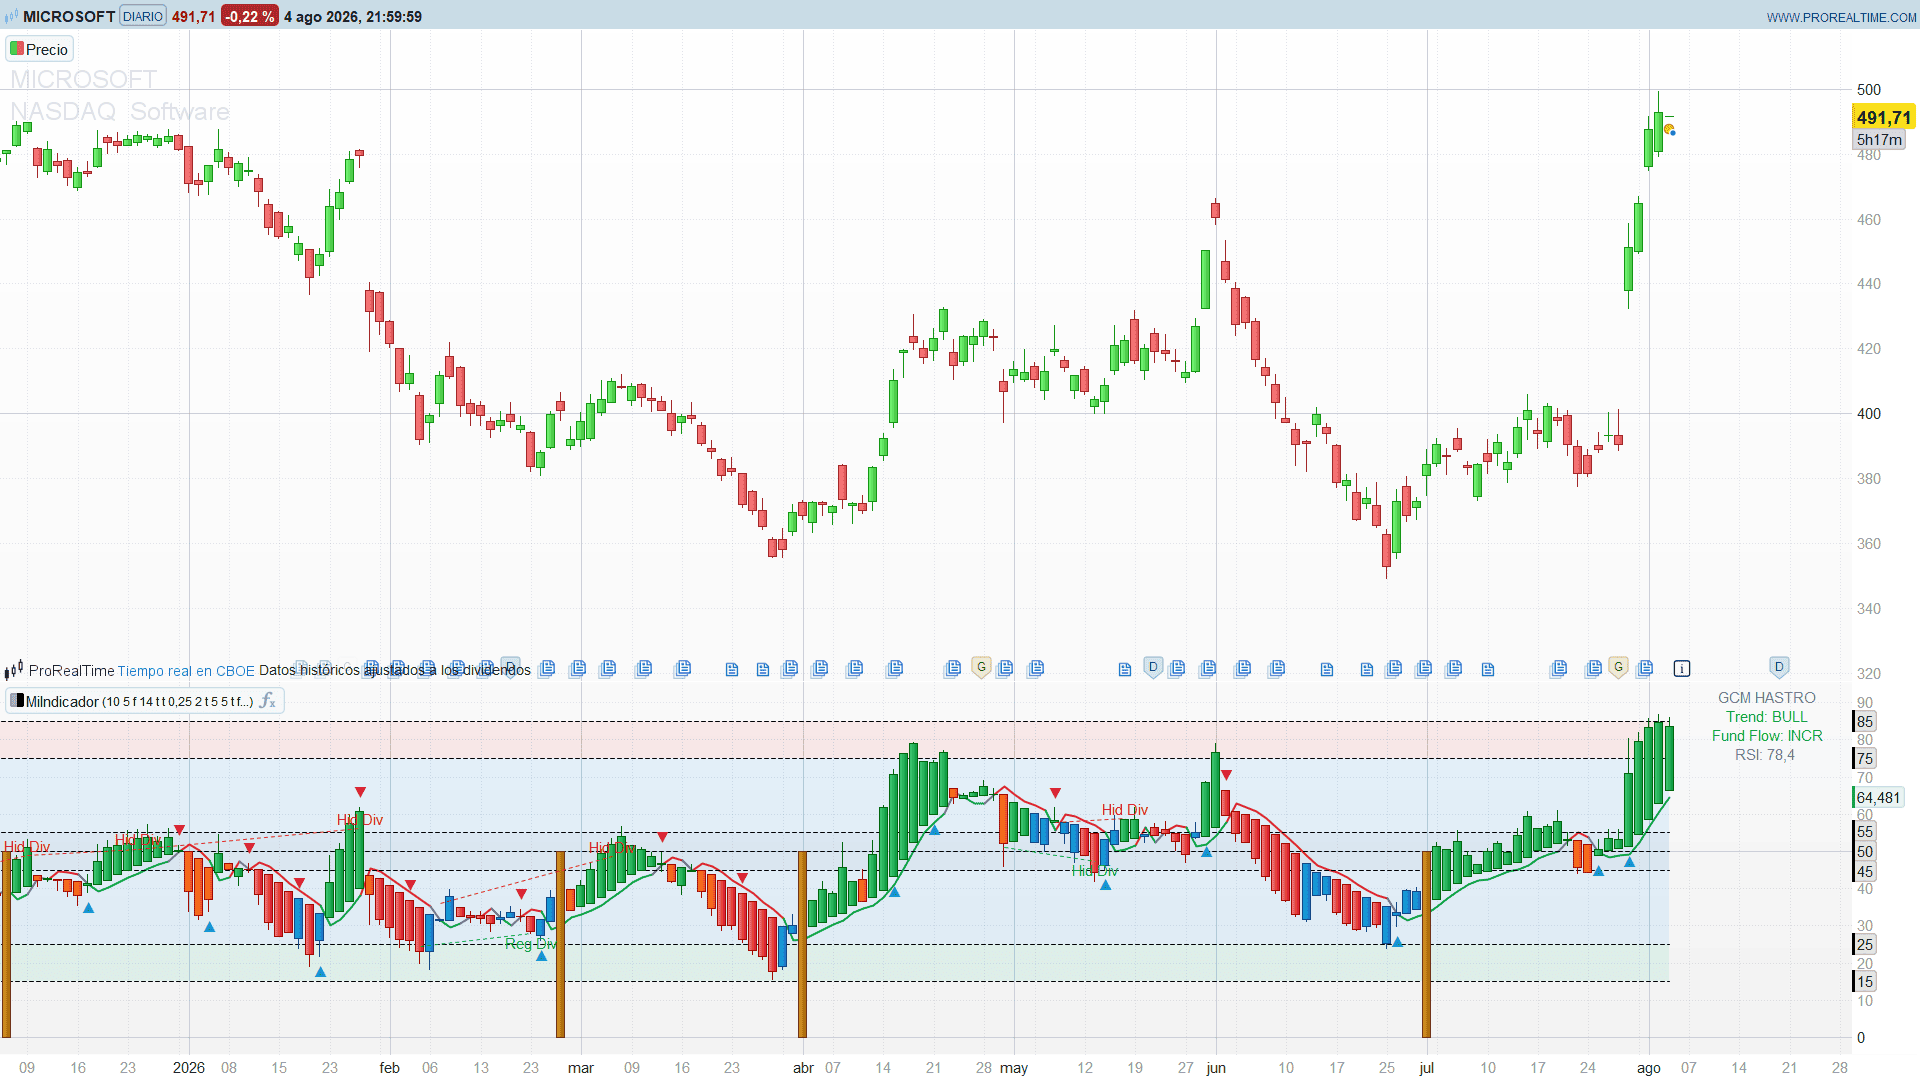
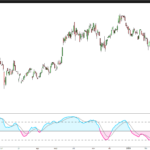
This indicator draws the RSI as Heikin Ashi candles instead. The RSI of the close becomes the candle’s close, the RSI of the high and the RSI of the low become its extremes, and the open is a smoothed recursion of the previous HA close. What you get is a 0-100 oscillator with a body and wicks — the body measures net momentum, the wick measures how much of that push was rejected.
On top of that base it stacks three more layers, and each answers a different question. Let us take them one at a time.
The HARSI Candle
closeRSI = rsi[10](close)
openRSI  = closeRSI[1]
highRSI  = max(rsi[10](high), rsi[10](low))
lowRSI   = min(rsi[10](high), rsi[10](low))

hrClose = (openRSI + highRSI + lowRSI + closeRSI) / 4
hrOpen  = (hrOpen[1] * 5 + hrClose[1]) / 6
hrHigh  = max(highRSI, max(hrOpen, hrClose))
hrLow   = min(lowRSI,  min(hrOpen, hrClose))
Two details deserve attention.
The high and the low are computed as max and min of the two raw RSIs rather than assigned directly. On a normal bar the RSI of the high is above the RSI of the low, so the swap never triggers — but on a bar where that order inverts (it happens after a gap), the candle would be drawn inside out. The max/min pair is a cheap guard against that.
The open is a recursive smoother, not an average of the previous candle. With the default smoothing of 5, each new open keeps five parts of the previous open and one part of the previous close. That is what makes the HARSI drift instead of snapping.
It is also why the first bars need protection. rsi[10] returns undefined during its warm-up, and a single undefined value inside a recursion poisons it for the entire history — no compile error, just a blank indicator. The code seeds the open for the first length + smoothing + 1 bars, which covers the whole warm-up.
The Colours Are Not the Candle Direction
This is the part that surprises people reading the chart for the first time. The HARSI candles are not green when they close up and red when they close down. They are coloured by a completely separate engine, the Banker Fund Flow:
stoch27 = (close - lowest[27](low)) / (highest[27](high) - lowest[27](low)) * 100
fft     = (3 * Wilder5(stoch27) - 2 * Wilder3(Wilder5(stoch27)) - 50) * 1.032 + 50
bbl     = EMA(13) of the typical price position inside its 34-bar range
fft is a fast, doubly-smoothed stochastic; bbl is a slower reference line. The relationship between the two, plus whether fft is rising or falling, sorts every bar into one of six states:
- ENTRY (gold) —
fftcrosses abovebblwhilebblis still below 25. The accumulation signal. - W.REB (blue) —
fftbelowbblbut rising. A weak rebound. - EXIT (red) —
fftbelowbbland not rising. - DECR (orange) —
fftabovebblbut falling. - INCR (green) —
fftabovebbland rising. - NEUT (grey) — anything else.
So a candle can close up and still be painted red. That is intentional: the body tells you what momentum did, the colour tells you what the flow underneath it is doing, and the interesting bars are precisely the ones where the two disagree.
When an ENTRY fires, the candle is redrawn as a full half-scale block (0 to 50, or 50 to 100) so it cannot be missed.
One caveat worth stating plainly: there is no order-flow data behind any of this. It is a stochastic construction with a suggestive name, and it should be read as one.
A SuperTrend That Switches on Wicks, Not on Volatility
The name says SuperTrend, but there is no ATR band and no crossover here. The regime flips on wick geometry:
bullNoWick = hrClose >= hrOpen and lowerWick <= body * 0.25
bearNoWick = hrClose <  hrOpen and upperWick <= body * 0.25
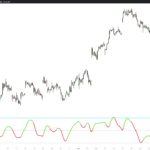
A bullish candle that closed with almost no lower wick means the push was never seriously challenged — the trend flips (or stays) bullish, and the line is plotted just under the candle’s low. A bearish candle with no upper wick does the mirror image.
And when a candle has meaningful wicks on both sides, the indicator refuses to commit: the state is indefinite, the line collapses to the middle of the body and turns grey.
That grey middle line is arguably the most useful part of the whole tool. It is an explicit “no read available” rather than a trend line that keeps pointing somewhere while the market chops sideways.
Divergences on a Second, Separate RSI
The divergence engine does not run on the HARSI. It runs on a plain RSI(14), with 5+5 bar pivots, comparing each new pivot against the previous one:
- Regular bearish — price higher high, RSI lower high
- Hidden bearish — price lower high, RSI higher high
- Regular bullish — price lower low, RSI higher low
- Hidden bullish — price higher low, RSI lower low
That last line is worth a note. The original Pine writes it as rsiUp and rsiDown, a conjunction of two mutually exclusive conditions, so the original never detects a single hidden bullish divergence. This port uses the canonical definition — the same one the author writes correctly on the bearish side — so it finds divergences the TradingView version silently misses.
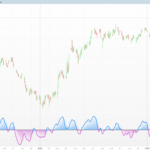
The RSI(14) line itself is hidden by default. Switch showRsiLine to 1 to see what the divergence lines are actually drawn against.
Signals and Their Filters
A raw signal fires when the HARSI candle flips direction, or — with breakout mode on — when the HARSI close crosses one of the ribbon boundaries at 15, 25, 75 or 85. It then has to survive a stack of optional filters: minimum wave size, buffer zone, volume above its 20-period average, bar range above a fraction of the ATR, position relative to the 50 line, and alignment with the fund flow state.
One honest note on the buffer zone filter, because the original tooltip promises more than the code delivers. It reads hrClose <= 25 or hrClose < 50 on the buy side. Since 25 is already below 50, the first condition is contained in the second and the whole thing reduces to hrClose < 50. The filter does not restrict you to the oversold ribbon as advertised — it restricts you to the lower half of the oscillator. The translation keeps the original behaviour; you just want to know what you are switching on.
Settings
- lenHARSI (10) — the RSI period the candles are built from. Lower values give a jumpier, more reactive candle.
- smoothLen (5) — how much of the previous open survives into the new one. Higher values mean fewer, longer candle bodies.
- showRsiLine (0) — plots the RSI(14) the divergences are measured on.
- enableBankerColors (1) — set to 0 for plain green/red candles by direction.
- hastWickRatio (0.25) — the wick-to-body threshold that flips the trend line. Higher values flip more often.
- hastOffset (2.0) — distance between the trend line and the candles.
- leftBars / rightBars (5 / 5) — divergence pivot windows. The right window is also the confirmation delay.
- minWaveSize (3.0) — kills signals coming from tiny candle bodies.
- filterFundFlow (1) — the strictest of the filters, and the one that turns the tool into a confluence system rather than a candle-flip alarm.
- filterRvol / filterAtr / filterZero / filterBuffer (0) — the optional extra filters, off by default.
The ProBuilder Code
Apply it in a separate panel, not on the price.
//-------------------------------------------------------------//
//PRC_GCM HASTRO (by Unigram)
//version = 1
//05.08.2026
//Ivan Gonzalez @ www.prorealcode.com
//Sharing ProRealTime knowledge
//-------------------------------------------------------------//
// Heikin Ashi candles built on the RSI, coloured by a fund flow
// engine, with a wick-driven trend line and RSI divergences.
// Apply on a SEPARATE PANEL, not on the price.
//-------------------------------------------------------------//


//--- HARSI settings ---
lenHARSI = 10
smoothLen = 5


//--- Plain RSI line (the one divergences are measured on) ---
showRsiLine = 0
rsiLen = 14


//--- Institutional accumulation mode (Banker Fund Flow colours) ---
enableBankerColors = 1


//--- HA Super Trend ---
showHAST = 1
hastWickRatio = 0.25
hastOffset = 2.0


//--- Divergences ---
showDiv = 1
leftBars = 5
rightBars = 5


//--- Confluence and breakout filters ---
enableBreakouts = 1
filterBuffer = 0
minWaveSize = 3.0
filterRvol = 0
filterAtr = 0
atrMult = 0.5
filterZero = 0
filterFundFlow = 1


//--- Status panel ---
showPanel = 1


//--- Fixed ribbon levels ---
obUpper = 85
obLower = 75
chopUpper = 55
midLine = 50
chopLower = 45
osUpper = 25
osLower = 15


//-------------------------------------------------------------//
//--- HARSI: Heikin Ashi candles built on the RSI ---
//-------------------------------------------------------------//
closeRSI = rsi[lenHARSI](close)
if barindex = 0 then
   openRSI = closeRSI
else
   openRSI = closeRSI[1]
endif
hiRaw = rsi[lenHARSI](high)
loRaw = rsi[lenHARSI](low)
highRSI = max(hiRaw, loRaw)
lowRSI = min(hiRaw, loRaw)
closeVal = (openRSI + highRSI + lowRSI + closeRSI) / 4


// Seed the open through the whole RSI warm-up: a single undefined
// value inside the recursion would poison it for the entire history
warmHARSI = lenHARSI + smoothLen + 1
if barindex <= warmHARSI then
   hrOpen = (openRSI + closeRSI) / 2
else
   hrOpen = ((hrOpen[1] * smoothLen) + closeVal[1]) / (smoothLen + 1)
endif
hrClose = closeVal
hrHigh = max(highRSI, max(hrOpen, hrClose))
hrLow = min(lowRSI, min(hrOpen, hrClose))


if hrClose >= hrOpen then
   isHaUp = 1
else
   isHaUp = 0
endif


//-------------------------------------------------------------//
//--- Banker Fund Flow ---
//-------------------------------------------------------------//
tpFF = (2 * close + high + low + open) / 5
ll34 = lowest[34](low)
hh34 = highest[34](high)
ll27 = lowest[27](low)
hh27 = highest[27](high)


rng27 = hh27 - ll27
if rng27 > 0 then
   stoch27 = (close - ll27) / rng27 * 100
else
   stoch27 = 50
endif
// the original's "weighted simple average" with weight = 1 is a Wilder average
wsa1 = average[5,3](stoch27)
wsa2 = average[3,3](wsa1)
fft = (3 * wsa1 - 2 * wsa2 - 50) * 1.032 + 50


rng34 = hh34 - ll34
if rng34 > 0 then
   bblSrc = (tpFF - ll34) / rng34 * 100
else
   bblSrc = 50
endif
bbl = average[13,1](bblSrc)


if fft crosses over bbl and bbl < 25 then
   bes = 1
else
   bes = 0
endif


// the original's findRecentValue(fft*0.95, 1) always returns the previous bar
fftRef = fft[1] * 0.95


// 1 ENTRY / 2 W.REB / 3 EXIT / 4 DECR / 5 INCR / 0 NEUT
if bes = 1 then
   ffState = 1
elsif fft < bbl and fft > fftRef then
   ffState = 2
elsif fft < bbl then
   ffState = 3
elsif fft < fftRef then
   ffState = 4
elsif fft > bbl then
   ffState = 5
else
   ffState = 0
endif


if ffState = 1 or ffState = 2 or ffState = 5 then
   isFFBull = 1
else
   isFFBull = 0
endif
if ffState = 3 or ffState = 4 then
   isFFBear = 1
else
   isFFBear = 0
endif


//-------------------------------------------------------------//
//--- HARSI candle colour ---
//--- Every colour is mid-toned on purpose: the original palette
//--- (pure yellow, pure white, neon cyan) is invisible on a white
//--- background. These read on both light and dark charts.
//-------------------------------------------------------------//
if enableBankerColors = 0 then
   if isHaUp = 1 then
      cr = 5
      cg = 150
      cb = 105
   else
      cr = 220
      cg = 38
      cb = 38
   endif
elsif ffState = 1 then
   // ENTRY: gold, replaces the original's pure yellow
   cr = 176
   cg = 110
   cb = 0
elsif ffState = 2 then
   // W.REB: blue
   cr = 2
   cg = 132
   cb = 199
elsif ffState = 3 then
   // EXIT: red
   cr = 220
   cg = 38
   cb = 38
elsif ffState = 4 then
   // DECR: orange, replaces the original's pure white
   cr = 234
   cg = 88
   cb = 12
elsif ffState = 5 then
   // INCR: green
   cr = 22
   cg = 163
   cb = 74
else
   // NEUT: slate grey
   cr = 100
   cg = 116
   cb = 139
endif


//-------------------------------------------------------------//
//--- Confluence filters ---
//-------------------------------------------------------------//
waveSize = abs(hrClose - hrOpen)
if waveSize >= minWaveSize then
   waveOk = 1
else
   waveOk = 0
endif


// kept literal from the original: the OR collapses this to hrClose < midLine
if filterBuffer = 0 or hrClose <= osUpper or hrClose < midLine then
   buyZoneOk = 1
else
   buyZoneOk = 0
endif
if filterBuffer = 0 or hrClose >= obLower or hrClose > midLine then
   sellZoneOk = 1
else
   sellZoneOk = 0
endif


volSma = average[20](volume)
if filterRvol = 0 or volume > volSma then
   volOk = 1
else
   volOk = 0
endif


atrVal = averagetruerange[14](close)
barSpan = high - low
if filterAtr = 0 or barSpan >= atrVal * atrMult then
   atrOk = 1
else
   atrOk = 0
endif


if filterZero = 0 or hrClose > midLine then
   zeroBuyOk = 1
else
   zeroBuyOk = 0
endif
if filterZero = 0 or hrClose < midLine then
   zeroSellOk = 1
else
   zeroSellOk = 0
endif


if filterFundFlow = 0 or isFFBull = 1 then
   ffBuyOk = 1
else
   ffBuyOk = 0
endif
if filterFundFlow = 0 or isFFBear = 1 then
   ffSellOk = 1
else
   ffSellOk = 0
endif


//-------------------------------------------------------------//
//--- Signals ---
//-------------------------------------------------------------//
if isHaUp[1] = 0 and isHaUp = 1 then
   baseBuy = 1
else
   baseBuy = 0
endif
if isHaUp[1] = 1 and isHaUp = 0 then
   baseSell = 1
else
   baseSell = 0
endif


if hrClose crosses over osLower or hrClose crosses over obLower then
   bullBrk = 1
else
   bullBrk = 0
endif
if hrClose crosses under obUpper or hrClose crosses under osUpper then
   bearBrk = 1
else
   bearBrk = 0
endif


if baseBuy = 1 or (enableBreakouts = 1 and bullBrk = 1) then
   rawBuy = 1
else
   rawBuy = 0
endif
if baseSell = 1 or (enableBreakouts = 1 and bearBrk = 1) then
   rawSell = 1
else
   rawSell = 0
endif


// the barindex guard keeps signals off the HARSI warm-up
if barindex > warmHARSI + 1 and rawBuy = 1 and waveOk = 1 and buyZoneOk = 1 and volOk = 1 and atrOk = 1 and zeroBuyOk = 1 and ffBuyOk = 1 then
   buySignal = 1
else
   buySignal = 0
endif
if barindex > warmHARSI + 1 and rawSell = 1 and waveOk = 1 and sellZoneOk = 1 and volOk = 1 and atrOk = 1 and zeroSellOk = 1 and ffSellOk = 1 then
   sellSignal = 1
else
   sellSignal = 0
endif


//-------------------------------------------------------------//
//--- HA Super Trend: the regime switches on wick geometry ---
//-------------------------------------------------------------//
haBody = abs(hrClose - hrOpen)
haLowWick = min(hrOpen, hrClose) - hrLow
haUpWick = hrHigh - max(hrOpen, hrClose)


if hrClose >= hrOpen and (haLowWick <= haBody * hastWickRatio or haBody = 0) then
   bullNoWick = 1
else
   bullNoWick = 0
endif
if hrClose < hrOpen and (haUpWick <= haBody * hastWickRatio or haBody = 0) then
   bearNoWick = 1
else
   bearNoWick = 0
endif


once hastTrend = 1
if bullNoWick = 1 then
   hastTrend = 1
elsif bearNoWick = 1 then
   hastTrend = -1
endif


if bullNoWick = 0 and bearNoWick = 0 then
   // wicks on both sides: no read available, line collapses to the body centre
   hastLine = (hrOpen + hrClose) / 2
   stR = 100
   stG = 116
   stB = 139
elsif hastTrend = 1 then
   hastLine = hrLow - hastOffset
   stR = 22
   stG = 163
   stB = 74
else
   hastLine = hrHigh + hastOffset
   stR = 220
   stG = 38
   stB = 38
endif


if showHAST = 1 then
   hastPlot = hastLine
else
   hastPlot = undefined
endif


//-------------------------------------------------------------//
//--- Divergences on the plain RSI ---
//-------------------------------------------------------------//
nRsi = rsi[rsiLen](close)


isPH = 0
isPL = 0
ctrVal = nRsi[rightBars]
if barindex > rsiLen + leftBars + rightBars + 2 then
   isPH = 1
   isPL = 1
   for kk = 1 to leftBars do
      if nRsi[rightBars + kk] >= ctrVal then
         isPH = 0
      endif
      if nRsi[rightBars + kk] <= ctrVal then
         isPL = 0
      endif
   next
   for kk = 1 to rightBars do
      if nRsi[rightBars - kk] >= ctrVal then
         isPH = 0
      endif
      if nRsi[rightBars - kk] <= ctrVal then
         isPL = 0
      endif
   next
endif


once hasLastPh = 0
once hasPrevPh = 0
once lastPhR = 0
once lastPhI = 0
once lastPhP = 0
once prevPhR = 0
once prevPhI = 0
once prevPhP = 0
once hasLastPl = 0
once hasPrevPl = 0
once lastPlR = 0
once lastPlI = 0
once lastPlP = 0
once prevPlR = 0
once prevPlI = 0
once prevPlP = 0


regBear = 0
hidBear = 0
regBull = 0
hidBull = 0


if isPH = 1 then
   prevPhR = lastPhR
   prevPhI = lastPhI
   prevPhP = lastPhP
   hasPrevPh = hasLastPh
   lastPhR = ctrVal
   lastPhI = barindex - rightBars
   lastPhP = high[rightBars]
   hasLastPh = 1


   if hasPrevPh = 1 then
      if lastPhP > prevPhP and lastPhR < prevPhR then
         regBear = 1
      endif
      if lastPhP < prevPhP and lastPhR > prevPhR then
         hidBear = 1
      endif
      if showDiv = 1 and (regBear = 1 or hidBear = 1) then
         drawsegment(prevPhI, prevPhR, lastPhI, lastPhR) coloured(220, 38, 38) style(dottedline, 1)
         // Pine draws white text over a coloured label box; ProBuilder has no
         // box, so the text carries the colour itself (see trap 25)
         if regBear = 1 then
            drawtext("Reg Div", lastPhI, lastPhR + 2.5) coloured(220, 38, 38)
         else
            drawtext("Hid Div", lastPhI, lastPhR + 2.5) coloured(220, 38, 38)
         endif
      endif
   endif
endif


if isPL = 1 then
   prevPlR = lastPlR
   prevPlI = lastPlI
   prevPlP = lastPlP
   hasPrevPl = hasLastPl
   lastPlR = ctrVal
   lastPlI = barindex - rightBars
   lastPlP = low[rightBars]
   hasLastPl = 1


   if hasPrevPl = 1 then
      if lastPlP < prevPlP and lastPlR > prevPlR then
         regBull = 1
      endif
      // the original writes "rsiUp and rsiDown" here, which is always false
      if lastPlP > prevPlP and lastPlR < prevPlR then
         hidBull = 1
      endif
      if showDiv = 1 and (regBull = 1 or hidBull = 1) then
         drawsegment(prevPlI, prevPlR, lastPlI, lastPlR) coloured(22, 163, 74) style(dottedline, 1)
         if regBull = 1 then
            drawtext("Reg Div", lastPlI, lastPlR - 2.5) coloured(22, 163, 74)
         else
            drawtext("Hid Div", lastPlI, lastPlR - 2.5) coloured(22, 163, 74)
         endif
      endif
   endif
endif


//-------------------------------------------------------------//
//--- Rendering: candles, ribbons and signals ---
//-------------------------------------------------------------//
// institutional entry marker: a full half-scale candle
if bes = 1 and hrClose < midLine then
   pOpen = 0
   pHigh = 50
   pLow = 0
   pClose = 50
elsif bes = 1 then
   pOpen = 50
   pHigh = 100
   pLow = 50
   pClose = 100
else
   pOpen = hrOpen
   pHigh = hrHigh
   pLow = hrLow
   pClose = hrClose
endif
drawcandle(pOpen, pHigh, pLow, pClose) coloured(cr, cg, cb)


colorbetween(obUpper, obLower, 239, 68, 68, 25)
colorbetween(osUpper, osLower, 16, 185, 129, 25)
colorbetween(obLower, osUpper, 33, 150, 243, 25)
colorbetween(chopUpper, chopLower, 148, 163, 184, 25)


if buySignal = 1 then
   drawtext("▲", barindex - 1, hrLow[1] - 4) coloured(8, 145, 178)
endif
if sellSignal = 1 then
   drawtext("▼", barindex - 1, hrHigh[1] + 4) coloured(219, 39, 119)
endif


//--- Status panel for the chart timeframe ---
if showPanel = 1 and islastbarupdate then
   drawtext("GCM HASTRO", -150, -15) anchor(topright) coloured(113, 128, 150)
   if isHaUp = 1 then
      drawtext("Trend: BULL", -150, -34) anchor(topright) coloured(22, 163, 74)
   else
      drawtext("Trend: BEAR", -150, -34) anchor(topright) coloured(220, 38, 38)
   endif
   if ffState = 1 then
      drawtext("Fund Flow: ENTRY", -150, -53) anchor(topright) coloured(176, 110, 0)
   elsif ffState = 2 then
      drawtext("Fund Flow: W.REB", -150, -53) anchor(topright) coloured(2, 132, 199)
   elsif ffState = 3 then
      drawtext("Fund Flow: EXIT", -150, -53) anchor(topright) coloured(220, 38, 38)
   elsif ffState = 4 then
      drawtext("Fund Flow: DECR", -150, -53) anchor(topright) coloured(234, 88, 12)
   elsif ffState = 5 then
      drawtext("Fund Flow: INCR", -150, -53) anchor(topright) coloured(22, 163, 74)
   else
      drawtext("Fund Flow: NEUT", -150, -53) anchor(topright) coloured(100, 116, 139)
   endif
   rsiShow = round(nRsi * 10) / 10
   drawtext("RSI: #rsiShow#", -150, -72) anchor(topright) coloured(113, 128, 150)
endif


if showRsiLine = 1 then
   rsiPlot = nRsi
else
   rsiPlot = undefined
endif


return hastPlot as "HA Super Trend" coloured(stR, stG, stB) style(line, 2), rsiPlot as "RSI" coloured(217, 119, 6) style(line, 1), obUpper as "OB Upper" style(dottedline, 1), obLower as "OB Lower" style(dottedline, 1), chopUpper as "Choppy Upper" style(dottedline, 1), midLine as "Median" style(dottedline, 1), chopLower as "Choppy Lower" style(dottedline, 1), osUpper as "OS Upper" style(dottedline, 1), osLower as "OS Lower" style(dottedline, 1)
Comments
You must be logged in to post a comment.
:)
I think a warning is in place!
There is a form of repaint in play.
The buy and sell signals ( indicated by the blue and red triangles) only flash one period after a true buy or sell signal ( barindex -1 ) has occurred. That is: they are always shown one period too late. They seemingly appear with hindsight.
In other words: when a buy signal appears, it basically says that you should have bought at the close of one period earlier. Can you still do that? :)
Example: when using day candles and a buy signal actually appears on the graph ( a little blue triangle) it tells you that a buy condition occurred at the close of the previous trading day, only after confirmation by the current candle.
This may be misleading for the unsuspecting mind. The buy and sell signals should honestly be positioned at the current confirmation period/candle, at barindex instead of barindex-1.
Good catch, Violet, and you are right. Let me correct the label first and then give the fix. It is not repaint in the strict sense: once the current bar closes, the triangle drawn on the previous one is frozen and never moves again. There is no rewriting of history. What there is, is harder to phrase and easier to fix: the marker is offset one bar backwards relative to the bar that produces the condition. baseBuy compares isHaUp against isHaUp[1], so the flip is a property of the current bar, and isHaUp depends on hrClose, which is not final until the close. Drawing it at barindex - 1 puts the coordinate one bar behind the information. Your reading is exactly right: the arrow implies an entry at the close of a candle that was already closed by the time the data existed. And here is the part that makes it more annoying than it looks. While the current bar is forming, the triangle appears and disappears tick by tick, like in any indicator evaluated on the live bar. The difference is that here the flicker lands on a closed candle, which carries far more visual authority. The offset does not just misplace the marker, it disguises a provisional signal as a settled one. The fix is the two lines you propose: if buySignal = 1 then drawtext("▲", barindex, hrLow - 4) coloured(8, 145, 178) endif if sellSignal = 1 then drawtext("▼", barindex, hrHigh + 4) coloured(219, 39, 119) endif Marker and condition now live on the same bar. It still flickers during the live bar, but on the candle it belongs to, which is honest.

Merci saturne23, content que l'outil vous serve. Les barres marron sont le marqueur ENTRY du Banker Fund Flow

Hi Ivan
Thanks for your high sharing
Im fan