





FishStoc: the Fisher Transform of the Stochastic RSI Drawn as Candles
Introduction
The Stochastic RSI is one of the fastest momentum readings there is, and also one of the noisiest: it spends long stretches pinned at 0 or 100 and flips from one extreme to the other in a couple of bars. FishStoc, by mehmetbezgincan, puts it through the Fisher Transform, which stretches the extremes and flattens the middle, so that turns become sharp peaks and a reading of 1.5 means the same on any instrument.
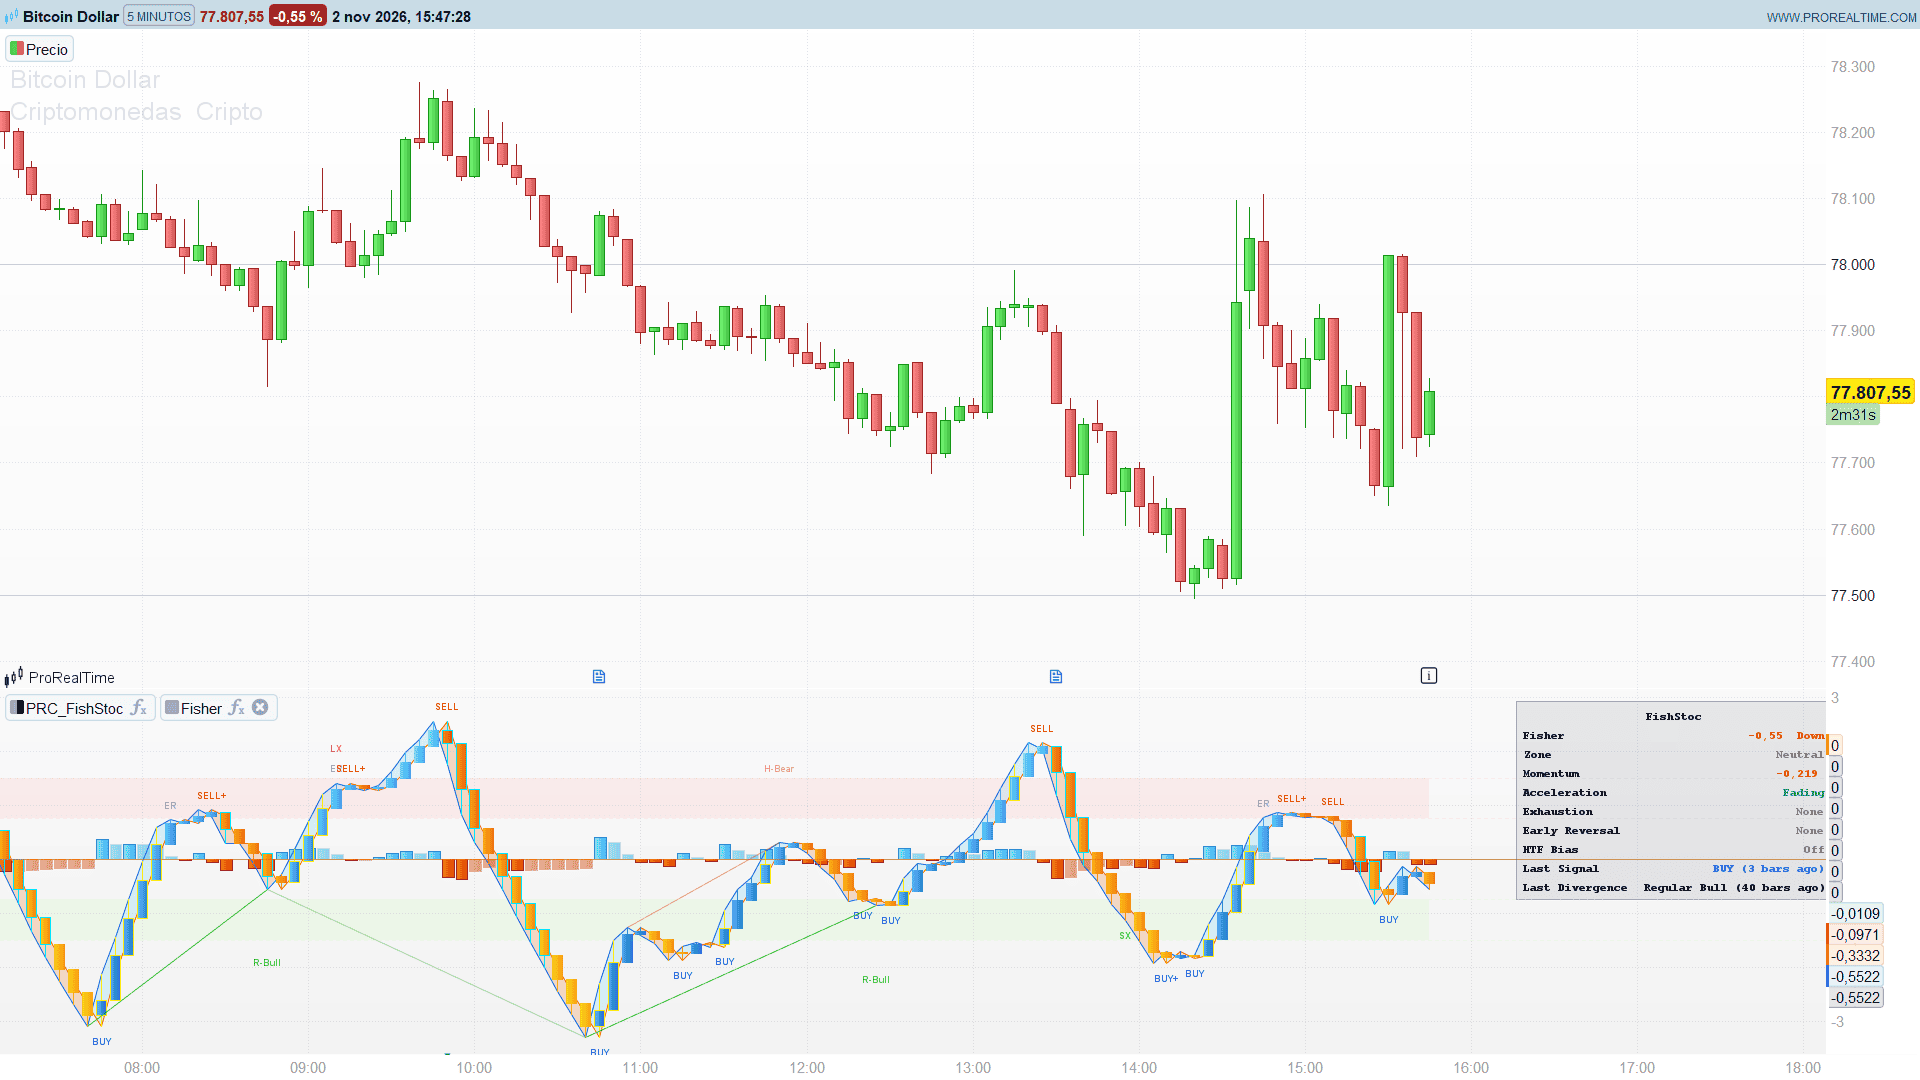
The result is not drawn as a line but as candles. Each candle is built from the Fisher line and its Trigger: the body shows where the pair went during the bar, the colour shows the Fisher level or its speed, and the border lights up when momentum is strong. On top of that sit a momentum histogram, acceleration markers, regular and hidden divergences, exhaustion and early reversal labels, BUY / SELL labels on the Fisher / Trigger cross, and an optional dashboard in a companion indicator.
Theory Behind the Indicator
The chain. A 14-period RSI is turned into a Stochastic over 14 bars (the RSI is its own high, low and close). That Stochastic RSI is normalised to 0..1 against its own range over the last 9 bars and passed through Ehlers’ Fisher Transform: the value is smoothed with the coefficients 0.66 and 0.67, clipped to ±0.999, and transformed with 0.5 × ln((1 + x) / (1 − x)) plus half of the previous Fisher value. Near the edges of the range the logarithm grows very fast, which is what turns a turning point into a spike.
The Trigger. By default the Trigger is simply the Fisher of the previous bar, the classic Ehlers set-up: every one-bar turn of the Fisher is a cross. A smoothed Trigger (an EMA of the Fisher) gives fewer and cleaner crosses with a small delay.
The candles. The open of each candle is the average of the Fisher and Trigger of the previous bar, the close is their average on this bar, and the high and low are the extremes of the four values. They are not price candles: a green body means the Fisher / Trigger pair moved up during the bar.
Momentum and acceleration. Momentum is the bar-to-bar change of the Fisher (or the Fisher minus its Trigger). Acceleration is the change of momentum. Both are measured against their own standard deviation over 100 bars, which gives an intensity from 0 to 1 used by the colours, the borders and the markers.
Exhaustion. Long exhaustion (LX) fires when the Fisher is above 1, momentum still points up but is decelerating, and it has faded to less than 60% of its peak of the last 5 bars: buyers are running out of fuel. Short exhaustion (SX) is the mirror image below −1.
Early reversal. ER fires before the cross: the Fisher touched an extreme zone (±0.5) in the last 5 bars, it is still on the old side of its Trigger, and acceleration has stayed on the reversal side for 2 consecutive bars with a minimum intensity.
BUY / SELL. A cross of the Fisher over its Trigger with the Trigger below −0.75 is a BUY; a cross under it with the Trigger above 0.75 is a SELL. A BUY that follows an early bullish reversal or a short exhaustion within 3 bars becomes BUY+ (SELL+ for the bearish side).
Divergences. Pivots of the Fisher with 5 bars on each side are compared with the previous pivot of the same side, between 5 and 60 bars apart. Regular bullish: price makes a lower low and the Fisher a higher low. Hidden bullish: price makes a higher low and the Fisher a lower low. The bearish versions are the same on the highs. The two Fisher pivots must differ by at least 0.10, which removes near-equal pivots.
Every label, divergence and alert is evaluated on closed bars only: it appears when the next bar opens, on the bar where it happened, and never moves afterwards.
Key Features at a Glance
- Fisher Transform of the Stochastic RSI drawn as synthetic Heikin-Ashi candles
- Three candle colour modes: position (Fisher level), momentum and speedometer, with four themes
- Momentum histogram, solid while momentum strengthens and faded while it weakens
- Acceleration line and markers for strong acceleration and deceleration
- Long / short exhaustion (LX / SX) and early reversal (ER) labels
- BUY / SELL labels on the Fisher / Trigger cross, upgraded to BUY+ / SELL+ after an early signal
- Regular and hidden divergences with pivot-to-pivot lines
- Optional higher timeframe filter for the BUY / SELL labels
- Optional dashboard (companion indicator FishStoc Dashboard)
- Seven alert series
How to Read the Indicator
- The candles: long bodies are strong moves of the Fisher; short bodies with long wicks near an extreme zone are the first sign that the move is tiring. In position mode the colour goes from deep to light as the Fisher rises, in two separate families for up and down candles.
- The zones: between ±0.75 and ±1.5. A Fisher beyond 1.5 is stretched; the optional background marks it.
- The histogram: its sign is the direction of momentum, its tone whether momentum is strengthening (solid) or weakening (faded). A faded bar in the direction of the move is often the first warning.
- LX / SX and ER: early warnings that come before the cross. On their own they say “the move is fading”; followed by a cross within 3 bars they turn the label into BUY+ / SELL+.
- Divergences: R-Bull and R-Bear are reversal signals, H-Bull and H-Bear continuation signals. They appear 5 bars after the pivot, when the pivot is confirmed.
Practical Applications
- Timing entries in a trend: in an uptrend, a hidden bullish divergence or a BUY from the oversold zone marks the end of a pullback.
- Spotting exhaustion: an LX in an extended rally, followed by a SELL+, is a classic sequence before a correction.
- Filtering with a higher timeframe: with the filter on, BUY labels only appear while the Fisher of the higher timeframe is rising (or above zero), which keeps the signals in the direction of the bigger move.
- Reading momentum quality: the speedometer mode colours each candle green, yellow or red by momentum intensity, which makes it easy to see when a move is accelerating or running out.
Indicator Configuration
Core and Trigger
- lenRsi (default 14), lenStoch (default 14), fisherLen (default 9): lengths of the RSI, the Stochastic and the Fisher normalisation.
- showFisherLine (default 1): Fisher and Trigger lines.
- trigMode (default 0): 0 = classic Trigger (previous Fisher), 1 = smoothed Trigger (EMA of length trigLen, default 3).
Zones and visuals
- obInner (default 0.75) and obOuter (default 1.5): inner and outer levels of the zones.
- theme (default 1): 1 = Ocean, 2 = Classic, 3 = Neon, 4 = Custom with the colours cuBs, cuBe, cuRs and cuRe (bullish start / end, bearish start / end).
- colorMode (default 1): 1 = position, 2 = momentum, 3 = speedometer.
- showZoneBg (default 0), showFill (default 1): extreme background and fill between Fisher and Trigger.
- autoGradRange, gradRangeMan, gradLookback, gradMult: scale of the colour gradient (2 standard deviations of the last 100 bars by default).
Higher timeframe filter
- useHtf (default 0): 1 = BUY needs a bullish bias of the higher timeframe and SELL a bearish one.
- htfMin (default 240): higher timeframe in minutes (240 = 4 hours, 1440 = daily, 10080 = weekly). It must be above the chart timeframe, otherwise the filter is ignored.
- htfMode (default 0): 0 = direction (Fisher above / below its Trigger), 1 = level (Fisher above / below zero).
Momentum and acceleration
- momSource (default 0): 0 = bar-to-bar change of the Fisher, 1 = Fisher minus Trigger. momSmooth (default 1 = off).
- showMomHist (default 1), autoHistScale (default 1), histScaleMan (default 4): the histogram and its scale.
- showMomGauge (default 1) and momBorderThr (default 0.5): in position mode, the candle border takes the momentum colour (gaBu / gaBe) when its intensity is above the threshold.
- showAccel (default 0): acceleration line. showAccMarks (default 1) and accMarkThr (default 0.75): triangles on strong acceleration and deceleration.
- autoMomRange, autoAccRange and the related lookbacks and multipliers: the scales used for the intensities.
Signals
- showExh, exhLevel (1.0), exhLookback (5), exhFade (0.6): exhaustion.
- showEarly, erLevel (0.5), erZoneLook (5), erBars (2), erMinInt (0.15): early reversal.
- confMark (1) and confWindow (3): BUY+ / SELL+ upgrade.
- showTurns (1), crossFilter (0 = only crosses from the zones, 1 = all crosses), sigCooldown (0): BUY / SELL labels.
- showRegular, showHidden, onlyZones, lbL / lbR (5 / 5), rangeLower / rangeUpper (5 / 60), minFishDiff (0.10), showDivLines, divLineWidth (1 to 4): divergences.
Alerts
The seven signal series are invisible on the panel but listed in the alert tool. All of them come from closed bars:
- Sig Cross crosses over 0.5 for a BUY (over 1.5 for a BUY+), under −0.5 for a SELL (under −1.5 for a SELL+).
- Sig Regular / Sig Hidden: over 0.5 for a bullish divergence, under −0.5 for a bearish one.
- Sig Zone: over 0.5 when the Fisher enters the overbought zone, under −0.5 for the oversold zone.
- Sig Zero: over 0.5 when the Fisher crosses above zero, under −0.5 below zero.
- Sig Exhaustion: over 0.5 for a short exhaustion (SX), under −0.5 for a long exhaustion (LX).
- Sig Early: over 0.5 for an early bullish reversal, under −0.5 for an early bearish one.
The dashboard
FishStoc Dashboard is a companion indicator: add it to the same panel as FishStoc, with the same settings. It shows the Fisher value and direction, the zone, momentum, acceleration, exhaustion, early reversal, the higher timeframe bias, and the last signal and last divergence with their age. dashPos (default 2): 1 = top left, 2 = top right, 3 = bottom left, 4 = bottom right.
The Code
//-----------------------------------------------------------------------
//PRC_FishStoc
//version = 0
//02.11.2026
//Iván González @ www.prorealcode.com
//Author: mehmetbezgincan
//Sharing ProRealTime knowledge
//-----------------------------------------------------------------------
// Apply in a SEPARATE WINDOW (oscillator panel).
//
// Fisher Transform of the Stochastic RSI, drawn as synthetic Heikin-Ashi
// candles built from the Fisher line and its Trigger (they are NOT price
// candles), with momentum histogram, acceleration, regular / hidden
// divergences, long / short exhaustion, early reversal and BUY / SELL labels.
//
// The status dashboard lives in a second indicator,
// PRC_FishStoc Dashboard, to be added to the same panel: the candles are
// drawn bar by bar with DRAWCANDLE, which cannot share an indicator with a
// panel that is redrawn on the last bar only.
//
// Labels, divergences and markers are evaluated on CLOSED bars only: each
// one is drawn when the next bar opens, on the bar where it happened, and
// never moves afterwards.
//-----------------------------------------------------------------------


// ===================== INPUTS =====================
// --- Core ---
lenRsi = 14          // RSI length
lenStoch = 14        // Stochastic length
fisherLen = 9        // Fisher normalisation length (lookback that maps the Stochastic RSI to 0..1)
showFisherLine = 1   // 1 = Fisher and Trigger lines
// --- Trigger line ---
trigMode = 0         // 0 = classic (Trigger = previous Fisher), 1 = smoothed (EMA of the Fisher)
trigLen = 3          // EMA length of the smoothed Trigger
// --- Overbought / oversold zones ---
obInner = 0.75       // inner level of the zones (+/-), also used by the cross filter
obOuter = 1.5        // outer level of the zones (+/-) and extreme background trigger
// --- Theme and visuals ---
theme = 1            // 1 = Ocean, 2 = Classic, 3 = Neon, 4 = Custom (the four colours below)
cuBsR = 0            // custom bullish start #00A86B
cuBsG = 168
cuBsB = 107
cuBeR = 0            // custom bullish end #00E5FF
cuBeG = 229
cuBeB = 255
cuRsR = 213          // custom bearish start #D50000
cuRsG = 0
cuRsB = 0
cuReR = 255          // custom bearish end #FF9100
cuReG = 145
cuReB = 0
showZoneBg = 0       // 1 = tint the panel while the Fisher is beyond the outer level
showFill = 1         // 1 = fill between Fisher and Trigger
colorMode = 1        // candle colour: 1 = position (Fisher level), 2 = momentum, 3 = speedometer
autoGradRange = 1    // 1 = gradient scale from the standard deviation of the Fisher
gradRangeMan = 2.0   // manual gradient limit (+/-)
gradLookback = 100   // auto scale lookback
gradMult = 2.0       // auto scale multiplier (x standard deviation)
// --- Higher timeframe filter ---
useHtf = 0           // 1 = BUY needs a bullish higher timeframe bias, SELL a bearish one
htfMin = 240         // higher timeframe in minutes (240 = 4 hours, 1440 = daily, 10080 = weekly)
htfMode = 0          // 0 = direction (Fisher vs Trigger), 1 = level (Fisher vs 0)
// --- Momentum ---
momSource = 0        // 0 = bar to bar change of the Fisher, 1 = Fisher minus Trigger
momSmooth = 1        // momentum smoothing (EMA, 1 = off)
autoMomRange = 1     // 1 = momentum scale from its standard deviation
momRangeMan = 0.5    // manual momentum scale (+/-)
momLookback = 100    // auto scale lookback
momMult = 2.0        // auto scale multiplier
showMomHist = 1      // 1 = momentum histogram
autoHistScale = 1    // 1 = histogram scaled to the panel automatically
histScaleMan = 4.0   // manual histogram multiplier
showMomGauge = 1     // 1 = candle border and wick take the momentum colour when it is strong (position mode)
momBorderThr = 0.5   // border intensity threshold (0 to 1)
gaBuR = 255          // border colour, momentum rising #FFEE00
gaBuG = 238
gaBuB = 0
gaBeR = 0            // border colour, momentum falling #00E5FF
gaBeG = 229
gaBeB = 255
// --- Speedometer mode ---
spdMidThr = 0.5      // yellow threshold (intensity 0 to 1)
showSpdBorder = 1    // 1 = white / black border by candle direction
// --- Acceleration ---
showAccel = 0        // 1 = acceleration line
accSmooth = 1        // acceleration smoothing (EMA, 1 = off)
autoAccRange = 1     // 1 = acceleration scale from its standard deviation
accRangeMan = 0.25   // manual acceleration scale
accLookback = 100    // auto scale lookback
accMult = 2.0        // auto scale multiplier
showAccMarks = 1     // 1 = triangles on strong acceleration / deceleration
accMarkThr = 0.75    // marker threshold (intensity 0 to 1)
autoAccScale = 1     // 1 = acceleration line scaled to the panel automatically
accScaleMan = 4.0    // manual acceleration line multiplier
// --- Exhaustion (long / short) ---
showExh = 1          // 1 = LX / SX labels
exhLevel = 1.0       // the Fisher must be beyond this level (+/-)
exhLookback = 5      // peak momentum lookback
exhFade = 0.6        // momentum must have faded to this fraction of its recent peak
markGap = 0.25       // manual offset of the divergence tags (used when autoGap = 0)
// --- Early reversal ---
showEarly = 1        // 1 = ER labels
erLevel = 0.5        // zone level the Fisher must have reached (+/-)
erZoneLook = 5       // zone touch lookback
erBars = 2           // bars the acceleration must stay on the reversal side
erMinInt = 0.15      // minimum acceleration intensity (0 to 1)
// --- Confluence ---
confMark = 1         // 1 = BUY / SELL after an early reversal or opposite exhaustion becomes BUY+ / SELL+
confWindow = 3       // confluence window, in bars
// --- BUY / SELL labels ---
showTurns = 1        // 1 = BUY / SELL labels on the Fisher / Trigger cross
crossFilter = 0      // 0 = only crosses from the zones (Trigger beyond the inner level), 1 = all crosses
sigCooldown = 0      // minimum bars between two signals of the same side (0 = off)
// --- Label layout ---
autoGap = 1          // 1 = label offset scaled to the recent Fisher range
// --- Divergence ---
showRegular = 1      // 1 = regular divergences
showHidden = 1       // 1 = hidden divergences
onlyZones = 0        // 1 = only pivots beyond the inner zone level
lbR = 5              // pivot right bars
lbL = 5              // pivot left bars
rangeUpper = 60      // maximum bars between the two pivots
rangeLower = 5       // minimum bars between the two pivots
minFishDiff = 0.10   // the two Fisher pivots must differ by at least this much (0 = off)
showDivLines = 1     // 1 = connect the pivots with a line
divLineWidth = 1     // line width (1 to 4)


// ===================== COLOURS =====================
IF theme = 2 THEN
   bsR = 0           // #00A86B
   bsG = 168
   bsB = 107
   beR = 0           // #00E5FF
   beG = 229
   beB = 255
   rsR = 213         // #D50000
   rsG = 0
   rsB = 0
   reR = 255         // #FF9100
   reG = 145
   reB = 0
ELSIF theme = 3 THEN
   bsR = 0           // #00B0FF
   bsG = 176
   bsB = 255
   beR = 0           // #00FFA3
   beG = 255
   beB = 163
   rsR = 245         // #F50057
   rsG = 0
   rsB = 87
   reR = 255         // #FF9100
   reG = 145
   reB = 0
ELSIF theme = 4 THEN
   bsR = cuBsR
   bsG = cuBsG
   bsB = cuBsB
   beR = cuBeR
   beG = cuBeG
   beB = cuBeB
   rsR = cuRsR
   rsG = cuRsG
   rsB = cuRsB
   reR = cuReR
   reG = cuReG
   reB = cuReB
ELSE
   bsR = 21          // Ocean: #1565C0 -> #4FC3F7 bullish, #E65100 -> #FFB300 bearish
   bsG = 101
   bsB = 192
   beR = 79
   beG = 195
   beB = 247
   rsR = 230
   rsG = 81
   rsB = 0
   reR = 255
   reG = 179
   reB = 0
ENDIF


// ===================== RSI -> STOCHASTIC -> FISHER TRANSFORM =====================
// The RSI is built by hand with Wilder's average seeded with the simple mean of the first changes
// (the standard Wilder RSI). The chain only produces values once every window is full:
// RSI from bar lenRsi, Stochastic from bar lenRsi + lenStoch - 1, Fisher from kStart.
lnR = max(1, round(lenRsi))
lnS = max(1, round(lenStoch))
lnF = max(1, round(fisherLen))
kStart = lnR + lnS + lnF - 2
warmBars = lnR + lnS + lnF


IF barindex >= 1 THEN
   chg = close - close[1]
ELSE
   chg = 0
ENDIF
gainV = max(chg, 0)
lossV = max(0 - chg, 0)
rsiOk = 0
IF barindex = lnR THEN
   upAv = summation[lnR](gainV) / lnR
   dnAv = summation[lnR](lossV) / lnR
ELSIF barindex > lnR THEN
   upAv = (upAv * (lnR - 1) + gainV) / lnR
   dnAv = (dnAv * (lnR - 1) + lossV) / lnR
ENDIF
IF barindex >= lnR THEN
   rsiOk = 1
   IF dnAv = 0 THEN
      rsiV = 100
   ELSIF upAv = 0 THEN
      rsiV = 0
   ELSE
      rsiV = 100 - 100 / (1 + upAv / dnAv)
   ENDIF
ELSE
   rsiV = 50
ENDIF


// Stochastic of the RSI (the RSI is its own high, low and close). A completely flat RSI window has
// no range: the Stochastic keeps its previous value there
stOk = 0
IF barindex >= lnR + lnS - 1 THEN
   stOk = 1
   rHi = highest[lnS](rsiV)
   rLo = lowest[lnS](rsiV)
   IF rHi > rLo THEN
      stochRsi = 100 * (rsiV - rLo) / (rHi - rLo)
   ENDIF
ELSE
   stochRsi = 50
ENDIF


kOk = 0
IF barindex >= kStart THEN
   kOk = 1
   fHi = highest[lnF](stochRsi)
   fLo = lowest[lnF](stochRsi)
   IF fHi - fLo = 0 THEN
      normSt = 0.5
   ELSE
      normSt = (stochRsi - fLo) / (fHi - fLo)
   ENDIF
   fiRaw = 0.66 * (normSt - 0.5) + 0.67 * fishIn[1]
   fishIn = max(min(fiRaw, 0.999), 0 - 0.999)
   fishK = 0.5 * log((1 + fishIn) / (1 - fishIn)) + 0.5 * fishK[1]
ELSE
   fishIn = 0
   fishK = 0
ENDIF


// Trigger and previous values: on the first Fisher bar there is no previous value, so the current one is used
IF barindex <= kStart THEN
   kPrev = fishK
ELSE
   kPrev = fishK[1]
ENDIF
kEma = average[max(1, round(trigLen)), 1](fishK)
IF trigMode = 1 THEN
   fishD = kEma
ELSE
   fishD = kPrev
ENDIF
IF barindex <= kStart THEN
   dPrev = fishD
ELSE
   dPrev = fishD[1]
ENDIF


// Synthetic Heikin-Ashi candle built from the Fisher and the Trigger (not a price candle)
haOpen = (kPrev + dPrev) / 2
haClose = (fishK + fishD) / 2
haHigh = max(fishK, max(fishD, max(haOpen, haClose)))
haLow = min(fishK, min(fishD, min(haClose, haOpen)))


// ===================== HIGHER TIMEFRAME BIAS =====================
// The bias reads the Fisher and Trigger of the last CLOSED higher timeframe candle, so it never
// repaints. The higher timeframe candles are rebuilt here from
// the chart candles, so any htfMin works on any lower chart without a TIMEFRAME block (a block lower
// than the chart stops the indicator). The whole RSI -> Stochastic -> Fisher chain runs once per
// higher timeframe candle, on its close, and its result stays fixed until the next one.
tfSec = GetTimeFrame
htfValid = 0
IF htfMin * 60 > tfSec THEN
   htfValid = 1
ENDIF
ONCE nH = 0
ONCE nHr = 0
ONCE nHs = 0
ONCE hSumG = 0
ONCE hSumL = 0
ONCE hRsiOk = 0
ONCE hKok = 0
ONCE hFi = 0
ONCE hK = 0
ONCE hD = 0
ONCE hKe = 0
ONCE hStV = 50
IF useHtf = 1 AND htfValid = 1 THEN
   mNow = floor(opentime / 10000) * 60 + (floor(opentime / 100) MOD 100)
   pdOpen = DOpen(1)
   pdClose = DClose(1)
   newBH = 0
   IF barindex = 0 THEN
      newBH = 1
   ELSIF htfMin >= 10080 THEN
      IF dayofweek < dayofweek[1] THEN
         newBH = 1
      ENDIF
   ELSIF htfMin >= 1440 THEN
      IF pdOpen <> pdOpen[1] OR pdClose <> pdClose[1] THEN
         newBH = 1
      ENDIF
   ELSIF date <> date[1] OR floor(mNow / htfMin) <> floor(mNow[1] / htfMin) THEN
      newBH = 1
   ENDIF
   // The first chart candle of a new period closes the previous higher timeframe candle with close[1].
   // Every write below is a pure assignment indexed by a counter, so a repeated tick writes the same
   IF newBH = 1 AND barindex > 0 THEN
      hc = close[1]
      nH = nH + 1
      IF nH >= 2 THEN
         hChg = hc - hPrevC
         nCh = nH - 1
         IF nCh <= lnR THEN
            hSumG = hSumG + max(hChg, 0)
            hSumL = hSumL + max(0 - hChg, 0)
            IF nCh = lnR THEN
               hUp = hSumG / lnR
               hDn = hSumL / lnR
               hRsiOk = 1
            ENDIF
         ELSE
            hUp = (hUp * (lnR - 1) + max(hChg, 0)) / lnR
            hDn = (hDn * (lnR - 1) + max(0 - hChg, 0)) / lnR
         ENDIF
      ENDIF
      hPrevC = hc
      IF hRsiOk = 1 THEN
         IF hDn = 0 THEN
            hRsi = 100
         ELSIF hUp = 0 THEN
            hRsi = 0
         ELSE
            hRsi = 100 - 100 / (1 + hUp / hDn)
         ENDIF
         $hRs[nHr MOD lnS] = hRsi
         nHr = nHr + 1
         IF nHr >= lnS THEN
            hMx = $hRs[0]
            hMn = $hRs[0]
            FOR q = 1 TO lnS - 1 DO
               hMx = max(hMx, $hRs[q])
               hMn = min(hMn, $hRs[q])
            NEXT
            IF hMx > hMn THEN
               hStV = 100 * (hRsi - hMn) / (hMx - hMn)
            ENDIF
            $hSt[nHs MOD lnF] = hStV
            nHs = nHs + 1
            IF nHs >= lnF THEN
               sMx = $hSt[0]
               sMn = $hSt[0]
               FOR q = 1 TO lnF - 1 DO
                  sMx = max(sMx, $hSt[q])
                  sMn = min(sMn, $hSt[q])
               NEXT
               IF sMx - sMn = 0 THEN
                  hNs = 0.5
               ELSE
                  hNs = (hStV - sMn) / (sMx - sMn)
               ENDIF
               hKold = hK
               hFi = max(min(0.66 * (hNs - 0.5) + 0.67 * hFi, 0.999), 0 - 0.999)
               hK = 0.5 * log((1 + hFi) / (1 - hFi)) + 0.5 * hK
               aE = 2 / (max(1, round(trigLen)) + 1)
               IF hKok = 0 THEN
                  hKe = hK
                  hKold = hK
               ELSE
                  hKe = hKe + aE * (hK - hKe)
               ENDIF
               IF trigMode = 1 THEN
                  hD = hKe
               ELSE
                  hD = hKold
               ENDIF
               hKok = 1
            ENDIF
         ENDIF
      ENDIF
   ENDIF
ENDIF
htfBull = 0
htfBear = 0
IF useHtf = 1 AND htfValid = 1 AND hKok = 1 THEN
   IF htfMode = 1 THEN
      IF hK > 0 THEN
         htfBull = 1
      ELSIF hK < 0 THEN
         htfBear = 1
      ENDIF
   ELSE
      IF hK > hD THEN
         htfBull = 1
      ELSIF hK < hD THEN
         htfBear = 1
      ENDIF
   ENDIF
ENDIF
htfOkBuy = 0
htfOkSell = 0
IF useHtf = 0 OR htfValid = 0 OR htfBull = 1 THEN
   htfOkBuy = 1
ENDIF
IF useHtf = 0 OR htfValid = 0 OR htfBear = 1 THEN
   htfOkSell = 1
ENDIF


// ===================== MOMENTUM AND ACCELERATION =====================
// Momentum = speed of the Fisher, acceleration = change of that speed. Each auto scale is the
// standard deviation over its lookback, used only once the lookback is full of Fisher values
// (before that, the manual scale)
IF momSource = 1 THEN
   rawMom = fishK - fishD
ELSE
   rawMom = fishK - kPrev
ENDIF
momV = average[max(1, round(momSmooth)), 1](rawMom)
IF barindex <= kStart THEN
   momPrev = momV
ELSE
   momPrev = momV[1]
ENDIF
rawAcc = momV - momPrev
accV = average[max(1, round(accSmooth)), 1](rawAcc)


momSd = std[max(2, round(momLookback))](momV)
IF autoMomRange = 1 AND barindex >= kStart + round(momLookback) - 1 AND momSd > 0.0001 THEN
   momRange = momSd * momMult
ELSE
   momRange = momRangeMan
ENDIF
IF autoHistScale = 1 THEN
   IF momRange > 0.0001 THEN
      histScale = 0.375 / momRange
   ELSE
      histScale = histScaleMan
   ENDIF
ELSE
   histScale = histScaleMan
ENDIF
IF momRange > 0.0001 THEN
   momInt = min(abs(momV) / momRange, 1)
ELSE
   momInt = 0
ENDIF


accSd = std[max(2, round(accLookback))](accV)
IF autoAccRange = 1 AND barindex >= kStart + round(accLookback) - 1 AND accSd > 0.0001 THEN
   accRange = accSd * accMult
ELSE
   accRange = accRangeMan
ENDIF
IF accRange > 0.0001 THEN
   accInt = min(abs(accV) / accRange, 1)
ELSE
   accInt = 0
ENDIF
IF autoAccScale = 1 THEN
   IF accRange > 0.0001 THEN
      accScale = 0.375 / accRange
   ELSE
      accScale = accScaleMan
   ENDIF
ELSE
   accScale = accScaleMan
ENDIF


kSd = std[max(2, round(gradLookback))](fishK)
IF autoGradRange = 1 AND barindex >= kStart + round(gradLookback) - 1 AND kSd > 0.0001 THEN
   gradRange = kSd * gradMult
ELSE
   gradRange = gradRangeMan
ENDIF


// ===================== EXHAUSTION AND EARLY REVERSAL =====================
momPeakUp = highest[max(1, round(exhLookback))](momV)
momPeakDn = lowest[max(1, round(exhLookback))](momV)
exhLongC = 0
exhShortC = 0
IF kOk = 1 AND showExh = 1 THEN
   IF fishK >= exhLevel AND momV > 0 AND accV < 0 AND momV <= momPeakUp * exhFade THEN
      exhLongC = 1
   ENDIF
   IF fishK <= 0 - exhLevel AND momV < 0 AND accV > 0 AND momV >= momPeakDn * exhFade THEN
      exhShortC = 1
   ENDIF
ENDIF
exhLongS = 0
exhShortS = 0
IF barindex >= warmBars THEN
   IF exhLongC = 1 AND exhLongC[1] = 0 THEN
      exhLongS = 1
   ENDIF
   IF exhShortC = 1 AND exhShortC[1] = 0 THEN
      exhShortS = 1
   ENDIF
ENDIF


IF accV > 0 THEN
   accUpCnt = accUpCnt + 1
ELSE
   accUpCnt = 0
ENDIF
IF accV < 0 THEN
   accDnCnt = accDnCnt + 1
ELSE
   accDnCnt = 0
ENDIF
kLowRec = lowest[max(1, round(erZoneLook))](fishK)
kHighRec = highest[max(1, round(erZoneLook))](fishK)
earlyBullC = 0
earlyBearC = 0
IF kOk = 1 AND showEarly = 1 THEN
   IF kLowRec <= 0 - erLevel AND fishK < fishD AND accUpCnt >= erBars AND accInt >= erMinInt THEN
      earlyBullC = 1
   ENDIF
   IF kHighRec >= erLevel AND fishK > fishD AND accDnCnt >= erBars AND accInt >= erMinInt THEN
      earlyBearC = 1
   ENDIF
ENDIF
earlyBullS = 0
earlyBearS = 0
IF barindex >= warmBars THEN
   IF earlyBullC = 1 AND earlyBullC[1] = 0 THEN
      earlyBullS = 1
   ENDIF
   IF earlyBearC = 1 AND earlyBearC[1] = 0 THEN
      earlyBearS = 1
   ENDIF
ENDIF


// Pre-signals feed the BUY+ / SELL+ confluence (bars since the last one)
ONCE lastPreBu = 0 - 100000
ONCE lastPreBe = 0 - 100000
IF earlyBullS = 1 OR exhShortS = 1 THEN
   lastPreBu = barindex
ENDIF
IF earlyBearS = 1 OR exhLongS = 1 THEN
   lastPreBe = barindex
ENDIF


// ===================== BUY / SELL (FISHER / TRIGGER CROSS) =====================
crossUp = 0
crossDn = 0
IF kOk = 1 AND barindex > kStart THEN
   IF fishK > fishD AND kPrev <= dPrev THEN
      crossUp = 1
   ENDIF
   IF fishK < fishD AND kPrev >= dPrev THEN
      crossDn = 1
   ENDIF
ENDIF
buyRaw = 0
sellRaw = 0
IF crossUp = 1 AND (crossFilter = 1 OR fishD <= 0 - obInner) AND htfOkBuy = 1 THEN
   buyRaw = 1
ENDIF
IF crossDn = 1 AND (crossFilter = 1 OR fishD >= obInner) AND htfOkSell = 1 THEN
   sellRaw = 1
ENDIF
ONCE lastBuyB = 0 - 100000
ONCE lastSellB = 0 - 100000
buySig = 0
sellSig = 0
IF buyRaw = 1 AND barindex - lastBuyB > sigCooldown THEN
   buySig = 1
   lastBuyB = barindex
ENDIF
IF sellRaw = 1 AND barindex - lastSellB > sigCooldown THEN
   sellSig = 1
   lastSellB = barindex
ENDIF
buyConf = 0
sellConf = 0
IF confMark = 1 AND buySig = 1 AND barindex - lastPreBu <= confWindow THEN
   buyConf = 1
ENDIF
IF confMark = 1 AND sellSig = 1 AND barindex - lastPreBe <= confWindow THEN
   sellConf = 1
ENDIF


// Last signal, for the dashboard: 1 BUY, 2 BUY+, -1 SELL, -2 SELL+
ONCE lastSig = 0
ONCE lastSigB = 0 - 1
IF buySig = 1 THEN
   lastSig = 1 + buyConf
   lastSigB = barindex
ENDIF
IF sellSig = 1 THEN
   lastSig = 0 - 1 - sellConf
   lastSigB = barindex
ENDIF


// Zone entries and zero line crosses (alerts)
enterOB = 0
enterOS = 0
zeroUp = 0
zeroDn = 0
IF kOk = 1 AND barindex > kStart THEN
   IF fishK > obInner AND kPrev <= obInner THEN
      enterOB = 1
   ENDIF
   IF fishK < 0 - obInner AND kPrev >= 0 - obInner THEN
      enterOS = 1
   ENDIF
   IF fishK > 0 AND kPrev <= 0 THEN
      zeroUp = 1
   ENDIF
   IF fishK < 0 AND kPrev >= 0 THEN
      zeroDn = 1
   ENDIF
ENDIF


// ===================== DIVERGENCE =====================
// Pivots of the Fisher with lbL bars on the left and lbR on the right: strict against the bars after
// the pivot and >= against the bars before it, so on a flat top the most recent bar is the pivot. The price is read
// from the high / low of the pivot bar. The previous pivot of each side is stored only AFTER it has
// been compared with the current one
pR = max(1, round(lbR))
pL = max(1, round(lbL))
kAft = highest[pR](fishK)
kAftL = lowest[pR](fishK)
kBef = highest[pL](fishK)
kBefL = lowest[pL](fishK)
curK = fishK[pR]
curPL = low[pR]
curPH = high[pR]
curB = barindex - pR
pivHi = 0
pivLo = 0
IF barindex >= kStart + pR + pL THEN
   IF curK > kAft AND curK >= kBef[pR + 1] THEN
      pivHi = 1
   ENDIF
   IF curK < kAftL AND curK <= kBefL[pR + 1] THEN
      pivLo = 1
   ENDIF
ENDIF
condHigh = 0
condLow = 0
IF pivHi = 1 AND (onlyZones = 0 OR curK >= obInner) THEN
   condHigh = 1
ENDIF
IF pivLo = 1 AND (onlyZones = 0 OR curK <= 0 - obInner) THEN
   condLow = 1
ENDIF
validData = 0
IF barindex >= warmBars + pL + pR THEN
   validData = 1
ENDIF


ONCE prvLoB = 0 - 1
ONCE prvHiB = 0 - 1
ONCE prvLoK = 0
ONCE prvLoP = 0
ONCE prvHiK = 0
ONCE prvHiP = 0
regBull = 0
hidBull = 0
regBear = 0
hidBear = 0
dvBuX1 = 0
dvBuY1 = 0
dvBeX1 = 0
dvBeY1 = 0
IF condLow = 1 THEN
   IF prvLoB >= 0 AND curB - prvLoB >= rangeLower AND curB - prvLoB <= rangeUpper AND validData = 1 THEN
      IF showRegular = 1 AND curK - prvLoK >= minFishDiff AND curK > prvLoK AND curPL < prvLoP THEN
         regBull = 1
      ENDIF
      IF showHidden = 1 AND prvLoK - curK >= minFishDiff AND curK < prvLoK AND curPL > prvLoP THEN
         hidBull = 1
      ENDIF
   ENDIF
   dvBuX1 = prvLoB
   dvBuY1 = prvLoK
   prvLoK = curK
   prvLoP = curPL
   prvLoB = curB
ENDIF
IF condHigh = 1 THEN
   IF prvHiB >= 0 AND curB - prvHiB >= rangeLower AND curB - prvHiB <= rangeUpper AND validData = 1 THEN
      IF showRegular = 1 AND prvHiK - curK >= minFishDiff AND curK < prvHiK AND curPH > prvHiP THEN
         regBear = 1
      ENDIF
      IF showHidden = 1 AND curK - prvHiK >= minFishDiff AND curK > prvHiK AND curPH < prvHiP THEN
         hidBear = 1
      ENDIF
   ENDIF
   dvBeX1 = prvHiB
   dvBeY1 = prvHiK
   prvHiK = curK
   prvHiP = curPH
   prvHiB = curB
ENDIF


// Last divergence, for the dashboard: 1 regular bull, 2 hidden bull, -1 regular bear, -2 hidden bear
ONCE lastDiv = 0
ONCE lastDivB = 0 - 1
IF regBull = 1 THEN
   lastDiv = 1
   lastDivB = curB
ENDIF
IF hidBull = 1 THEN
   lastDiv = 2
   lastDivB = curB
ENDIF
IF regBear = 1 THEN
   lastDiv = 0 - 1
   lastDivB = curB
ENDIF
IF hidBear = 1 THEN
   lastDiv = 0 - 2
   lastDivB = curB
ENDIF


// ===================== DRAWING =====================
// --- Candle colour ---
tG = (fishK + gradRange) / (2 * gradRange)
tG = max(0, min(1, tG))
IF haClose >= haOpen THEN
   posR = bsR + (beR - bsR) * tG
   posG = bsG + (beG - bsG) * tG
   posB = bsB + (beB - bsB) * tG
ELSE
   posR = reR + (rsR - reR) * tG
   posG = reG + (rsG - reG) * tG
   posB = reB + (rsB - reB) * tG
ENDIF
IF momV >= 0 THEN
   tM = 1
   IF momRange > 0 THEN
      tM = max(0, min(1, momV / momRange))
   ENDIF
   mcR = 120 + (beR - 120) * tM
   mcG = 123 + (beG - 123) * tM
   mcB = 134 + (beB - 134) * tM
ELSE
   tM = 0
   IF momRange > 0 THEN
      tM = max(0, min(1, (momV + momRange) / momRange))
   ENDIF
   mcR = rsR + (120 - rsR) * tM
   mcG = rsG + (123 - rsG) * tM
   mcB = rsB + (134 - rsB) * tM
ENDIF
// Speedometer: lime -> yellow -> red with the momentum intensity
IF momInt <= spdMidThr THEN
   tS = max(0, min(1, momInt / spdMidThr))
   spR = 0 + (253 - 0) * tS
   spG = 230 + (216 - 230) * tS
   spB = 118 + (53 - 118) * tS
ELSE
   tS = max(0, min(1, (momInt - spdMidThr) / (1 - spdMidThr)))
   spR = 253 + (242 - 253) * tS
   spG = 216 + (54 - 216) * tS
   spB = 53 + (69 - 53) * tS
ENDIF
IF colorMode = 2 THEN
   barR = mcR
   barG = mcG
   barB = mcB
ELSIF colorMode = 3 THEN
   barR = spR
   barG = spG
   barB = spB
ELSE
   barR = posR
   barG = posG
   barB = posB
ENDIF
// Border (and wick: DRAWCANDLE paints the wick with the border colour)
borR = barR
borG = barG
borB = barB
IF colorMode = 3 AND showSpdBorder = 1 THEN
   IF haClose >= haOpen THEN
      borR = 255
      borG = 255
      borB = 255
   ELSE
      borR = 0
      borG = 0
      borB = 0
   ENDIF
ELSIF colorMode = 1 AND showMomGauge = 1 AND momInt >= momBorderThr THEN
   IF momV >= 0 THEN
      borR = gaBuR
      borG = gaBuG
      borB = gaBuB
   ELSE
      borR = gaBeR
      borG = gaBeG
      borB = gaBeB
   ENDIF
ENDIF


// --- Zones: the five horizontal levels are drawn once, the zone fills on every bar ---
IF barindex = 0 THEN
   DRAWHLINE(0) COLOURED(212, 115, 5, 161)
   DRAWHLINE(obOuter) COLOURED(255, 82, 82, 20) STYLE(dottedline)
   DRAWHLINE(obInner) COLOURED(255, 82, 82, 20) STYLE(dottedline)
   DRAWHLINE(0 - obInner) COLOURED(122, 255, 82, 20) STYLE(dottedline)
   DRAWHLINE(0 - obOuter) COLOURED(122, 255, 82, 20) STYLE(dottedline)
ENDIF
COLORBETWEEN(obOuter, obInner, 255, 82, 82, 20)
COLORBETWEEN(0 - obInner, 0 - obOuter, 122, 255, 82, 20)


IF kOk = 1 THEN
   IF showZoneBg = 1 THEN
      IF fishK >= obOuter THEN
         BACKGROUNDCOLOR(rsR, rsG, rsB, 31)
      ELSIF fishK <= 0 - obOuter THEN
         BACKGROUNDCOLOR(bsR, bsG, bsB, 31)
      ENDIF
   ENDIF
   DRAWCANDLE(haOpen, haHigh, haLow, haClose) COLOURED(barR, barG, barB) BORDERCOLOR(borR, borG, borB)
ENDIF


// --- Fill between Fisher and Trigger ---
IF fishK >= fishD THEN
   flR = beR
   flG = beG
   flB = beB
ELSE
   flR = rsR
   flG = rsG
   flB = rsB
ENDIF
flA = 0
IF showFill = 1 AND kOk = 1 THEN
   flA = 46
ENDIF
COLORBETWEEN(fishK, fishD, flR, flG, flB, flA)


// --- Label layout: offset scaled to the Fisher range of the last 200 bars ---
kSpan = highest[200](fishK) - lowest[200](fishK)
IF autoGap = 1 THEN
   gapV = max(0.1, kSpan * 0.06)
ELSE
   gapV = markGap
ENDIF
markTop = highest[200](haHigh) + gapV
markBot = lowest[200](haLow) - gapV
// Bullish labels hang below the candle, bearish labels sit above it. Simultaneous markers of a side
// (BUY, SX, ER / SELL, LX, ER) are stacked one per line, in that order
nBu = 0
IF showTurns = 1 AND buySig = 1 THEN
   nBu = nBu + 1
ENDIF
IF exhShortS = 1 THEN
   nBu = nBu + 1
ENDIF
IF earlyBullS = 1 THEN
   nBu = nBu + 1
ENDIF
nBe = 0
IF showTurns = 1 AND sellSig = 1 THEN
   nBe = nBe + 1
ENDIF
IF exhLongS = 1 THEN
   nBe = nBe + 1
ENDIF
IF earlyBearS = 1 THEN
   nBe = nBe + 1
ENDIF


// --- Events of the bar that has just CLOSED (offset 1), drawn on that bar ---
IF barindex > warmBars THEN
   xE = barindex - 1
   // Bullish stack
   lnB = 0
   IF showTurns = 1 AND buySig[1] = 1 THEN
      yT = haLow[1] - (0.7 + lnB) * gapV[1]
      IF buyConf[1] = 1 THEN
         DRAWTEXT("BUY+", xE, yT, dialog, bold, 9) COLOURED(21, 101, 192, 255)
      ELSE
         DRAWTEXT("BUY", xE, yT, dialog, bold, 9) COLOURED(21, 101, 192, 255)
      ENDIF
      lnB = lnB + 1
   ENDIF
   IF exhShortS[1] = 1 THEN
      yT = haLow[1] - (0.7 + lnB) * gapV[1]
      DRAWTEXT("SX", xE, yT, dialog, bold, 9) COLOURED(0, 200, 83, 255)
      lnB = lnB + 1
   ENDIF
   IF earlyBullS[1] = 1 THEN
      yT = haLow[1] - (0.7 + lnB) * gapV[1]
      DRAWTEXT("ER", xE, yT, dialog, bold, 9) COLOURED(255, 171, 0, 255)
   ENDIF
   // Bearish stack: the first line is the highest one
   lnB = 0
   IF showTurns = 1 AND sellSig[1] = 1 THEN
      yT = haHigh[1] + (0.7 + nBe[1] - 1 - lnB) * gapV[1]
      IF sellConf[1] = 1 THEN
         DRAWTEXT("SELL+", xE, yT, dialog, bold, 9) COLOURED(230, 81, 0, 255)
      ELSE
         DRAWTEXT("SELL", xE, yT, dialog, bold, 9) COLOURED(230, 81, 0, 255)
      ENDIF
      lnB = lnB + 1
   ENDIF
   IF exhLongS[1] = 1 THEN
      yT = haHigh[1] + (0.7 + nBe[1] - 1 - lnB) * gapV[1]
      DRAWTEXT("LX", xE, yT, dialog, bold, 9) COLOURED(255, 64, 129, 255)
      lnB = lnB + 1
   ENDIF
   IF earlyBearS[1] = 1 THEN
      yT = haHigh[1] + (0.7 + nBe[1] - 1 - lnB) * gapV[1]
      DRAWTEXT("ER", xE, yT, dialog, bold, 9) COLOURED(179, 136, 255, 255)
   ENDIF
   // Strong acceleration / deceleration markers, at the top and bottom of the recent range
   IF showAccMarks = 1 AND kOk[1] = 1 AND accInt[1] >= accMarkThr THEN
      IF accV[1] >= 0 THEN
         DRAWTEXT("▲", xE, markTop[1], dialog, standard, 8) COLOURED(255, 152, 0, 255)
      ELSE
         DRAWTEXT("▼", xE, markBot[1], dialog, standard, 8) COLOURED(8, 153, 129, 255)
      ENDIF
   ENDIF
   // Divergences: line from the previous pivot to the current one, tag on the current pivot
   IF regBull[1] = 1 OR hidBull[1] = 1 THEN
      xP = curB[1]
      yTag = min(haLow[pR + 1], curK[1]) - 3.5 * gapV[1]
      IF regBull[1] = 1 THEN
         dvR = 76
         dvG = 175
         dvB = 80
         dvA = 255
         DRAWTEXT("R-Bull", xP, yTag, dialog, bold, 9) COLOURED(dvR, dvG, dvB, dvA)
      ELSE
         dvR = 76
         dvG = 175
         dvB = 80
         dvA = 128
         DRAWTEXT("H-Bull", xP, yTag, dialog, bold, 9) COLOURED(dvR, dvG, dvB, dvA)
      ENDIF
      IF showDivLines = 1 THEN
         IF divLineWidth >= 4 THEN
            DRAWSEGMENT(dvBuX1[1], dvBuY1[1], xP, curK[1]) COLOURED(dvR, dvG, dvB, dvA) STYLE(line, 4)
         ELSIF divLineWidth >= 3 THEN
            DRAWSEGMENT(dvBuX1[1], dvBuY1[1], xP, curK[1]) COLOURED(dvR, dvG, dvB, dvA) STYLE(line, 3)
         ELSIF divLineWidth >= 2 THEN
            DRAWSEGMENT(dvBuX1[1], dvBuY1[1], xP, curK[1]) COLOURED(dvR, dvG, dvB, dvA) STYLE(line, 2)
         ELSE
            DRAWSEGMENT(dvBuX1[1], dvBuY1[1], xP, curK[1]) COLOURED(dvR, dvG, dvB, dvA) STYLE(line, 1)
         ENDIF
      ENDIF
   ENDIF
   IF regBear[1] = 1 OR hidBear[1] = 1 THEN
      xP = curB[1]
      yTag = max(haHigh[pR + 1], curK[1]) + 3.5 * gapV[1]
      IF regBear[1] = 1 THEN
         dvR = 242
         dvG = 54
         dvB = 69
         dvA = 255
         DRAWTEXT("R-Bear", xP, yTag, dialog, bold, 9) COLOURED(dvR, dvG, dvB, dvA)
      ELSE
         dvR = 242
         dvG = 54
         dvB = 69
         dvA = 128
         DRAWTEXT("H-Bear", xP, yTag, dialog, bold, 9) COLOURED(dvR, dvG, dvB, dvA)
      ENDIF
      IF showDivLines = 1 THEN
         IF divLineWidth >= 4 THEN
            DRAWSEGMENT(dvBeX1[1], dvBeY1[1], xP, curK[1]) COLOURED(dvR, dvG, dvB, dvA) STYLE(line, 4)
         ELSIF divLineWidth >= 3 THEN
            DRAWSEGMENT(dvBeX1[1], dvBeY1[1], xP, curK[1]) COLOURED(dvR, dvG, dvB, dvA) STYLE(line, 3)
         ELSIF divLineWidth >= 2 THEN
            DRAWSEGMENT(dvBeX1[1], dvBeY1[1], xP, curK[1]) COLOURED(dvR, dvG, dvB, dvA) STYLE(line, 2)
         ELSE
            DRAWSEGMENT(dvBeX1[1], dvBeY1[1], xP, curK[1]) COLOURED(dvR, dvG, dvB, dvA) STYLE(line, 1)
         ENDIF
      ENDIF
   ENDIF
ENDIF


// --- Returned series: visibility is the alpha channel, never "undefined" ---
// Momentum histogram: solid while momentum strengthens (same sign as its change), faded while it weakens
histV = momV * histScale
IF momV >= 0 THEN
   hsR = beR
   hsG = beG
   hsB = beB
ELSE
   hsR = rsR
   hsG = rsG
   hsB = rsB
ENDIF
IF momV * accV > 0 THEN
   hsA = 255
ELSE
   hsA = 71
ENDIF
IF showMomHist = 0 OR kOk = 0 THEN
   hsA = 0
ENDIF
lnA = 0
IF showFisherLine = 1 AND kOk = 1 THEN
   lnA = 255
ENDIF
accLine = accV * accScale
IF accV >= 0 THEN
   acR = 255
   acG = 152
   acB = 0
ELSE
   acR = 8
   acG = 153
   acB = 129
ENDIF
acA = 0
IF showAccel = 1 AND kOk = 1 THEN
   acA = 255
ENDIF


// Signal series for the alert tool, all of the CLOSED bar (offset 1), like the labels.
// Invisible (alpha 0), but the alert builder lists every serie of the RETURN:
//   Sig Cross       crosses over 0.5 -> BUY, over 1.5 -> BUY+, under -0.5 -> SELL, under -1.5 -> SELL+
//   Sig Regular     crosses over 0.5 -> regular bullish divergence, under -0.5 -> regular bearish
//   Sig Hidden      crosses over 0.5 -> hidden bullish divergence, under -0.5 -> hidden bearish
//   Sig Zone        crosses over 0.5 -> Fisher enters the overbought zone, under -0.5 -> oversold
//   Sig Zero        crosses over 0.5 -> Fisher crosses above zero, under -0.5 -> below zero
//   Sig Exhaustion  crosses over 0.5 -> short exhaustion (SX), under -0.5 -> long exhaustion (LX)
//   Sig Early       crosses over 0.5 -> early bullish reversal, under -0.5 -> early bearish reversal
sigCross = 0
sigReg = 0
sigHid = 0
sigZone = 0
sigZero = 0
sigExh = 0
sigEarly = 0
IF barindex >= 1 THEN
   sigCross = buySig[1] * (1 + buyConf[1]) - sellSig[1] * (1 + sellConf[1])
   sigReg = regBull[1] - regBear[1]
   sigHid = hidBull[1] - hidBear[1]
   sigZone = enterOB[1] - enterOS[1]
   sigZero = zeroUp[1] - zeroDn[1]
   sigExh = exhShortS[1] - exhLongS[1]
   sigEarly = earlyBullS[1] - earlyBearS[1]
ENDIF


RETURN histV COLOURED(hsR, hsG, hsB, hsA) STYLE(histogram) AS "Momentum Histogram", fishK COLOURED(41, 98, 255, lnA) STYLE(line, 1) AS "Fisher", fishD COLOURED(255, 109, 0, lnA) STYLE(line, 1) AS "Trigger", accLine COLOURED(acR, acG, acB, acA) STYLE(line, 2) AS "Acceleration Line", sigCross COLOURED(0, 0, 0, 0) AS "Sig Cross", sigReg COLOURED(0, 0, 0, 0) AS "Sig Regular", sigHid COLOURED(0, 0, 0, 0) AS "Sig Hidden", sigZone COLOURED(0, 0, 0, 0) AS "Sig Zone", sigZero COLOURED(0, 0, 0, 0) AS "Sig Zero", sigExh COLOURED(0, 0, 0, 0) AS "Sig Exhaustion", sigEarly COLOURED(0, 0, 0, 0) AS "Sig Early"
The Code: FishStoc Dashboard
//-----------------------------------------------------------------------
//PRC_FishStoc Dashboard
//version = 0
//02.11.2026
//Iván González @ www.prorealcode.com
//Author: mehmetbezgincan
//Sharing ProRealTime knowledge
//-----------------------------------------------------------------------
// Companion of PRC_FishStoc: its status dashboard.
// Add it to the SAME panel as PRC_FishStoc and give both the same settings.
//
// It runs the very same calculation as PRC_FishStoc (same inputs, same
// engine) and only draws the dashboard, on the last bar. It lives in its own
// indicator because the FishStoc candles are drawn bar by bar with
// DRAWCANDLE, and an indicator that redraws a panel on the last bar only
// (drawonlastbaronly) cannot draw those candles.
//
// Fisher, zone, momentum, acceleration, exhaustion and early reversal are
// read live, on the current bar. The last signal and the last divergence
// come from closed bars only, like the labels of PRC_FishStoc.
//-----------------------------------------------------------------------
defparam drawonlastbaronly = true
// --- Dashboard ---
dashPos = 2 // 1 = top left, 2 = top right, 3 = bottom left, 4 = bottom right
// ===================== INPUTS =====================
// --- Core ---
lenRsi = 14 // RSI length
lenStoch = 14 // Stochastic length
fisherLen = 9 // Fisher normalisation length (lookback that maps the Stochastic RSI to 0..1)
showFisherLine = 1 // 1 = Fisher and Trigger lines
// --- Trigger line ---
trigMode = 0 // 0 = classic (Trigger = previous Fisher), 1 = smoothed (EMA of the Fisher)
trigLen = 3 // EMA length of the smoothed Trigger
// --- Overbought / oversold zones ---
obInner = 0.75 // inner level of the zones (+/-), also used by the cross filter
obOuter = 1.5 // outer level of the zones (+/-) and extreme background trigger
// --- Theme and visuals ---
theme = 1 // 1 = Ocean, 2 = Classic, 3 = Neon, 4 = Custom (the four colours below)
cuBsR = 0 // custom bullish start #00A86B
cuBsG = 168
cuBsB = 107
cuBeR = 0 // custom bullish end #00E5FF
cuBeG = 229
cuBeB = 255
cuRsR = 213 // custom bearish start #D50000
cuRsG = 0
cuRsB = 0
cuReR = 255 // custom bearish end #FF9100
cuReG = 145
cuReB = 0
showZoneBg = 0 // 1 = tint the panel while the Fisher is beyond the outer level
showFill = 1 // 1 = fill between Fisher and Trigger
colorMode = 1 // candle colour: 1 = position (Fisher level), 2 = momentum, 3 = speedometer
autoGradRange = 1 // 1 = gradient scale from the standard deviation of the Fisher
gradRangeMan = 2.0 // manual gradient limit (+/-)
gradLookback = 100 // auto scale lookback
gradMult = 2.0 // auto scale multiplier (x standard deviation)
// --- Higher timeframe filter ---
useHtf = 0 // 1 = BUY needs a bullish higher timeframe bias, SELL a bearish one
htfMin = 240 // higher timeframe in minutes (240 = 4 hours, 1440 = daily, 10080 = weekly)
htfMode = 0 // 0 = direction (Fisher vs Trigger), 1 = level (Fisher vs 0)
// --- Momentum ---
momSource = 0 // 0 = bar to bar change of the Fisher, 1 = Fisher minus Trigger
momSmooth = 1 // momentum smoothing (EMA, 1 = off)
autoMomRange = 1 // 1 = momentum scale from its standard deviation
momRangeMan = 0.5 // manual momentum scale (+/-)
momLookback = 100 // auto scale lookback
momMult = 2.0 // auto scale multiplier
showMomHist = 1 // 1 = momentum histogram
autoHistScale = 1 // 1 = histogram scaled to the panel automatically
histScaleMan = 4.0 // manual histogram multiplier
showMomGauge = 1 // 1 = candle border and wick take the momentum colour when it is strong (position mode)
momBorderThr = 0.5 // border intensity threshold (0 to 1)
gaBuR = 255 // border colour, momentum rising #FFEE00
gaBuG = 238
gaBuB = 0
gaBeR = 0 // border colour, momentum falling #00E5FF
gaBeG = 229
gaBeB = 255
// --- Speedometer mode ---
spdMidThr = 0.5 // yellow threshold (intensity 0 to 1)
showSpdBorder = 1 // 1 = white / black border by candle direction
// --- Acceleration ---
showAccel = 0 // 1 = acceleration line
accSmooth = 1 // acceleration smoothing (EMA, 1 = off)
autoAccRange = 1 // 1 = acceleration scale from its standard deviation
accRangeMan = 0.25 // manual acceleration scale
accLookback = 100 // auto scale lookback
accMult = 2.0 // auto scale multiplier
showAccMarks = 1 // 1 = triangles on strong acceleration / deceleration
accMarkThr = 0.75 // marker threshold (intensity 0 to 1)
autoAccScale = 1 // 1 = acceleration line scaled to the panel automatically
accScaleMan = 4.0 // manual acceleration line multiplier
// --- Exhaustion (long / short) ---
showExh = 1 // 1 = LX / SX labels
exhLevel = 1.0 // the Fisher must be beyond this level (+/-)
exhLookback = 5 // peak momentum lookback
exhFade = 0.6 // momentum must have faded to this fraction of its recent peak
markGap = 0.25 // manual offset of the divergence tags (used when autoGap = 0)
// --- Early reversal ---
showEarly = 1 // 1 = ER labels
erLevel = 0.5 // zone level the Fisher must have reached (+/-)
erZoneLook = 5 // zone touch lookback
erBars = 2 // bars the acceleration must stay on the reversal side
erMinInt = 0.15 // minimum acceleration intensity (0 to 1)
// --- Confluence ---
confMark = 1 // 1 = BUY / SELL after an early reversal or opposite exhaustion becomes BUY+ / SELL+
confWindow = 3 // confluence window, in bars
// --- BUY / SELL labels ---
showTurns = 1 // 1 = BUY / SELL labels on the Fisher / Trigger cross
crossFilter = 0 // 0 = only crosses from the zones (Trigger beyond the inner level), 1 = all crosses
sigCooldown = 0 // minimum bars between two signals of the same side (0 = off)
// --- Label layout ---
autoGap = 1 // 1 = label offset scaled to the recent Fisher range
// --- Divergence ---
showRegular = 1 // 1 = regular divergences
showHidden = 1 // 1 = hidden divergences
onlyZones = 0 // 1 = only pivots beyond the inner zone level
lbR = 5 // pivot right bars
lbL = 5 // pivot left bars
rangeUpper = 60 // maximum bars between the two pivots
rangeLower = 5 // minimum bars between the two pivots
minFishDiff = 0.10 // the two Fisher pivots must differ by at least this much (0 = off)
showDivLines = 1 // 1 = connect the pivots with a line
divLineWidth = 1 // line width (1 to 4)
// ===================== COLOURS =====================
IF theme = 2 THEN
bsR = 0 // #00A86B
bsG = 168
bsB = 107
beR = 0 // #00E5FF
beG = 229
beB = 255
rsR = 213 // #D50000
rsG = 0
rsB = 0
reR = 255 // #FF9100
reG = 145
reB = 0
ELSIF theme = 3 THEN
bsR = 0 // #00B0FF
bsG = 176
bsB = 255
beR = 0 // #00FFA3
beG = 255
beB = 163
rsR = 245 // #F50057
rsG = 0
rsB = 87
reR = 255 // #FF9100
reG = 145
reB = 0
ELSIF theme = 4 THEN
bsR = cuBsR
bsG = cuBsG
bsB = cuBsB
beR = cuBeR
beG = cuBeG
beB = cuBeB
rsR = cuRsR
rsG = cuRsG
rsB = cuRsB
reR = cuReR
reG = cuReG
reB = cuReB
ELSE
bsR = 21 // Ocean: #1565C0 -> #4FC3F7 bullish, #E65100 -> #FFB300 bearish
bsG = 101
bsB = 192
beR = 79
beG = 195
beB = 247
rsR = 230
rsG = 81
rsB = 0
reR = 255
reG = 179
reB = 0
ENDIF
// ===================== RSI -> STOCHASTIC -> FISHER TRANSFORM =====================
// The RSI is built by hand with Wilder's average seeded with the simple mean of the first changes
// (the standard Wilder RSI). The chain only produces values once every window is full:
// RSI from bar lenRsi, Stochastic from bar lenRsi + lenStoch - 1, Fisher from kStart.
lnR = max(1, round(lenRsi))
lnS = max(1, round(lenStoch))
lnF = max(1, round(fisherLen))
kStart = lnR + lnS + lnF - 2
warmBars = lnR + lnS + lnF
IF barindex >= 1 THEN
chg = close - close[1]
ELSE
chg = 0
ENDIF
gainV = max(chg, 0)
lossV = max(0 - chg, 0)
rsiOk = 0
IF barindex = lnR THEN
upAv = summation[lnR](gainV) / lnR
dnAv = summation[lnR](lossV) / lnR
ELSIF barindex > lnR THEN
upAv = (upAv * (lnR - 1) + gainV) / lnR
dnAv = (dnAv * (lnR - 1) + lossV) / lnR
ENDIF
IF barindex >= lnR THEN
rsiOk = 1
IF dnAv = 0 THEN
rsiV = 100
ELSIF upAv = 0 THEN
rsiV = 0
ELSE
rsiV = 100 - 100 / (1 + upAv / dnAv)
ENDIF
ELSE
rsiV = 50
ENDIF
// Stochastic of the RSI (the RSI is its own high, low and close). A completely flat RSI window has
// no range: the Stochastic keeps its previous value there
stOk = 0
IF barindex >= lnR + lnS - 1 THEN
stOk = 1
rHi = highest[lnS](rsiV)
rLo = lowest[lnS](rsiV)
IF rHi > rLo THEN
stochRsi = 100 * (rsiV - rLo) / (rHi - rLo)
ENDIF
ELSE
stochRsi = 50
ENDIF
kOk = 0
IF barindex >= kStart THEN
kOk = 1
fHi = highest[lnF](stochRsi)
fLo = lowest[lnF](stochRsi)
IF fHi - fLo = 0 THEN
normSt = 0.5
ELSE
normSt = (stochRsi - fLo) / (fHi - fLo)
ENDIF
fiRaw = 0.66 * (normSt - 0.5) + 0.67 * fishIn[1]
fishIn = max(min(fiRaw, 0.999), 0 - 0.999)
fishK = 0.5 * log((1 + fishIn) / (1 - fishIn)) + 0.5 * fishK[1]
ELSE
fishIn = 0
fishK = 0
ENDIF
// Trigger and previous values: on the first Fisher bar there is no previous value, so the current one is used
IF barindex <= kStart THEN
kPrev = fishK
ELSE
kPrev = fishK[1]
ENDIF
kEma = average[max(1, round(trigLen)), 1](fishK)
IF trigMode = 1 THEN
fishD = kEma
ELSE
fishD = kPrev
ENDIF
IF barindex <= kStart THEN
dPrev = fishD
ELSE
dPrev = fishD[1]
ENDIF
// Synthetic Heikin-Ashi candle built from the Fisher and the Trigger (not a price candle)
haOpen = (kPrev + dPrev) / 2
haClose = (fishK + fishD) / 2
haHigh = max(fishK, max(fishD, max(haOpen, haClose)))
haLow = min(fishK, min(fishD, min(haClose, haOpen)))
// ===================== HIGHER TIMEFRAME BIAS =====================
// The bias reads the Fisher and Trigger of the last CLOSED higher timeframe candle, so it never
// repaints. The higher timeframe candles are rebuilt here from
// the chart candles, so any htfMin works on any lower chart without a TIMEFRAME block (a block lower
// than the chart stops the indicator). The whole RSI -> Stochastic -> Fisher chain runs once per
// higher timeframe candle, on its close, and its result stays fixed until the next one.
tfSec = GetTimeFrame
htfValid = 0
IF htfMin * 60 > tfSec THEN
htfValid = 1
ENDIF
ONCE nH = 0
ONCE nHr = 0
ONCE nHs = 0
ONCE hSumG = 0
ONCE hSumL = 0
ONCE hRsiOk = 0
ONCE hKok = 0
ONCE hFi = 0
ONCE hK = 0
ONCE hD = 0
ONCE hKe = 0
ONCE hStV = 50
IF useHtf = 1 AND htfValid = 1 THEN
mNow = floor(opentime / 10000) * 60 + (floor(opentime / 100) MOD 100)
pdOpen = DOpen(1)
pdClose = DClose(1)
newBH = 0
IF barindex = 0 THEN
newBH = 1
ELSIF htfMin >= 10080 THEN
IF dayofweek < dayofweek[1] THEN
newBH = 1
ENDIF
ELSIF htfMin >= 1440 THEN
IF pdOpen <> pdOpen[1] OR pdClose <> pdClose[1] THEN
newBH = 1
ENDIF
ELSIF date <> date[1] OR floor(mNow / htfMin) <> floor(mNow[1] / htfMin) THEN
newBH = 1
ENDIF
// The first chart candle of a new period closes the previous higher timeframe candle with close[1].
// Every write below is a pure assignment indexed by a counter, so a repeated tick writes the same
IF newBH = 1 AND barindex > 0 THEN
hc = close[1]
nH = nH + 1
IF nH >= 2 THEN
hChg = hc - hPrevC
nCh = nH - 1
IF nCh <= lnR THEN
hSumG = hSumG + max(hChg, 0)
hSumL = hSumL + max(0 - hChg, 0)
IF nCh = lnR THEN
hUp = hSumG / lnR
hDn = hSumL / lnR
hRsiOk = 1
ENDIF
ELSE
hUp = (hUp * (lnR - 1) + max(hChg, 0)) / lnR
hDn = (hDn * (lnR - 1) + max(0 - hChg, 0)) / lnR
ENDIF
ENDIF
hPrevC = hc
IF hRsiOk = 1 THEN
IF hDn = 0 THEN
hRsi = 100
ELSIF hUp = 0 THEN
hRsi = 0
ELSE
hRsi = 100 - 100 / (1 + hUp / hDn)
ENDIF
$hRs[nHr MOD lnS] = hRsi
nHr = nHr + 1
IF nHr >= lnS THEN
hMx = $hRs[0]
hMn = $hRs[0]
FOR q = 1 TO lnS - 1 DO
hMx = max(hMx, $hRs[q])
hMn = min(hMn, $hRs[q])
NEXT
IF hMx > hMn THEN
hStV = 100 * (hRsi - hMn) / (hMx - hMn)
ENDIF
$hSt[nHs MOD lnF] = hStV
nHs = nHs + 1
IF nHs >= lnF THEN
sMx = $hSt[0]
sMn = $hSt[0]
FOR q = 1 TO lnF - 1 DO
sMx = max(sMx, $hSt[q])
sMn = min(sMn, $hSt[q])
NEXT
IF sMx - sMn = 0 THEN
hNs = 0.5
ELSE
hNs = (hStV - sMn) / (sMx - sMn)
ENDIF
hKold = hK
hFi = max(min(0.66 * (hNs - 0.5) + 0.67 * hFi, 0.999), 0 - 0.999)
hK = 0.5 * log((1 + hFi) / (1 - hFi)) + 0.5 * hK
aE = 2 / (max(1, round(trigLen)) + 1)
IF hKok = 0 THEN
hKe = hK
hKold = hK
ELSE
hKe = hKe + aE * (hK - hKe)
ENDIF
IF trigMode = 1 THEN
hD = hKe
ELSE
hD = hKold
ENDIF
hKok = 1
ENDIF
ENDIF
ENDIF
ENDIF
ENDIF
htfBull = 0
htfBear = 0
IF useHtf = 1 AND htfValid = 1 AND hKok = 1 THEN
IF htfMode = 1 THEN
IF hK > 0 THEN
htfBull = 1
ELSIF hK < 0 THEN
htfBear = 1
ENDIF
ELSE
IF hK > hD THEN
htfBull = 1
ELSIF hK < hD THEN
htfBear = 1
ENDIF
ENDIF
ENDIF
htfOkBuy = 0
htfOkSell = 0
IF useHtf = 0 OR htfValid = 0 OR htfBull = 1 THEN
htfOkBuy = 1
ENDIF
IF useHtf = 0 OR htfValid = 0 OR htfBear = 1 THEN
htfOkSell = 1
ENDIF
// ===================== MOMENTUM AND ACCELERATION =====================
// Momentum = speed of the Fisher, acceleration = change of that speed. Each auto scale is the
// standard deviation over its lookback, used only once the lookback is full of Fisher values
// (before that, the manual scale)
IF momSource = 1 THEN
rawMom = fishK - fishD
ELSE
rawMom = fishK - kPrev
ENDIF
momV = average[max(1, round(momSmooth)), 1](rawMom)
IF barindex <= kStart THEN
momPrev = momV
ELSE
momPrev = momV[1]
ENDIF
rawAcc = momV - momPrev
accV = average[max(1, round(accSmooth)), 1](rawAcc)
momSd = std[max(2, round(momLookback))](momV)
IF autoMomRange = 1 AND barindex >= kStart + round(momLookback) - 1 AND momSd > 0.0001 THEN
momRange = momSd * momMult
ELSE
momRange = momRangeMan
ENDIF
IF autoHistScale = 1 THEN
IF momRange > 0.0001 THEN
histScale = 0.375 / momRange
ELSE
histScale = histScaleMan
ENDIF
ELSE
histScale = histScaleMan
ENDIF
IF momRange > 0.0001 THEN
momInt = min(abs(momV) / momRange, 1)
ELSE
momInt = 0
ENDIF
accSd = std[max(2, round(accLookback))](accV)
IF autoAccRange = 1 AND barindex >= kStart + round(accLookback) - 1 AND accSd > 0.0001 THEN
accRange = accSd * accMult
ELSE
accRange = accRangeMan
ENDIF
IF accRange > 0.0001 THEN
accInt = min(abs(accV) / accRange, 1)
ELSE
accInt = 0
ENDIF
IF autoAccScale = 1 THEN
IF accRange > 0.0001 THEN
accScale = 0.375 / accRange
ELSE
accScale = accScaleMan
ENDIF
ELSE
accScale = accScaleMan
ENDIF
kSd = std[max(2, round(gradLookback))](fishK)
IF autoGradRange = 1 AND barindex >= kStart + round(gradLookback) - 1 AND kSd > 0.0001 THEN
gradRange = kSd * gradMult
ELSE
gradRange = gradRangeMan
ENDIF
// ===================== EXHAUSTION AND EARLY REVERSAL =====================
momPeakUp = highest[max(1, round(exhLookback))](momV)
momPeakDn = lowest[max(1, round(exhLookback))](momV)
exhLongC = 0
exhShortC = 0
IF kOk = 1 AND showExh = 1 THEN
IF fishK >= exhLevel AND momV > 0 AND accV < 0 AND momV <= momPeakUp * exhFade THEN
exhLongC = 1
ENDIF
IF fishK <= 0 - exhLevel AND momV < 0 AND accV > 0 AND momV >= momPeakDn * exhFade THEN
exhShortC = 1
ENDIF
ENDIF
exhLongS = 0
exhShortS = 0
IF barindex >= warmBars THEN
IF exhLongC = 1 AND exhLongC[1] = 0 THEN
exhLongS = 1
ENDIF
IF exhShortC = 1 AND exhShortC[1] = 0 THEN
exhShortS = 1
ENDIF
ENDIF
IF accV > 0 THEN
accUpCnt = accUpCnt + 1
ELSE
accUpCnt = 0
ENDIF
IF accV < 0 THEN
accDnCnt = accDnCnt + 1
ELSE
accDnCnt = 0
ENDIF
kLowRec = lowest[max(1, round(erZoneLook))](fishK)
kHighRec = highest[max(1, round(erZoneLook))](fishK)
earlyBullC = 0
earlyBearC = 0
IF kOk = 1 AND showEarly = 1 THEN
IF kLowRec <= 0 - erLevel AND fishK < fishD AND accUpCnt >= erBars AND accInt >= erMinInt THEN
earlyBullC = 1
ENDIF
IF kHighRec >= erLevel AND fishK > fishD AND accDnCnt >= erBars AND accInt >= erMinInt THEN
earlyBearC = 1
ENDIF
ENDIF
earlyBullS = 0
earlyBearS = 0
IF barindex >= warmBars THEN
IF earlyBullC = 1 AND earlyBullC[1] = 0 THEN
earlyBullS = 1
ENDIF
IF earlyBearC = 1 AND earlyBearC[1] = 0 THEN
earlyBearS = 1
ENDIF
ENDIF
// Pre-signals feed the BUY+ / SELL+ confluence (bars since the last one)
ONCE lastPreBu = 0 - 100000
ONCE lastPreBe = 0 - 100000
IF earlyBullS = 1 OR exhShortS = 1 THEN
lastPreBu = barindex
ENDIF
IF earlyBearS = 1 OR exhLongS = 1 THEN
lastPreBe = barindex
ENDIF
// ===================== BUY / SELL (FISHER / TRIGGER CROSS) =====================
crossUp = 0
crossDn = 0
IF kOk = 1 AND barindex > kStart THEN
IF fishK > fishD AND kPrev <= dPrev THEN
crossUp = 1
ENDIF
IF fishK < fishD AND kPrev >= dPrev THEN
crossDn = 1
ENDIF
ENDIF
buyRaw = 0
sellRaw = 0
IF crossUp = 1 AND (crossFilter = 1 OR fishD <= 0 - obInner) AND htfOkBuy = 1 THEN
buyRaw = 1
ENDIF
IF crossDn = 1 AND (crossFilter = 1 OR fishD >= obInner) AND htfOkSell = 1 THEN
sellRaw = 1
ENDIF
ONCE lastBuyB = 0 - 100000
ONCE lastSellB = 0 - 100000
buySig = 0
sellSig = 0
IF buyRaw = 1 AND barindex - lastBuyB > sigCooldown THEN
buySig = 1
lastBuyB = barindex
ENDIF
IF sellRaw = 1 AND barindex - lastSellB > sigCooldown THEN
sellSig = 1
lastSellB = barindex
ENDIF
buyConf = 0
sellConf = 0
IF confMark = 1 AND buySig = 1 AND barindex - lastPreBu <= confWindow THEN
buyConf = 1
ENDIF
IF confMark = 1 AND sellSig = 1 AND barindex - lastPreBe <= confWindow THEN
sellConf = 1
ENDIF
// Last signal, for the dashboard: 1 BUY, 2 BUY+, -1 SELL, -2 SELL+
ONCE lastSig = 0
ONCE lastSigB = 0 - 1
IF buySig = 1 THEN
lastSig = 1 + buyConf
lastSigB = barindex
ENDIF
IF sellSig = 1 THEN
lastSig = 0 - 1 - sellConf
lastSigB = barindex
ENDIF
// Zone entries and zero line crosses (alerts)
enterOB = 0
enterOS = 0
zeroUp = 0
zeroDn = 0
IF kOk = 1 AND barindex > kStart THEN
IF fishK > obInner AND kPrev <= obInner THEN
enterOB = 1
ENDIF
IF fishK < 0 - obInner AND kPrev >= 0 - obInner THEN
enterOS = 1
ENDIF
IF fishK > 0 AND kPrev <= 0 THEN
zeroUp = 1
ENDIF
IF fishK < 0 AND kPrev >= 0 THEN
zeroDn = 1
ENDIF
ENDIF
// ===================== DIVERGENCE =====================
// Pivots of the Fisher with lbL bars on the left and lbR on the right: strict against the bars after
// the pivot and >= against the bars before it, so on a flat top the most recent bar is the pivot. The price is read
// from the high / low of the pivot bar. The previous pivot of each side is stored only AFTER it has
// been compared with the current one
pR = max(1, round(lbR))
pL = max(1, round(lbL))
kAft = highest[pR](fishK)
kAftL = lowest[pR](fishK)
kBef = highest[pL](fishK)
kBefL = lowest[pL](fishK)
curK = fishK[pR]
curPL = low[pR]
curPH = high[pR]
curB = barindex - pR
pivHi = 0
pivLo = 0
IF barindex >= kStart + pR + pL THEN
IF curK > kAft AND curK >= kBef[pR + 1] THEN
pivHi = 1
ENDIF
IF curK < kAftL AND curK <= kBefL[pR + 1] THEN
pivLo = 1
ENDIF
ENDIF
condHigh = 0
condLow = 0
IF pivHi = 1 AND (onlyZones = 0 OR curK >= obInner) THEN
condHigh = 1
ENDIF
IF pivLo = 1 AND (onlyZones = 0 OR curK <= 0 - obInner) THEN
condLow = 1
ENDIF
validData = 0
IF barindex >= warmBars + pL + pR THEN
validData = 1
ENDIF
ONCE prvLoB = 0 - 1
ONCE prvHiB = 0 - 1
ONCE prvLoK = 0
ONCE prvLoP = 0
ONCE prvHiK = 0
ONCE prvHiP = 0
regBull = 0
hidBull = 0
regBear = 0
hidBear = 0
dvBuX1 = 0
dvBuY1 = 0
dvBeX1 = 0
dvBeY1 = 0
IF condLow = 1 THEN
IF prvLoB >= 0 AND curB - prvLoB >= rangeLower AND curB - prvLoB <= rangeUpper AND validData = 1 THEN
IF showRegular = 1 AND curK - prvLoK >= minFishDiff AND curK > prvLoK AND curPL < prvLoP THEN
regBull = 1
ENDIF
IF showHidden = 1 AND prvLoK - curK >= minFishDiff AND curK < prvLoK AND curPL > prvLoP THEN
hidBull = 1
ENDIF
ENDIF
dvBuX1 = prvLoB
dvBuY1 = prvLoK
prvLoK = curK
prvLoP = curPL
prvLoB = curB
ENDIF
IF condHigh = 1 THEN
IF prvHiB >= 0 AND curB - prvHiB >= rangeLower AND curB - prvHiB <= rangeUpper AND validData = 1 THEN
IF showRegular = 1 AND prvHiK - curK >= minFishDiff AND curK < prvHiK AND curPH > prvHiP THEN
regBear = 1
ENDIF
IF showHidden = 1 AND curK - prvHiK >= minFishDiff AND curK > prvHiK AND curPH < prvHiP THEN
hidBear = 1
ENDIF
ENDIF
dvBeX1 = prvHiB
dvBeY1 = prvHiK
prvHiK = curK
prvHiP = curPH
prvHiB = curB
ENDIF
// Last divergence, for the dashboard: 1 regular bull, 2 hidden bull, -1 regular bear, -2 hidden bear
ONCE lastDiv = 0
ONCE lastDivB = 0 - 1
IF regBull = 1 THEN
lastDiv = 1
lastDivB = curB
ENDIF
IF hidBull = 1 THEN
lastDiv = 2
lastDivB = curB
ENDIF
IF regBear = 1 THEN
lastDiv = 0 - 1
lastDivB = curB
ENDIF
IF hidBear = 1 THEN
lastDiv = 0 - 2
lastDivB = curB
ENDIF
// ===================== DASHBOARD =====================
IF islastbarupdate AND kOk = 1 THEN
// States of each row
vZone = 0
IF fishK >= obInner THEN
vZone = 1
ELSIF fishK <= 0 - obInner THEN
vZone = 2
ENDIF
IF showExh = 0 THEN
vExh = 0
ELSIF exhLongC = 1 THEN
vExh = 1
ELSIF exhShortC = 1 THEN
vExh = 2
ELSE
vExh = 3
ENDIF
IF showEarly = 0 THEN
vEr = 0
ELSIF earlyBullC = 1 THEN
vEr = 1
ELSIF earlyBearC = 1 THEN
vEr = 2
ELSE
vEr = 3
ENDIF
IF useHtf = 0 THEN
vHtf = 0
ELSIF htfValid = 0 THEN
vHtf = 1
ELSIF htfBull = 1 THEN
vHtf = 2
ELSIF htfBear = 1 THEN
vHtf = 3
ELSE
vHtf = 4
ENDIF
// Last signal and last divergence of the CLOSED bars
vSig = lastSig[1]
ageS = barindex - lastSigB[1]
vDiv = lastDiv[1]
ageD = barindex - lastDivB[1]
kR = round(fishK * 100) / 100
mR = round(momV * 1000) / 1000
// Text geometry: a monospaced font, so every character is chW pixels wide
pz = 11
chW = pz * 0.62
rowH = pz + 8
padX = 8
padY = 4
// Characters each number takes on screen: sign, integer digits, decimals and the space
// ProRealTime prints after an interpolated number
$nv[0] = kR
$nv[1] = mR
$nv[2] = ageS
$nv[3] = ageD
$nd[0] = 2
$nd[1] = 3
$nd[2] = 0
$nd[3] = 0
FOR q = 0 TO 3 DO
vq = abs($nv[q])
dq = 1
WHILE vq >= 10 DO
vq = vq / 10
dq = dq + 1
WEND
lq = dq + 1
IF $nv[q] < 0 THEN
lq = lq + 1
ENDIF
IF $nd[q] > 0 THEN
lq = lq + 1 + $nd[q]
ENDIF
$nl[q] = lq
NEXT
IF fishK >= fishD THEN
len1 = $nl[0] + 3
ELSE
len1 = $nl[0] + 5
ENDIF
IF vZone = 1 THEN
len2 = 10
ELSIF vZone = 2 THEN
len2 = 8
ELSE
len2 = 7
ENDIF
len3 = $nl[1]
len4 = 6
IF vExh = 0 THEN
len5 = 3
ELSIF vExh = 1 THEN
len5 = 15
ELSIF vExh = 2 THEN
len5 = 16
ELSE
len5 = 4
ENDIF
IF vEr = 0 THEN
len6 = 3
ELSIF vEr = 3 THEN
len6 = 4
ELSE
len6 = 15
ENDIF
IF vHtf = 0 THEN
len7 = 3
ELSIF vHtf = 1 THEN
len7 = 18
ELSE
len7 = 7
ENDIF
IF vSig = 1 THEN
len8 = 14 + $nl[2]
ELSIF vSig = 2 OR vSig = 0 - 1 THEN
len8 = 15 + $nl[2]
ELSIF vSig = 0 - 2 THEN
len8 = 16 + $nl[2]
ELSE
len8 = 4
ENDIF
IF vDiv = 1 OR vDiv = 0 - 1 THEN
len9 = 23 + $nl[3]
ELSIF vDiv = 2 OR vDiv = 0 - 2 THEN
len9 = 22 + $nl[3]
ELSE
len9 = 4
ENDIF
maxL = max(max(max(len1, len2), max(len3, len4)), max(max(len5, len6), max(max(len7, len8), len9)))
pW = 15 * chW + 3 * chW + maxL * chW + 2 * padX
pH = 10 * rowH + 2 * padY
// The dashboard sits in its corner, clear of the price scale on the right and, on the left, of the
// panel's legend (top) and of the platform's mark (bottom)
IF dashPos = 1 THEN
pL = 10
pT = 0 - 40
ELSIF dashPos = 3 THEN
pL = 10
pT = 40 + pH
ELSIF dashPos = 4 THEN
pL = 0 - 85 - pW
pT = 12 + pH
ELSE
pL = 0 - 85 - pW
pT = 0 - 12
ENDIF
// Names aligned left, values aligned right
yR0 = pT - padY - rowH * 0.5
yR1 = pT - padY - rowH * 1.5
yR2 = pT - padY - rowH * 2.5
yR3 = pT - padY - rowH * 3.5
yR4 = pT - padY - rowH * 4.5
yR5 = pT - padY - rowH * 5.5
yR6 = pT - padY - rowH * 6.5
yR7 = pT - padY - rowH * 7.5
yR8 = pT - padY - rowH * 8.5
yR9 = pT - padY - rowH * 9.5
xV1 = pL + pW - padX - len1 * chW / 2
xV2 = pL + pW - padX - len2 * chW / 2
xV3 = pL + pW - padX - len3 * chW / 2
xV4 = pL + pW - padX - len4 * chW / 2
xV5 = pL + pW - padX - len5 * chW / 2
xV6 = pL + pW - padX - len6 * chW / 2
xV7 = pL + pW - padX - len7 * chW / 2
xV8 = pL + pW - padX - len8 * chW / 2
xV9 = pL + pW - padX - len9 * chW / 2
IF dashPos = 1 THEN
DRAWRECTANGLE(pL, pT, pL + pW, pT - pH) ANCHOR(TOPLEFT, XSHIFT, YSHIFT) COLOURED(120, 123, 134, 128) FILLCOLOR(120, 123, 134, 38)
DRAWTEXT("FishStoc", pL + pW / 2, yR0, monospaced, bold, pz) ANCHOR(TOPLEFT, XSHIFT, YSHIFT) COLOURED(0, 0, 0, 255)
DRAWTEXT("Fisher", pL + padX + 3 * chW, yR1, monospaced, bold, pz) ANCHOR(TOPLEFT, XSHIFT, YSHIFT) COLOURED(0, 0, 0, 255)
IF fishK >= fishD THEN
DRAWTEXT("#kR# Up", xV1, yR1, monospaced, bold, pz) ANCHOR(TOPLEFT, XSHIFT, YSHIFT) COLOURED(bsR, bsG, bsB, 255)
ELSE
DRAWTEXT("#kR# Down", xV1, yR1, monospaced, bold, pz) ANCHOR(TOPLEFT, XSHIFT, YSHIFT) COLOURED(rsR, rsG, rsB, 255)
ENDIF
DRAWTEXT("Zone", pL + padX + 2 * chW, yR2, monospaced, bold, pz) ANCHOR(TOPLEFT, XSHIFT, YSHIFT) COLOURED(0, 0, 0, 255)
IF vZone = 1 THEN
DRAWTEXT("Overbought", xV2, yR2, monospaced, bold, pz) ANCHOR(TOPLEFT, XSHIFT, YSHIFT) COLOURED(rsR, rsG, rsB, 255)
ELSIF vZone = 2 THEN
DRAWTEXT("Oversold", xV2, yR2, monospaced, bold, pz) ANCHOR(TOPLEFT, XSHIFT, YSHIFT) COLOURED(bsR, bsG, bsB, 255)
ELSE
DRAWTEXT("Neutral", xV2, yR2, monospaced, bold, pz) ANCHOR(TOPLEFT, XSHIFT, YSHIFT) COLOURED(120, 123, 134, 255)
ENDIF
DRAWTEXT("Momentum", pL + padX + 4 * chW, yR3, monospaced, bold, pz) ANCHOR(TOPLEFT, XSHIFT, YSHIFT) COLOURED(0, 0, 0, 255)
IF momV >= 0 THEN
DRAWTEXT("#mR#", xV3, yR3, monospaced, bold, pz) ANCHOR(TOPLEFT, XSHIFT, YSHIFT) COLOURED(bsR, bsG, bsB, 255)
ELSE
DRAWTEXT("#mR#", xV3, yR3, monospaced, bold, pz) ANCHOR(TOPLEFT, XSHIFT, YSHIFT) COLOURED(rsR, rsG, rsB, 255)
ENDIF
DRAWTEXT("Acceleration", pL + padX + 6 * chW, yR4, monospaced, bold, pz) ANCHOR(TOPLEFT, XSHIFT, YSHIFT) COLOURED(0, 0, 0, 255)
IF accV >= 0 THEN
DRAWTEXT("Rising", xV4, yR4, monospaced, bold, pz) ANCHOR(TOPLEFT, XSHIFT, YSHIFT) COLOURED(255, 152, 0, 255)
ELSE
DRAWTEXT("Fading", xV4, yR4, monospaced, bold, pz) ANCHOR(TOPLEFT, XSHIFT, YSHIFT) COLOURED(8, 153, 129, 255)
ENDIF
DRAWTEXT("Exhaustion", pL + padX + 5 * chW, yR5, monospaced, bold, pz) ANCHOR(TOPLEFT, XSHIFT, YSHIFT) COLOURED(0, 0, 0, 255)
IF vExh = 0 THEN
DRAWTEXT("Off", xV5, yR5, monospaced, bold, pz) ANCHOR(TOPLEFT, XSHIFT, YSHIFT) COLOURED(120, 123, 134, 255)
ELSIF vExh = 1 THEN
DRAWTEXT("Long exhaustion", xV5, yR5, monospaced, bold, pz) ANCHOR(TOPLEFT, XSHIFT, YSHIFT) COLOURED(255, 64, 129, 255)
ELSIF vExh = 2 THEN
DRAWTEXT("Short exhaustion", xV5, yR5, monospaced, bold, pz) ANCHOR(TOPLEFT, XSHIFT, YSHIFT) COLOURED(0, 200, 83, 255)
ELSE
DRAWTEXT("None", xV5, yR5, monospaced, bold, pz) ANCHOR(TOPLEFT, XSHIFT, YSHIFT) COLOURED(120, 123, 134, 255)
ENDIF
DRAWTEXT("Early Reversal", pL + padX + 7 * chW, yR6, monospaced, bold, pz) ANCHOR(TOPLEFT, XSHIFT, YSHIFT) COLOURED(0, 0, 0, 255)
IF vEr = 0 THEN
DRAWTEXT("Off", xV6, yR6, monospaced, bold, pz) ANCHOR(TOPLEFT, XSHIFT, YSHIFT) COLOURED(120, 123, 134, 255)
ELSIF vEr = 1 THEN
DRAWTEXT("Bullish (early)", xV6, yR6, monospaced, bold, pz) ANCHOR(TOPLEFT, XSHIFT, YSHIFT) COLOURED(255, 171, 0, 255)
ELSIF vEr = 2 THEN
DRAWTEXT("Bearish (early)", xV6, yR6, monospaced, bold, pz) ANCHOR(TOPLEFT, XSHIFT, YSHIFT) COLOURED(179, 136, 255, 255)
ELSE
DRAWTEXT("None", xV6, yR6, monospaced, bold, pz) ANCHOR(TOPLEFT, XSHIFT, YSHIFT) COLOURED(120, 123, 134, 255)
ENDIF
DRAWTEXT("HTF Bias", pL + padX + 4 * chW, yR7, monospaced, bold, pz) ANCHOR(TOPLEFT, XSHIFT, YSHIFT) COLOURED(0, 0, 0, 255)
IF vHtf = 0 THEN
DRAWTEXT("Off", xV7, yR7, monospaced, bold, pz) ANCHOR(TOPLEFT, XSHIFT, YSHIFT) COLOURED(120, 123, 134, 255)
ELSIF vHtf = 1 THEN
DRAWTEXT("n/a (HTF <= chart)", xV7, yR7, monospaced, bold, pz) ANCHOR(TOPLEFT, XSHIFT, YSHIFT) COLOURED(120, 123, 134, 255)
ELSIF vHtf = 2 THEN
DRAWTEXT("Bullish", xV7, yR7, monospaced, bold, pz) ANCHOR(TOPLEFT, XSHIFT, YSHIFT) COLOURED(bsR, bsG, bsB, 255)
ELSIF vHtf = 3 THEN
DRAWTEXT("Bearish", xV7, yR7, monospaced, bold, pz) ANCHOR(TOPLEFT, XSHIFT, YSHIFT) COLOURED(rsR, rsG, rsB, 255)
ELSE
DRAWTEXT("Neutral", xV7, yR7, monospaced, bold, pz) ANCHOR(TOPLEFT, XSHIFT, YSHIFT) COLOURED(120, 123, 134, 255)
ENDIF
DRAWTEXT("Last Signal", pL + padX + 5.5 * chW, yR8, monospaced, bold, pz) ANCHOR(TOPLEFT, XSHIFT, YSHIFT) COLOURED(0, 0, 0, 255)
IF vSig = 1 THEN
DRAWTEXT("BUY (#ageS#bars ago)", xV8, yR8, monospaced, bold, pz) ANCHOR(TOPLEFT, XSHIFT, YSHIFT) COLOURED(bsR, bsG, bsB, 255)
ELSIF vSig = 2 THEN
DRAWTEXT("BUY+ (#ageS#bars ago)", xV8, yR8, monospaced, bold, pz) ANCHOR(TOPLEFT, XSHIFT, YSHIFT) COLOURED(bsR, bsG, bsB, 255)
ELSIF vSig = 0 - 1 THEN
DRAWTEXT("SELL (#ageS#bars ago)", xV8, yR8, monospaced, bold, pz) ANCHOR(TOPLEFT, XSHIFT, YSHIFT) COLOURED(rsR, rsG, rsB, 255)
ELSIF vSig = 0 - 2 THEN
DRAWTEXT("SELL+ (#ageS#bars ago)", xV8, yR8, monospaced, bold, pz) ANCHOR(TOPLEFT, XSHIFT, YSHIFT) COLOURED(rsR, rsG, rsB, 255)
ELSE
DRAWTEXT("None", xV8, yR8, monospaced, bold, pz) ANCHOR(TOPLEFT, XSHIFT, YSHIFT) COLOURED(120, 123, 134, 255)
ENDIF
DRAWTEXT("Last Divergence", pL + padX + 7.5 * chW, yR9, monospaced, bold, pz) ANCHOR(TOPLEFT, XSHIFT, YSHIFT) COLOURED(0, 0, 0, 255)
IF vDiv = 1 THEN
DRAWTEXT("Regular Bull (#ageD#bars ago)", xV9, yR9, monospaced, bold, pz) ANCHOR(TOPLEFT, XSHIFT, YSHIFT) COLOURED(0, 0, 0, 255)
ELSIF vDiv = 2 THEN
DRAWTEXT("Hidden Bull (#ageD#bars ago)", xV9, yR9, monospaced, bold, pz) ANCHOR(TOPLEFT, XSHIFT, YSHIFT) COLOURED(0, 0, 0, 255)
ELSIF vDiv = 0 - 1 THEN
DRAWTEXT("Regular Bear (#ageD#bars ago)", xV9, yR9, monospaced, bold, pz) ANCHOR(TOPLEFT, XSHIFT, YSHIFT) COLOURED(0, 0, 0, 255)
ELSIF vDiv = 0 - 2 THEN
DRAWTEXT("Hidden Bear (#ageD#bars ago)", xV9, yR9, monospaced, bold, pz) ANCHOR(TOPLEFT, XSHIFT, YSHIFT) COLOURED(0, 0, 0, 255)
ELSE
DRAWTEXT("None", xV9, yR9, monospaced, bold, pz) ANCHOR(TOPLEFT, XSHIFT, YSHIFT) COLOURED(0, 0, 0, 255)
ENDIF
ENDIF
IF dashPos = 2 THEN
DRAWRECTANGLE(pL, pT, pL + pW, pT - pH) ANCHOR(TOPRIGHT, XSHIFT, YSHIFT) COLOURED(120, 123, 134, 128) FILLCOLOR(120, 123, 134, 38)
DRAWTEXT("FishStoc", pL + pW / 2, yR0, monospaced, bold, pz) ANCHOR(TOPRIGHT, XSHIFT, YSHIFT) COLOURED(0, 0, 0, 255)
DRAWTEXT("Fisher", pL + padX + 3 * chW, yR1, monospaced, bold, pz) ANCHOR(TOPRIGHT, XSHIFT, YSHIFT) COLOURED(0, 0, 0, 255)
IF fishK >= fishD THEN
DRAWTEXT("#kR# Up", xV1, yR1, monospaced, bold, pz) ANCHOR(TOPRIGHT, XSHIFT, YSHIFT) COLOURED(bsR, bsG, bsB, 255)
ELSE
DRAWTEXT("#kR# Down", xV1, yR1, monospaced, bold, pz) ANCHOR(TOPRIGHT, XSHIFT, YSHIFT) COLOURED(rsR, rsG, rsB, 255)
ENDIF
DRAWTEXT("Zone", pL + padX + 2 * chW, yR2, monospaced, bold, pz) ANCHOR(TOPRIGHT, XSHIFT, YSHIFT) COLOURED(0, 0, 0, 255)
IF vZone = 1 THEN
DRAWTEXT("Overbought", xV2, yR2, monospaced, bold, pz) ANCHOR(TOPRIGHT, XSHIFT, YSHIFT) COLOURED(rsR, rsG, rsB, 255)
ELSIF vZone = 2 THEN
DRAWTEXT("Oversold", xV2, yR2, monospaced, bold, pz) ANCHOR(TOPRIGHT, XSHIFT, YSHIFT) COLOURED(bsR, bsG, bsB, 255)
ELSE
DRAWTEXT("Neutral", xV2, yR2, monospaced, bold, pz) ANCHOR(TOPRIGHT, XSHIFT, YSHIFT) COLOURED(120, 123, 134, 255)
ENDIF
DRAWTEXT("Momentum", pL + padX + 4 * chW, yR3, monospaced, bold, pz) ANCHOR(TOPRIGHT, XSHIFT, YSHIFT) COLOURED(0, 0, 0, 255)
IF momV >= 0 THEN
DRAWTEXT("#mR#", xV3, yR3, monospaced, bold, pz) ANCHOR(TOPRIGHT, XSHIFT, YSHIFT) COLOURED(bsR, bsG, bsB, 255)
ELSE
DRAWTEXT("#mR#", xV3, yR3, monospaced, bold, pz) ANCHOR(TOPRIGHT, XSHIFT, YSHIFT) COLOURED(rsR, rsG, rsB, 255)
ENDIF
DRAWTEXT("Acceleration", pL + padX + 6 * chW, yR4, monospaced, bold, pz) ANCHOR(TOPRIGHT, XSHIFT, YSHIFT) COLOURED(0, 0, 0, 255)
IF accV >= 0 THEN
DRAWTEXT("Rising", xV4, yR4, monospaced, bold, pz) ANCHOR(TOPRIGHT, XSHIFT, YSHIFT) COLOURED(255, 152, 0, 255)
ELSE
DRAWTEXT("Fading", xV4, yR4, monospaced, bold, pz) ANCHOR(TOPRIGHT, XSHIFT, YSHIFT) COLOURED(8, 153, 129, 255)
ENDIF
DRAWTEXT("Exhaustion", pL + padX + 5 * chW, yR5, monospaced, bold, pz) ANCHOR(TOPRIGHT, XSHIFT, YSHIFT) COLOURED(0, 0, 0, 255)
IF vExh = 0 THEN
DRAWTEXT("Off", xV5, yR5, monospaced, bold, pz) ANCHOR(TOPRIGHT, XSHIFT, YSHIFT) COLOURED(120, 123, 134, 255)
ELSIF vExh = 1 THEN
DRAWTEXT("Long exhaustion", xV5, yR5, monospaced, bold, pz) ANCHOR(TOPRIGHT, XSHIFT, YSHIFT) COLOURED(255, 64, 129, 255)
ELSIF vExh = 2 THEN
DRAWTEXT("Short exhaustion", xV5, yR5, monospaced, bold, pz) ANCHOR(TOPRIGHT, XSHIFT, YSHIFT) COLOURED(0, 200, 83, 255)
ELSE
DRAWTEXT("None", xV5, yR5, monospaced, bold, pz) ANCHOR(TOPRIGHT, XSHIFT, YSHIFT) COLOURED(120, 123, 134, 255)
ENDIF
DRAWTEXT("Early Reversal", pL + padX + 7 * chW, yR6, monospaced, bold, pz) ANCHOR(TOPRIGHT, XSHIFT, YSHIFT) COLOURED(0, 0, 0, 255)
IF vEr = 0 THEN
DRAWTEXT("Off", xV6, yR6, monospaced, bold, pz) ANCHOR(TOPRIGHT, XSHIFT, YSHIFT) COLOURED(120, 123, 134, 255)
ELSIF vEr = 1 THEN
DRAWTEXT("Bullish (early)", xV6, yR6, monospaced, bold, pz) ANCHOR(TOPRIGHT, XSHIFT, YSHIFT) COLOURED(255, 171, 0, 255)
ELSIF vEr = 2 THEN
DRAWTEXT("Bearish (early)", xV6, yR6, monospaced, bold, pz) ANCHOR(TOPRIGHT, XSHIFT, YSHIFT) COLOURED(179, 136, 255, 255)
ELSE
DRAWTEXT("None", xV6, yR6, monospaced, bold, pz) ANCHOR(TOPRIGHT, XSHIFT, YSHIFT) COLOURED(120, 123, 134, 255)
ENDIF
DRAWTEXT("HTF Bias", pL + padX + 4 * chW, yR7, monospaced, bold, pz) ANCHOR(TOPRIGHT, XSHIFT, YSHIFT) COLOURED(0, 0, 0, 255)
IF vHtf = 0 THEN
DRAWTEXT("Off", xV7, yR7, monospaced, bold, pz) ANCHOR(TOPRIGHT, XSHIFT, YSHIFT) COLOURED(120, 123, 134, 255)
ELSIF vHtf = 1 THEN
DRAWTEXT("n/a (HTF <= chart)", xV7, yR7, monospaced, bold, pz) ANCHOR(TOPRIGHT, XSHIFT, YSHIFT) COLOURED(120, 123, 134, 255)
ELSIF vHtf = 2 THEN
DRAWTEXT("Bullish", xV7, yR7, monospaced, bold, pz) ANCHOR(TOPRIGHT, XSHIFT, YSHIFT) COLOURED(bsR, bsG, bsB, 255)
ELSIF vHtf = 3 THEN
DRAWTEXT("Bearish", xV7, yR7, monospaced, bold, pz) ANCHOR(TOPRIGHT, XSHIFT, YSHIFT) COLOURED(rsR, rsG, rsB, 255)
ELSE
DRAWTEXT("Neutral", xV7, yR7, monospaced, bold, pz) ANCHOR(TOPRIGHT, XSHIFT, YSHIFT) COLOURED(120, 123, 134, 255)
ENDIF
DRAWTEXT("Last Signal", pL + padX + 5.5 * chW, yR8, monospaced, bold, pz) ANCHOR(TOPRIGHT, XSHIFT, YSHIFT) COLOURED(0, 0, 0, 255)
IF vSig = 1 THEN
DRAWTEXT("BUY (#ageS#bars ago)", xV8, yR8, monospaced, bold, pz) ANCHOR(TOPRIGHT, XSHIFT, YSHIFT) COLOURED(bsR, bsG, bsB, 255)
ELSIF vSig = 2 THEN
DRAWTEXT("BUY+ (#ageS#bars ago)", xV8, yR8, monospaced, bold, pz) ANCHOR(TOPRIGHT, XSHIFT, YSHIFT) COLOURED(bsR, bsG, bsB, 255)
ELSIF vSig = 0 - 1 THEN
DRAWTEXT("SELL (#ageS#bars ago)", xV8, yR8, monospaced, bold, pz) ANCHOR(TOPRIGHT, XSHIFT, YSHIFT) COLOURED(rsR, rsG, rsB, 255)
ELSIF vSig = 0 - 2 THEN
DRAWTEXT("SELL+ (#ageS#bars ago)", xV8, yR8, monospaced, bold, pz) ANCHOR(TOPRIGHT, XSHIFT, YSHIFT) COLOURED(rsR, rsG, rsB, 255)
ELSE
DRAWTEXT("None", xV8, yR8, monospaced, bold, pz) ANCHOR(TOPRIGHT, XSHIFT, YSHIFT) COLOURED(120, 123, 134, 255)
ENDIF
DRAWTEXT("Last Divergence", pL + padX + 7.5 * chW, yR9, monospaced, bold, pz) ANCHOR(TOPRIGHT, XSHIFT, YSHIFT) COLOURED(0, 0, 0, 255)
IF vDiv = 1 THEN
DRAWTEXT("Regular Bull (#ageD#bars ago)", xV9, yR9, monospaced, bold, pz) ANCHOR(TOPRIGHT, XSHIFT, YSHIFT) COLOURED(0, 0, 0, 255)
ELSIF vDiv = 2 THEN
DRAWTEXT("Hidden Bull (#ageD#bars ago)", xV9, yR9, monospaced, bold, pz) ANCHOR(TOPRIGHT, XSHIFT, YSHIFT) COLOURED(0, 0, 0, 255)
ELSIF vDiv = 0 - 1 THEN
DRAWTEXT("Regular Bear (#ageD#bars ago)", xV9, yR9, monospaced, bold, pz) ANCHOR(TOPRIGHT, XSHIFT, YSHIFT) COLOURED(0, 0, 0, 255)
ELSIF vDiv = 0 - 2 THEN
DRAWTEXT("Hidden Bear (#ageD#bars ago)", xV9, yR9, monospaced, bold, pz) ANCHOR(TOPRIGHT, XSHIFT, YSHIFT) COLOURED(0, 0, 0, 255)
ELSE
DRAWTEXT("None", xV9, yR9, monospaced, bold, pz) ANCHOR(TOPRIGHT, XSHIFT, YSHIFT) COLOURED(0, 0, 0, 255)
ENDIF
ENDIF
IF dashPos = 3 THEN
DRAWRECTANGLE(pL, pT, pL + pW, pT - pH) ANCHOR(BOTTOMLEFT, XSHIFT, YSHIFT) COLOURED(120, 123, 134, 128) FILLCOLOR(120, 123, 134, 38)
DRAWTEXT("FishStoc", pL + pW / 2, yR0, monospaced, bold, pz) ANCHOR(BOTTOMLEFT, XSHIFT, YSHIFT) COLOURED(0, 0, 0, 255)
DRAWTEXT("Fisher", pL + padX + 3 * chW, yR1, monospaced, bold, pz) ANCHOR(BOTTOMLEFT, XSHIFT, YSHIFT) COLOURED(0, 0, 0, 255)
IF fishK >= fishD THEN
DRAWTEXT("#kR# Up", xV1, yR1, monospaced, bold, pz) ANCHOR(BOTTOMLEFT, XSHIFT, YSHIFT) COLOURED(bsR, bsG, bsB, 255)
ELSE
DRAWTEXT("#kR# Down", xV1, yR1, monospaced, bold, pz) ANCHOR(BOTTOMLEFT, XSHIFT, YSHIFT) COLOURED(rsR, rsG, rsB, 255)
ENDIF
DRAWTEXT("Zone", pL + padX + 2 * chW, yR2, monospaced, bold, pz) ANCHOR(BOTTOMLEFT, XSHIFT, YSHIFT) COLOURED(0, 0, 0, 255)
IF vZone = 1 THEN
DRAWTEXT("Overbought", xV2, yR2, monospaced, bold, pz) ANCHOR(BOTTOMLEFT, XSHIFT, YSHIFT) COLOURED(rsR, rsG, rsB, 255)
ELSIF vZone = 2 THEN
DRAWTEXT("Oversold", xV2, yR2, monospaced, bold, pz) ANCHOR(BOTTOMLEFT, XSHIFT, YSHIFT) COLOURED(bsR, bsG, bsB, 255)
ELSE
DRAWTEXT("Neutral", xV2, yR2, monospaced, bold, pz) ANCHOR(BOTTOMLEFT, XSHIFT, YSHIFT) COLOURED(120, 123, 134, 255)
ENDIF
DRAWTEXT("Momentum", pL + padX + 4 * chW, yR3, monospaced, bold, pz) ANCHOR(BOTTOMLEFT, XSHIFT, YSHIFT) COLOURED(0, 0, 0, 255)
IF momV >= 0 THEN
DRAWTEXT("#mR#", xV3, yR3, monospaced, bold, pz) ANCHOR(BOTTOMLEFT, XSHIFT, YSHIFT) COLOURED(bsR, bsG, bsB, 255)
ELSE
DRAWTEXT("#mR#", xV3, yR3, monospaced, bold, pz) ANCHOR(BOTTOMLEFT, XSHIFT, YSHIFT) COLOURED(rsR, rsG, rsB, 255)
ENDIF
DRAWTEXT("Acceleration", pL + padX + 6 * chW, yR4, monospaced, bold, pz) ANCHOR(BOTTOMLEFT, XSHIFT, YSHIFT) COLOURED(0, 0, 0, 255)
IF accV >= 0 THEN
DRAWTEXT("Rising", xV4, yR4, monospaced, bold, pz) ANCHOR(BOTTOMLEFT, XSHIFT, YSHIFT) COLOURED(255, 152, 0, 255)
ELSE
DRAWTEXT("Fading", xV4, yR4, monospaced, bold, pz) ANCHOR(BOTTOMLEFT, XSHIFT, YSHIFT) COLOURED(8, 153, 129, 255)
ENDIF
DRAWTEXT("Exhaustion", pL + padX + 5 * chW, yR5, monospaced, bold, pz) ANCHOR(BOTTOMLEFT, XSHIFT, YSHIFT) COLOURED(0, 0, 0, 255)
IF vExh = 0 THEN
DRAWTEXT("Off", xV5, yR5, monospaced, bold, pz) ANCHOR(BOTTOMLEFT, XSHIFT, YSHIFT) COLOURED(120, 123, 134, 255)
ELSIF vExh = 1 THEN
DRAWTEXT("Long exhaustion", xV5, yR5, monospaced, bold, pz) ANCHOR(BOTTOMLEFT, XSHIFT, YSHIFT) COLOURED(255, 64, 129, 255)
ELSIF vExh = 2 THEN
DRAWTEXT("Short exhaustion", xV5, yR5, monospaced, bold, pz) ANCHOR(BOTTOMLEFT, XSHIFT, YSHIFT) COLOURED(0, 200, 83, 255)
ELSE
DRAWTEXT("None", xV5, yR5, monospaced, bold, pz) ANCHOR(BOTTOMLEFT, XSHIFT, YSHIFT) COLOURED(120, 123, 134, 255)
ENDIF
DRAWTEXT("Early Reversal", pL + padX + 7 * chW, yR6, monospaced, bold, pz) ANCHOR(BOTTOMLEFT, XSHIFT, YSHIFT) COLOURED(0, 0, 0, 255)
IF vEr = 0 THEN
DRAWTEXT("Off", xV6, yR6, monospaced, bold, pz) ANCHOR(BOTTOMLEFT, XSHIFT, YSHIFT) COLOURED(120, 123, 134, 255)
ELSIF vEr = 1 THEN
DRAWTEXT("Bullish (early)", xV6, yR6, monospaced, bold, pz) ANCHOR(BOTTOMLEFT, XSHIFT, YSHIFT) COLOURED(255, 171, 0, 255)
ELSIF vEr = 2 THEN
DRAWTEXT("Bearish (early)", xV6, yR6, monospaced, bold, pz) ANCHOR(BOTTOMLEFT, XSHIFT, YSHIFT) COLOURED(179, 136, 255, 255)
ELSE
DRAWTEXT("None", xV6, yR6, monospaced, bold, pz) ANCHOR(BOTTOMLEFT, XSHIFT, YSHIFT) COLOURED(120, 123, 134, 255)
ENDIF
DRAWTEXT("HTF Bias", pL + padX + 4 * chW, yR7, monospaced, bold, pz) ANCHOR(BOTTOMLEFT, XSHIFT, YSHIFT) COLOURED(0, 0, 0, 255)
IF vHtf = 0 THEN
DRAWTEXT("Off", xV7, yR7, monospaced, bold, pz) ANCHOR(BOTTOMLEFT, XSHIFT, YSHIFT) COLOURED(120, 123, 134, 255)
ELSIF vHtf = 1 THEN
DRAWTEXT("n/a (HTF <= chart)", xV7, yR7, monospaced, bold, pz) ANCHOR(BOTTOMLEFT, XSHIFT, YSHIFT) COLOURED(120, 123, 134, 255)
ELSIF vHtf = 2 THEN
DRAWTEXT("Bullish", xV7, yR7, monospaced, bold, pz) ANCHOR(BOTTOMLEFT, XSHIFT, YSHIFT) COLOURED(bsR, bsG, bsB, 255)
ELSIF vHtf = 3 THEN
DRAWTEXT("Bearish", xV7, yR7, monospaced, bold, pz) ANCHOR(BOTTOMLEFT, XSHIFT, YSHIFT) COLOURED(rsR, rsG, rsB, 255)
ELSE
DRAWTEXT("Neutral", xV7, yR7, monospaced, bold, pz) ANCHOR(BOTTOMLEFT, XSHIFT, YSHIFT) COLOURED(120, 123, 134, 255)
ENDIF
DRAWTEXT("Last Signal", pL + padX + 5.5 * chW, yR8, monospaced, bold, pz) ANCHOR(BOTTOMLEFT, XSHIFT, YSHIFT) COLOURED(0, 0, 0, 255)
IF vSig = 1 THEN
DRAWTEXT("BUY (#ageS#bars ago)", xV8, yR8, monospaced, bold, pz) ANCHOR(BOTTOMLEFT, XSHIFT, YSHIFT) COLOURED(bsR, bsG, bsB, 255)
ELSIF vSig = 2 THEN
DRAWTEXT("BUY+ (#ageS#bars ago)", xV8, yR8, monospaced, bold, pz) ANCHOR(BOTTOMLEFT, XSHIFT, YSHIFT) COLOURED(bsR, bsG, bsB, 255)
ELSIF vSig = 0 - 1 THEN
DRAWTEXT("SELL (#ageS#bars ago)", xV8, yR8, monospaced, bold, pz) ANCHOR(BOTTOMLEFT, XSHIFT, YSHIFT) COLOURED(rsR, rsG, rsB, 255)
ELSIF vSig = 0 - 2 THEN
DRAWTEXT("SELL+ (#ageS#bars ago)", xV8, yR8, monospaced, bold, pz) ANCHOR(BOTTOMLEFT, XSHIFT, YSHIFT) COLOURED(rsR, rsG, rsB, 255)
ELSE
DRAWTEXT("None", xV8, yR8, monospaced, bold, pz) ANCHOR(BOTTOMLEFT, XSHIFT, YSHIFT) COLOURED(120, 123, 134, 255)
ENDIF
DRAWTEXT("Last Divergence", pL + padX + 7.5 * chW, yR9, monospaced, bold, pz) ANCHOR(BOTTOMLEFT, XSHIFT, YSHIFT) COLOURED(0, 0, 0, 255)
IF vDiv = 1 THEN
DRAWTEXT("Regular Bull (#ageD#bars ago)", xV9, yR9, monospaced, bold, pz) ANCHOR(BOTTOMLEFT, XSHIFT, YSHIFT) COLOURED(0, 0, 0, 255)
ELSIF vDiv = 2 THEN
DRAWTEXT("Hidden Bull (#ageD#bars ago)", xV9, yR9, monospaced, bold, pz) ANCHOR(BOTTOMLEFT, XSHIFT, YSHIFT) COLOURED(0, 0, 0, 255)
ELSIF vDiv = 0 - 1 THEN
DRAWTEXT("Regular Bear (#ageD#bars ago)", xV9, yR9, monospaced, bold, pz) ANCHOR(BOTTOMLEFT, XSHIFT, YSHIFT) COLOURED(0, 0, 0, 255)
ELSIF vDiv = 0 - 2 THEN
DRAWTEXT("Hidden Bear (#ageD#bars ago)", xV9, yR9, monospaced, bold, pz) ANCHOR(BOTTOMLEFT, XSHIFT, YSHIFT) COLOURED(0, 0, 0, 255)
ELSE
DRAWTEXT("None", xV9, yR9, monospaced, bold, pz) ANCHOR(BOTTOMLEFT, XSHIFT, YSHIFT) COLOURED(0, 0, 0, 255)
ENDIF
ENDIF
IF dashPos = 4 THEN
DRAWRECTANGLE(pL, pT, pL + pW, pT - pH) ANCHOR(BOTTOMRIGHT, XSHIFT, YSHIFT) COLOURED(120, 123, 134, 128) FILLCOLOR(120, 123, 134, 38)
DRAWTEXT("FishStoc", pL + pW / 2, yR0, monospaced, bold, pz) ANCHOR(BOTTOMRIGHT, XSHIFT, YSHIFT) COLOURED(0, 0, 0, 255)
DRAWTEXT("Fisher", pL + padX + 3 * chW, yR1, monospaced, bold, pz) ANCHOR(BOTTOMRIGHT, XSHIFT, YSHIFT) COLOURED(0, 0, 0, 255)
IF fishK >= fishD THEN
DRAWTEXT("#kR# Up", xV1, yR1, monospaced, bold, pz) ANCHOR(BOTTOMRIGHT, XSHIFT, YSHIFT) COLOURED(bsR, bsG, bsB, 255)
ELSE
DRAWTEXT("#kR# Down", xV1, yR1, monospaced, bold, pz) ANCHOR(BOTTOMRIGHT, XSHIFT, YSHIFT) COLOURED(rsR, rsG, rsB, 255)
ENDIF
DRAWTEXT("Zone", pL + padX + 2 * chW, yR2, monospaced, bold, pz) ANCHOR(BOTTOMRIGHT, XSHIFT, YSHIFT) COLOURED(0, 0, 0, 255)
IF vZone = 1 THEN
DRAWTEXT("Overbought", xV2, yR2, monospaced, bold, pz) ANCHOR(BOTTOMRIGHT, XSHIFT, YSHIFT) COLOURED(rsR, rsG, rsB, 255)
ELSIF vZone = 2 THEN
DRAWTEXT("Oversold", xV2, yR2, monospaced, bold, pz) ANCHOR(BOTTOMRIGHT, XSHIFT, YSHIFT) COLOURED(bsR, bsG, bsB, 255)
ELSE
DRAWTEXT("Neutral", xV2, yR2, monospaced, bold, pz) ANCHOR(BOTTOMRIGHT, XSHIFT, YSHIFT) COLOURED(120, 123, 134, 255)
ENDIF
DRAWTEXT("Momentum", pL + padX + 4 * chW, yR3, monospaced, bold, pz) ANCHOR(BOTTOMRIGHT, XSHIFT, YSHIFT) COLOURED(0, 0, 0, 255)
IF momV >= 0 THEN
DRAWTEXT("#mR#", xV3, yR3, monospaced, bold, pz) ANCHOR(BOTTOMRIGHT, XSHIFT, YSHIFT) COLOURED(bsR, bsG, bsB, 255)
ELSE
DRAWTEXT("#mR#", xV3, yR3, monospaced, bold, pz) ANCHOR(BOTTOMRIGHT, XSHIFT, YSHIFT) COLOURED(rsR, rsG, rsB, 255)
ENDIF
DRAWTEXT("Acceleration", pL + padX + 6 * chW, yR4, monospaced, bold, pz) ANCHOR(BOTTOMRIGHT, XSHIFT, YSHIFT) COLOURED(0, 0, 0, 255)
IF accV >= 0 THEN
DRAWTEXT("Rising", xV4, yR4, monospaced, bold, pz) ANCHOR(BOTTOMRIGHT, XSHIFT, YSHIFT) COLOURED(255, 152, 0, 255)
ELSE
DRAWTEXT("Fading", xV4, yR4, monospaced, bold, pz) ANCHOR(BOTTOMRIGHT, XSHIFT, YSHIFT) COLOURED(8, 153, 129, 255)
ENDIF
DRAWTEXT("Exhaustion", pL + padX + 5 * chW, yR5, monospaced, bold, pz) ANCHOR(BOTTOMRIGHT, XSHIFT, YSHIFT) COLOURED(0, 0, 0, 255)
IF vExh = 0 THEN
DRAWTEXT("Off", xV5, yR5, monospaced, bold, pz) ANCHOR(BOTTOMRIGHT, XSHIFT, YSHIFT) COLOURED(120, 123, 134, 255)
ELSIF vExh = 1 THEN
DRAWTEXT("Long exhaustion", xV5, yR5, monospaced, bold, pz) ANCHOR(BOTTOMRIGHT, XSHIFT, YSHIFT) COLOURED(255, 64, 129, 255)
ELSIF vExh = 2 THEN
DRAWTEXT("Short exhaustion", xV5, yR5, monospaced, bold, pz) ANCHOR(BOTTOMRIGHT, XSHIFT, YSHIFT) COLOURED(0, 200, 83, 255)
ELSE
DRAWTEXT("None", xV5, yR5, monospaced, bold, pz) ANCHOR(BOTTOMRIGHT, XSHIFT, YSHIFT) COLOURED(120, 123, 134, 255)
ENDIF
DRAWTEXT("Early Reversal", pL + padX + 7 * chW, yR6, monospaced, bold, pz) ANCHOR(BOTTOMRIGHT, XSHIFT, YSHIFT) COLOURED(0, 0, 0, 255)
IF vEr = 0 THEN
DRAWTEXT("Off", xV6, yR6, monospaced, bold, pz) ANCHOR(BOTTOMRIGHT, XSHIFT, YSHIFT) COLOURED(120, 123, 134, 255)
ELSIF vEr = 1 THEN
DRAWTEXT("Bullish (early)", xV6, yR6, monospaced, bold, pz) ANCHOR(BOTTOMRIGHT, XSHIFT, YSHIFT) COLOURED(255, 171, 0, 255)
ELSIF vEr = 2 THEN
DRAWTEXT("Bearish (early)", xV6, yR6, monospaced, bold, pz) ANCHOR(BOTTOMRIGHT, XSHIFT, YSHIFT) COLOURED(179, 136, 255, 255)
ELSE
DRAWTEXT("None", xV6, yR6, monospaced, bold, pz) ANCHOR(BOTTOMRIGHT, XSHIFT, YSHIFT) COLOURED(120, 123, 134, 255)
ENDIF
DRAWTEXT("HTF Bias", pL + padX + 4 * chW, yR7, monospaced, bold, pz) ANCHOR(BOTTOMRIGHT, XSHIFT, YSHIFT) COLOURED(0, 0, 0, 255)
IF vHtf = 0 THEN
DRAWTEXT("Off", xV7, yR7, monospaced, bold, pz) ANCHOR(BOTTOMRIGHT, XSHIFT, YSHIFT) COLOURED(120, 123, 134, 255)
ELSIF vHtf = 1 THEN
DRAWTEXT("n/a (HTF <= chart)", xV7, yR7, monospaced, bold, pz) ANCHOR(BOTTOMRIGHT, XSHIFT, YSHIFT) COLOURED(120, 123, 134, 255)
ELSIF vHtf = 2 THEN
DRAWTEXT("Bullish", xV7, yR7, monospaced, bold, pz) ANCHOR(BOTTOMRIGHT, XSHIFT, YSHIFT) COLOURED(bsR, bsG, bsB, 255)
ELSIF vHtf = 3 THEN
DRAWTEXT("Bearish", xV7, yR7, monospaced, bold, pz) ANCHOR(BOTTOMRIGHT, XSHIFT, YSHIFT) COLOURED(rsR, rsG, rsB, 255)
ELSE
DRAWTEXT("Neutral", xV7, yR7, monospaced, bold, pz) ANCHOR(BOTTOMRIGHT, XSHIFT, YSHIFT) COLOURED(120, 123, 134, 255)
ENDIF
DRAWTEXT("Last Signal", pL + padX + 5.5 * chW, yR8, monospaced, bold, pz) ANCHOR(BOTTOMRIGHT, XSHIFT, YSHIFT) COLOURED(0, 0, 0, 255)
IF vSig = 1 THEN
DRAWTEXT("BUY (#ageS#bars ago)", xV8, yR8, monospaced, bold, pz) ANCHOR(BOTTOMRIGHT, XSHIFT, YSHIFT) COLOURED(bsR, bsG, bsB, 255)
ELSIF vSig = 2 THEN
DRAWTEXT("BUY+ (#ageS#bars ago)", xV8, yR8, monospaced, bold, pz) ANCHOR(BOTTOMRIGHT, XSHIFT, YSHIFT) COLOURED(bsR, bsG, bsB, 255)
ELSIF vSig = 0 - 1 THEN
DRAWTEXT("SELL (#ageS#bars ago)", xV8, yR8, monospaced, bold, pz) ANCHOR(BOTTOMRIGHT, XSHIFT, YSHIFT) COLOURED(rsR, rsG, rsB, 255)
ELSIF vSig = 0 - 2 THEN
DRAWTEXT("SELL+ (#ageS#bars ago)", xV8, yR8, monospaced, bold, pz) ANCHOR(BOTTOMRIGHT, XSHIFT, YSHIFT) COLOURED(rsR, rsG, rsB, 255)
ELSE
DRAWTEXT("None", xV8, yR8, monospaced, bold, pz) ANCHOR(BOTTOMRIGHT, XSHIFT, YSHIFT) COLOURED(120, 123, 134, 255)
ENDIF
DRAWTEXT("Last Divergence", pL + padX + 7.5 * chW, yR9, monospaced, bold, pz) ANCHOR(BOTTOMRIGHT, XSHIFT, YSHIFT) COLOURED(0, 0, 0, 255)
IF vDiv = 1 THEN
DRAWTEXT("Regular Bull (#ageD#bars ago)", xV9, yR9, monospaced, bold, pz) ANCHOR(BOTTOMRIGHT, XSHIFT, YSHIFT) COLOURED(0, 0, 0, 255)
ELSIF vDiv = 2 THEN
DRAWTEXT("Hidden Bull (#ageD#bars ago)", xV9, yR9, monospaced, bold, pz) ANCHOR(BOTTOMRIGHT, XSHIFT, YSHIFT) COLOURED(0, 0, 0, 255)
ELSIF vDiv = 0 - 1 THEN
DRAWTEXT("Regular Bear (#ageD#bars ago)", xV9, yR9, monospaced, bold, pz) ANCHOR(BOTTOMRIGHT, XSHIFT, YSHIFT) COLOURED(0, 0, 0, 255)
ELSIF vDiv = 0 - 2 THEN
DRAWTEXT("Hidden Bear (#ageD#bars ago)", xV9, yR9, monospaced, bold, pz) ANCHOR(BOTTOMRIGHT, XSHIFT, YSHIFT) COLOURED(0, 0, 0, 255)
ELSE
DRAWTEXT("None", xV9, yR9, monospaced, bold, pz) ANCHOR(BOTTOMRIGHT, XSHIFT, YSHIFT) COLOURED(0, 0, 0, 255)
ENDIF
ENDIF
ENDIF
RETURN fishK COLOURED(0, 0, 0, 0) AS "Fisher"