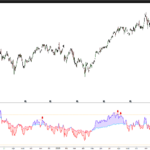
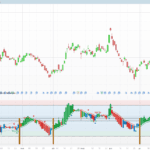
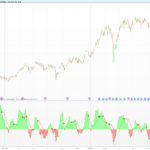
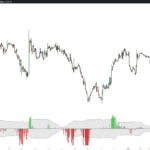
Adaptive Momentum Fusion
1. Introduction
The classic MACD subtracts one exponential average from another. Both averages have a fixed speed, decided once when you set the lengths, and they keep that speed whether the market is trending cleanly or chopping sideways.
The Adaptive Momentum Fusion, by WillyAlgoTrader, keeps the MACD structure but removes that assumption. Its two averages recompute their smoothing constant on every bar, according to what the market is doing right now: faster when price moves with purpose, slower when it does not.
The calculation chain is short and each step feeds the next:
fast adaptive average (8) ─┐
                           ├─> oscillator ─> signal line ─> histogram ─> divergences
slow adaptive average (21) ─┘
It runs in its own panel and works on any instrument and timeframe.
2. The Theory: One Formula, a Moving Alpha
Every exponential average is the same one-line recursion:
ma = alpha * price + (1 - alpha) * ma[1]
alpha is the whole story. A large alpha puts most of the weight on the current price and the average glues itself to it. A small alpha barely lets the new price in, and the average crawls. In a standard EMA, alpha = 2/(length+1) and never changes again.
This indicator recomputes alpha bar by bar. Everything else – the subtraction of two averages, the signal line, the histogram – is ordinary MACD machinery. So the interesting question is not what it plots, it is how it decides alpha, and that is what the six engines are for.
One consequence worth understanding before you read further: because the fast and the slow average both adapt, the distance between them no longer depends only on the two lengths you chose. In a strong trend both averages speed up, but the fast one speeds up from a shorter measuring window, so the spread widens more violently than in a fixed MACD. In a range both slow down and the oscillator flattens towards zero instead of oscillating around it. That is the behaviour the indicator is built to produce.
3. The Six Adaptation Engines
Each engine measures a different dimension of market behaviour and converts it into alpha. Only one is active at a time, chosen with the engineMode setting.
- Engine 1 – Efficiency. Kaufman’s efficiency ratio: net displacement over the period divided by the sum of every individual move inside it. A market that travels ten points in a straight line scores near 1; one that ends where it started after going up and down scores near 0. The ratio is then mapped onto Kaufman’s classic smoothing constants and squared. This is the most balanced engine and the best starting point.
- Engine 2 – Volatility. Compares the current ATR against its own average over twice the period. When volatility expands the averages accelerate to keep up with the range expansion; when it contracts they slow down. Useful where volatility regimes change sharply. Bear in mind that volatility is not direction: a market can swing violently and go nowhere.
- Engine 3 – Fractal. Estimates a fractal dimension from the range of the full window against the ranges of its two halves, and converts it into alpha with an exponential decay. Smooth, trending series get a faster average; jagged, mean-reverting ones get a slower one.
- Engine 4 – Momentum. Normalises the current rate of change against the largest absolute ROC seen over twice the period. Strong impulses raise alpha, fading ones lower it. This one suits breakout work, because it reacts quickly when an expansion starts.
- Engine 5 – Volume. Compares each bar’s volume with its recent average and scales alpha by the square root of that ratio, so participation confirms the move. On instruments without real centralised volume it falls back to a plain EMA constant, exactly as it should.
- Engine 6 – Composite. Blends the previous five with weights of 0.30, 0.20, 0.20, 0.15 and 0.15. When no volume is available the weights become 0.35, 0.25, 0.25 and 0.15 over the remaining four.
A detail that is easy to miss, and that matters if you ever modify the code: Composite does not average the five alphas, it averages the five finished adaptive averages. The indicator therefore keeps five separate recursions per length – ten in total – and blends them at the end. Averaging the alphas instead would give a different curve.
Another one, specific to Engine 1: the length only enters through the efficiency ratio. The smoothing constants themselves are Kaufman’s fixed 2 and 30. So the fast and slow averages differ only in the window used to measure efficiency, not in their base speed.
If you are unsure which engine to use, compare Efficiency and Composite first.
4. Key Features at a Glance
- Two adaptive averages with six selectable adaptation engines
- MACD mode (absolute difference) or PPO mode (percentage, comparable across instruments)
- Signal line with three selectable smoothing modes
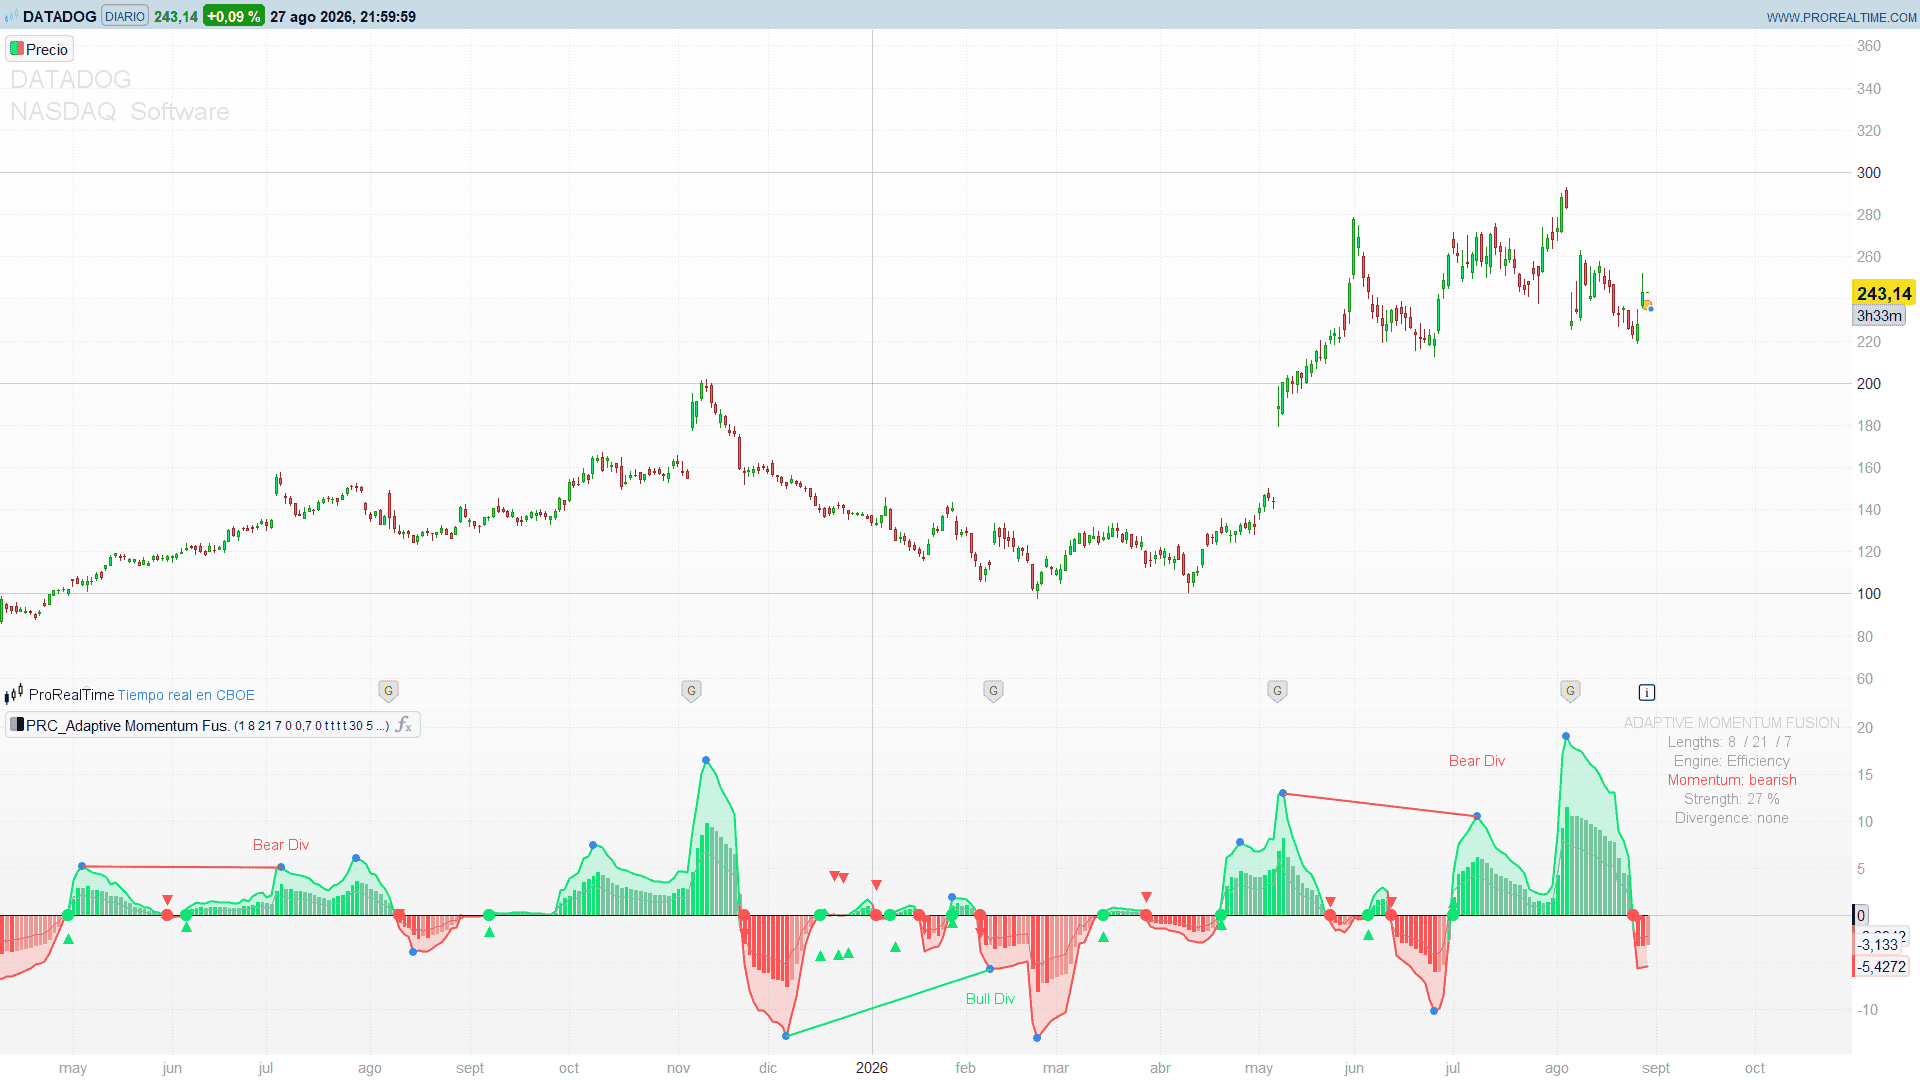
- Histogram coloured in four shades: bright when momentum accelerates, faded when it decelerates, on both sides of zero
- Shaded area between oscillator and signal line
- Arrows on the oscillator/signal crossings and dots on the zero line crossings
- Regular bullish and bearish divergences, anchored on oscillator pivots, with a cap on how far apart the two pivots may be
- Optional dot on every oscillator pivot considered, to tune the lookback by eye
- Summary panel with engine, lengths, momentum direction, relative strength and the latest divergence
5. The Signal Line and Its Three Modes
The default signal filter is a three-stage, Jurik-inspired smoother, chosen because an adaptive average changes speed constantly and produces a slightly jagged oscillator that a plain EMA smooths poorly.
That filter has a property worth knowing before you trade its crossings. Feed it a constant input and it does not settle on that input: it settles at a fraction of it, around 0.405 with the default length of 7, and lower as the length grows – about 0.32 at 12 and 0.23 at 20. The signal line therefore sits permanently between the oscillator and zero, on the same side as the oscillator.
Measured over 3,900 synthetic bars with the default 8 / 21 / 7 and the Efficiency engine, the practical effect is this:
- the signal line averages 0.407 times the oscillator on the strongest bars
- the state “oscillator above signal” agrees with the state “oscillator above zero” on 99.1% of bars
- there are 162 oscillator/signal crossings against 152 zero line crossings
In other words, with this filter the crossing signal is very close to a zero line crossing. That is not necessarily bad – a zero line crossing is a perfectly respectable trend filter, and this version gives it a slight lead – but it should be a decision, not a surprise. The sigMode setting lets you choose:
- sigMode = 0 (default): the filter described above. 162 crossings in the test, 99.1% of the time in agreement with the zero line.
- sigMode = 1: the same filter with the accumulation step that a full Jurik average uses, so the line converges properly onto the oscillator. It tracks the oscillator very closely and produces far more crossings – 613 in the same test. Consider raising
signalLenif you use it. - sigMode = 2: a plain EMA of the oscillator, the classic MACD signal line. 345 crossings in the test, agreeing with the zero line on only 50.7% of bars – the only mode that gives you a genuinely independent crossing signal.
6. How to Read the Indicator
The oscillator line is the difference between the two adaptive averages, so it is read like a MACD: above zero the fast average is above the slow one and momentum is bullish, below zero it is bearish.
The histogram is the distance between oscillator and signal. Its colour intensity carries the second layer of information: a bright bar means the histogram grew against the previous bar – momentum accelerating – while a faded bar means it shrank. A run of faded green bars while price still rises is the classic early warning that the move is tiring.
The zero line crossings mark the moment the fast adaptive average crosses the slow one. With the default signal mode these arrive slightly after the oscillator/signal crossing, which is why the two sets of markers so often appear together.
Divergences are drawn only for regular divergences: price makes a lower low while the oscillator makes a higher low, or price makes a higher high while the oscillator makes a lower high.
The pivot is looked for on the oscillator alone – 30 bars to its left and 5 to its right by default – and the low or high of price is then read from a window of divPw bars on each side of that pivot, rather than from the pivot bar itself. That second detail is what makes the feature usable. Measured over ten liquid US stocks and 571 oscillator pivots, the extreme of price falls on the exact bar of the oscillator pivot only 18 % of the time; within one bar of it, 44 %; within three bars, 67 %. An oscillator turns before or after price far more often than it turns with it, so an implementation that asks for a price pivot and an oscillator pivot on the same bar filters out almost everything – and the few pairs that survive end up hundreds of bars apart, joined by segments that span whole market regimes.
divMaxGap caps that distance explicitly. Two swing lows four hundred bars apart belong to two different regimes, not to one divergence. With the defaults, the median divergence on a daily chart spans forty to sixty bars.
showPivots puts a dot on every oscillator pivot the detector considered, which is the quickest way to tune divLb: if you can count the dots of a six-year chart on one hand, the lookback is too wide. With divLb = 30 you get roughly one and a half divergences per year on daily bars, with 15 a little over two.
7. Practical Applications and Two Cautions
The adaptive behaviour pays off most on instruments that alternate clearly between trending and ranging phases. In a clean trend the oscillator pulls away from zero faster than a fixed MACD would; in a range it collapses towards zero instead of producing the small oscillations that generate most MACD whipsaws. That makes it a reasonable trend filter on a higher timeframe and an entry trigger on a lower one.
Two things to keep in mind.
Engine 3 is scale-dependent. The fractal estimate divides two logarithms of quantities expressed in price units, so its value moves with the price level of the instrument, not only with the shape of the curve. On the same simulated series scaled three ways, the average alpha came out at 0.0375 with prices around 100, 0.0147 with prices around 5,000, and pinned at the 0.01 floor on 100% of bars with prices around 1. On currency pairs quoting near 1.0 the engine therefore stops adapting altogether and behaves like a very slow fixed average. Use Engine 3 on shares and instruments quoting in the tens or hundreds, and pick another engine on forex.
Use PPO to compare instruments. In MACD mode the oscillator is expressed in the instrument’s own price units, so its values are meaningless across markets. Set outMode = 1 and it becomes a percentage.
8. Indicator Configuration
Main settings:
- srcAmf (default: customclose): price source, selectable from the settings panel
- engineMode (default: 1): 1 Efficiency, 2 Volatility, 3 Fractal, 4 Momentum, 5 Volume, 6 Composite
- fastLen (default: 8): fast adaptive average length. Recommended 5 to 15
- slowLen (default: 21): slow adaptive average length. Recommended 2 to 4 times the fast length
- signalLen (default: 7): signal line length. Recommended 5 to 12
- outMode (default: 0): 0 for MACD, 1 for PPO
- jitter (default: 0.7): phase of the signal smoothing, 0 to 1
- sigMode (default: 0): 0 default filter, 1 accumulated Jurik, 2 classic EMA
Display and filters:
- showHisto (default: 1): draw the histogram
- showSignals (default: 1): arrows on oscillator/signal crossings
- useZeroCross (default: 1): dots on zero line crossings
- useDiv (default: 1): detect regular divergences
- divLb (default: 30): bars to the left of an oscillator pivot
- divRb (default: 5): bars to the right of an oscillator pivot, i.e. the confirmation delay
- divPw (default: 3): bars on each side of the pivot in which the price extreme is searched. 0 reads price on the pivot bar itself. Values above
divRb - 1are capped, so the window never needs a bar that has not closed yet - divMaxGap (default: 120): maximum distance in bars between the two pivots of a divergence
- showPivots (default: 1): dot on every oscillator pivot taken into account
- showPanel (default: 1): summary panel in the top right corner
A note on the warm-up: the adaptive averages are seeded for the first max(slowLen*2, 50) bars and start adapting after that, so give the chart enough history before reading the first signals.
9. Code
//----------------------------------------------
//PRC_Adaptive Momentum Fusion (by WillyAlgoTrader)
//version = 0
//27.07.2026
//Ivan Gonzalez @ www.prorealcode.com
//Sharing ProRealTime knowledge
//----------------------------------------------
// === MAIN SETTINGS ===
//----------------------------------------------
srcAmf     = customclose   // price source, selectable from the settings panel
engineMode = 1       // engine: 1=Efficiency 2=Volatility 3=Fractal 4=Momentum 5=Volume 6=Composite
fastLen    = 8       // fast adaptive average length
slowLen    = 21      // slow adaptive average length
signalLen  = 7       // signal line length (Jurik-style smoothing)
outMode    = 0       // 0 = MACD (absolute difference)  1 = PPO (percentage difference)
jitter     = 0.7     // jitter reduction = phase of the Jurik-style smoothing
sigMode    = 0       // signal line: 0 = default filter  1 = accumulated Jurik  2 = classic EMA
//----------------------------------------------
// === DISPLAY AND FILTERS ===
//----------------------------------------------
showHisto     = 1    // 1 = histogram (oscillator - signal)
showSignals   = 1    // 1 = arrows on oscillator/signal crossings
useZeroCross  = 1    // 1 = dots on zero line crossings
useDiv        = 1    // 1 = regular price/oscillator divergences
divLb         = 30   // bars to the left of the oscillator pivot
divRb         = 5    // bars to the right of the oscillator pivot (confirmation)
divPw         = 3    // bars on each side of the pivot where the price extreme is searched (0 = same bar)
divMaxGap     = 120  // maximum distance in bars between the two pivots of a divergence
showPivots    = 1    // 1 = dot on every oscillator pivot taken into account
showPanel     = 1    // 1 = summary panel in the top right corner
//----------------------------------------------
// === INTERNAL CONSTANTS ===
//----------------------------------------------
once hasLo     = 0
once hasHi     = 0
once prevOscLo = 0
once prevPrcLo = 0
once prevLoBar = 0
once prevOscHi = 0
once prevPrcHi = 0
once prevHiBar = 0
once divState  = 0
once divBar    = 0


warmBars = max(slowLen * 2, 50)
len2F    = fastLen * 2
len2S    = slowLen * 2
hlfF     = max(2, floor(fastLen / 2))
hlfS     = max(2, floor(slowLen / 2))
baseAF   = 2 / (fastLen + 1)
baseAS   = 2 / (slowLen + 1)
rbp1     = divRb + 1
absChg   = abs(srcAmf - srcAmf[1])
// price window centred on the oscillator pivot, capped at divRb - 1 so that
// its right edge never needs a future bar
divPwUse  = max(0, min(divPw, divRb - 1))
prcWinSz  = 2 * divPwUse + 1
prcWinOff = divRb - divPwUse
//----------------------------------------------
// === ENGINE 1 - EFFICIENCY RATIO (Kaufman) ===
// alpha = (ER*(2/3 - 2/31) + 2/31)^2
//----------------------------------------------
dirF    = abs(srcAmf - srcAmf[fastLen])
sumMovF = summation[fastLen](absChg)
if sumMovF > 0 then
   erF = dirF / sumMovF
else
   erF = 0.5
endif
scF   = erF * (0.66666667 - 0.06451613) + 0.06451613
aEffF = min(max(scF * scF, 0.01), 1)


dirS    = abs(srcAmf - srcAmf[slowLen])
sumMovS = summation[slowLen](absChg)
if sumMovS > 0 then
   erS = dirS / sumMovS
else
   erS = 0.5
endif
scS   = erS * (0.66666667 - 0.06451613) + 0.06451613
aEffS = min(max(scS * scS, 0.01), 1)
//----------------------------------------------
// === ENGINE 2 - VOLATILITY (ATR against its own average) ===
//----------------------------------------------
if barindex < fastLen then
   atrValF = high - low
else
   atrValF = averagetruerange[fastLen](close)
endif
atrAvgF = average[len2F](atrValF)
if atrAvgF > 0 then
   ratVolF = atrValF / atrAvgF
else
   ratVolF = 1
endif
aVolF = min(max(baseAF * ratVolF, 0.01), 1)


if barindex < slowLen then
   atrValS = high - low
else
   atrValS = averagetruerange[slowLen](close)
endif
atrAvgS = average[len2S](atrValS)
if atrAvgS > 0 then
   ratVolS = atrValS / atrAvgS
else
   ratVolS = 1
endif
aVolS = min(max(baseAS * ratVolS, 0.01), 1)
//----------------------------------------------
// === ENGINE 3 - FRACTAL (Hurst-style dimension) ===
//----------------------------------------------
rngFullF = highest[fastLen](srcAmf) - lowest[fastLen](srcAmf)
rngAF    = highest[hlfF](srcAmf) - lowest[hlfF](srcAmf)
rngBF    = highest[hlfF](srcAmf)[hlfF] - lowest[hlfF](srcAmf)[hlfF]
sumHF    = rngAF + rngBF
if rngFullF > 0 and sumHF > 0 then
   denFrF = log(2 * rngFullF)
   if denFrF <> 0 then
      fdF = 1 + log(sumHF) / denFrF
   else
      fdF = 1.5
   endif
else
   fdF = 1.5
endif
aFraF = min(max(exp((0 - 4.6) * (fdF - 1)), 0.01), 1)


rngFullS = highest[slowLen](srcAmf) - lowest[slowLen](srcAmf)
rngAS    = highest[hlfS](srcAmf) - lowest[hlfS](srcAmf)
rngBS    = highest[hlfS](srcAmf)[hlfS] - lowest[hlfS](srcAmf)[hlfS]
sumHS    = rngAS + rngBS
if rngFullS > 0 and sumHS > 0 then
   denFrS = log(2 * rngFullS)
   if denFrS <> 0 then
      fdS = 1 + log(sumHS) / denFrS
   else
      fdS = 1.5
   endif
else
   fdS = 1.5
endif
aFraS = min(max(exp((0 - 4.6) * (fdS - 1)), 0.01), 1)
//----------------------------------------------
// === ENGINE 4 - MOMENTUM (normalised ROC) ===
//----------------------------------------------
if srcAmf[fastLen] <> 0 then
   rocF = (srcAmf - srcAmf[fastLen]) / srcAmf[fastLen] * 100
else
   rocF = 0
endif
rocAbsF = abs(rocF)
rocMaxF = highest[len2F](rocAbsF)
if rocMaxF > 0 then
   nrmF = min(rocAbsF / rocMaxF, 1)
else
   nrmF = 0.5
endif
aMomF = min(max(baseAF + nrmF * (1 - baseAF) * 0.5, 0.01), 1)


if srcAmf[slowLen] <> 0 then
   rocS = (srcAmf - srcAmf[slowLen]) / srcAmf[slowLen] * 100
else
   rocS = 0
endif
rocAbsS = abs(rocS)
rocMaxS = highest[len2S](rocAbsS)
if rocMaxS > 0 then
   nrmS = min(rocAbsS / rocMaxS, 1)
else
   nrmS = 0.5
endif
aMomS = min(max(baseAS + nrmS * (1 - baseAS) * 0.5, 0.01), 1)
//----------------------------------------------
// === ENGINE 5 - VOLUME (relative participation) ===
//----------------------------------------------
volAvgF = average[fastLen](volume)
if volume > 0 and volAvgF > 0 then
   ratVlmF = volume / volAvgF
else
   ratVlmF = 1
endif
aVlmF = min(max(baseAF * sqrt(max(ratVlmF, 0.01)), 0.01), 1)


volAvgS = average[slowLen](volume)
if volume > 0 and volAvgS > 0 then
   ratVlmS = volume / volAvgS
else
   ratVlmS = 1
endif
aVlmS = min(max(baseAS * sqrt(max(ratVlmS, 0.01)), 0.01), 1)
//----------------------------------------------
// === ADAPTIVE AVERAGES: ma = alpha*src + (1-alpha)*ma[1] ===
// Seeding during the warm-up is mandatory: a recursion that
// receives undefined once stays broken for the whole history
//----------------------------------------------
if barindex <= warmBars then
   emaEffF = srcAmf
   emaVolF = srcAmf
   emaFraF = srcAmf
   emaMomF = srcAmf
   emaVlmF = srcAmf
   emaEffS = srcAmf
   emaVolS = srcAmf
   emaFraS = srcAmf
   emaMomS = srcAmf
   emaVlmS = srcAmf
else
   emaEffF = aEffF * srcAmf + (1 - aEffF) * emaEffF[1]
   emaVolF = aVolF * srcAmf + (1 - aVolF) * emaVolF[1]
   emaFraF = aFraF * srcAmf + (1 - aFraF) * emaFraF[1]
   emaMomF = aMomF * srcAmf + (1 - aMomF) * emaMomF[1]
   emaVlmF = aVlmF * srcAmf + (1 - aVlmF) * emaVlmF[1]
   emaEffS = aEffS * srcAmf + (1 - aEffS) * emaEffS[1]
   emaVolS = aVolS * srcAmf + (1 - aVolS) * emaVolS[1]
   emaFraS = aFraS * srcAmf + (1 - aFraS) * emaFraS[1]
   emaMomS = aMomS * srcAmf + (1 - aMomS) * emaMomS[1]
   emaVlmS = aVlmS * srcAmf + (1 - aVlmS) * emaVlmS[1]
endif
//----------------------------------------------
// === ENGINE SELECTION ===
//----------------------------------------------
if engineMode = 1 then
   fastMA = emaEffF
   slowMA = emaEffS
elsif engineMode = 2 then
   fastMA = emaVolF
   slowMA = emaVolS
elsif engineMode = 3 then
   fastMA = emaFraF
   slowMA = emaFraS
elsif engineMode = 4 then
   fastMA = emaMomF
   slowMA = emaMomS
elsif engineMode = 5 then
   fastMA = emaVlmF
   slowMA = emaVlmS
else
   if volume > 0 then
      fastMA = emaEffF * 0.30 + emaVolF * 0.20 + emaFraF * 0.20 + emaMomF * 0.15 + emaVlmF * 0.15
      slowMA = emaEffS * 0.30 + emaVolS * 0.20 + emaFraS * 0.20 + emaMomS * 0.15 + emaVlmS * 0.15
   else
      fastMA = emaEffF * 0.35 + emaVolF * 0.25 + emaFraF * 0.25 + emaMomF * 0.15
      slowMA = emaEffS * 0.35 + emaVolS * 0.25 + emaFraS * 0.25 + emaMomS * 0.15
   endif
endif
//----------------------------------------------
// === OSCILLATOR ===
//----------------------------------------------
if outMode = 1 and slowMA <> 0 then
   osc = (fastMA - slowMA) / slowMA * 100
else
   osc = fastMA - slowMA
endif
//----------------------------------------------
// === SIGNAL LINE - JURIK-STYLE SMOOTHING ===
//----------------------------------------------
betaJ = 0.45 * (signalLen - 1) / (0.45 * (signalLen - 1) + 2)
alfaJ = betaJ * betaJ * betaJ
om1   = (1 - alfaJ) * (1 - alfaJ)
al2   = alfaJ * alfaJ
if barindex <= warmBars then
   e0j     = 0
   e1j     = 0
   e2j     = 0
   jmaOut  = 0
   sigLine = 0
else
   e0j = (1 - alfaJ) * osc + alfaJ * e0j[1]
   e1j = (osc - e0j) * (1 - betaJ) + betaJ * e1j[1]
   if sigMode = 1 then
      e2j     = (e0j + jitter * e1j - jmaOut[1]) * om1 + al2 * e2j[1]
      jmaOut  = jmaOut[1] + e2j
      sigLine = jmaOut
   elsif sigMode = 2 then
      e2j     = 0
      jmaOut  = 0
      sigLine = average[signalLen, 1](osc)
   else
      e2j     = (e0j + jitter * e1j - e2j[1]) * om1 + al2 * e2j[1]
      jmaOut  = e2j
      sigLine = e2j
   endif
endif
//----------------------------------------------
// === HISTOGRAM AND STATE ===
//----------------------------------------------
histVal = osc - sigLine
absOsc  = abs(osc)
absHist = abs(histVal)
scaleAmf = average[50](absOsc)
maxHist  = highest[50](absHist)
if maxHist > 0 then
   strScore = min(absHist / maxHist * 100, 100)
else
   strScore = 50
endif
strRound = round(strScore)
sigWarm  = barindex > warmBars + 2
//----------------------------------------------
// === COLOURS ===
//----------------------------------------------
if histVal > 0 and histVal > histVal[1] then
   rh = 0
   gh = 230
   bh = 118
elsif histVal > 0 then
   rh = 120
   gh = 200
   bh = 160
elsif histVal < 0 and histVal < histVal[1] then
   rh = 255
   gh = 82
   bh = 82
elsif histVal < 0 then
   rh = 235
   gh = 150
   bh = 150
else
   rh = 150
   gh = 150
   bh = 150
endif


if osc > sigLine then
   rc = 0
   gc = 230
   bc = 118
   rs = 90
   gs = 170
   bs = 130
else
   rc = 255
   gc = 82
   bc = 82
   rs = 190
   gs = 110
   bs = 110
endif
colorbetween(osc, sigLine, rc, gc, bc, 45)
//----------------------------------------------
// === CROSSING SIGNALS ===
//----------------------------------------------
bullCross = osc crosses over sigLine
bearCross = osc crosses under sigLine
zeroBull  = osc crosses over 0
zeroBear  = osc crosses under 0


if showSignals = 1 and sigWarm and bullCross then
   drawtext("▲", barindex, osc - 0.6 * scaleAmf) coloured(0, 230, 118)
endif
if showSignals = 1 and sigWarm and bearCross then
   drawtext("▼", barindex, osc + 0.6 * scaleAmf) coloured(255, 82, 82)
endif
if useZeroCross = 1 and sigWarm and zeroBull then
   drawpoint(barindex, 0, 3) coloured(0, 230, 118)
endif
if useZeroCross = 1 and sigWarm and zeroBear then
   drawpoint(barindex, 0, 3) coloured(255, 82, 82)
endif
//----------------------------------------------
// === REGULAR DIVERGENCES ===
// The pivot is searched on the OSCILLATOR only. Once it is confirmed, the
// price extreme is read from a window of divPw bars on EACH side of that
// pivot: the low or high of the swing almost never lands on the exact bar
// of the oscillator pivot (measured: only 18 % of the time), and requiring
// both pivots on the same bar leaves three or four points per decade,
// joined by segments hundreds of bars long.
//----------------------------------------------
if useDiv = 1 and sigWarm then
   oscPivLoOk = osc[divRb] < lowest[divRb](osc) and osc[divRb] < lowest[divLb](osc)[rbp1]
   oscPivHiOk = osc[divRb] > highest[divRb](osc) and osc[divRb] > highest[divLb](osc)[rbp1]
   prcLoWin   = lowest[prcWinSz](low)[prcWinOff]
   prcHiWin   = highest[prcWinSz](high)[prcWinOff]


   if oscPivLoOk then
      if showPivots = 1 then
         drawpoint(barindex - divRb, osc[divRb], 2) coloured(60, 130, 246)
      endif
      gapLo = barindex - divRb - prevLoBar
      if hasLo = 1 and gapLo <= divMaxGap and prcLoWin < prevPrcLo and osc[divRb] > prevOscLo then
         drawsegment(prevLoBar, prevOscLo, barindex - divRb, osc[divRb]) coloured(0, 230, 118) style(line, 2)
         drawtext("Bull Div", barindex - divRb, osc[divRb] - 1.1 * scaleAmf) coloured(0, 230, 118)
         divState = 1
         divBar = barindex
      endif
      prevOscLo = osc[divRb]
      prevPrcLo = prcLoWin
      prevLoBar = barindex - divRb
      hasLo = 1
   endif


   if oscPivHiOk then
      if showPivots = 1 then
         drawpoint(barindex - divRb, osc[divRb], 2) coloured(60, 130, 246)
      endif
      gapHi = barindex - divRb - prevHiBar
      if hasHi = 1 and gapHi <= divMaxGap and prcHiWin > prevPrcHi and osc[divRb] < prevOscHi then
         drawsegment(prevHiBar, prevOscHi, barindex - divRb, osc[divRb]) coloured(255, 82, 82) style(line, 2)
         drawtext("Bear Div", barindex - divRb, osc[divRb] + 1.1 * scaleAmf) coloured(255, 82, 82)
         divState = 0 - 1
         divBar = barindex
      endif
      prevOscHi = osc[divRb]
      prevPrcHi = prcHiWin
      prevHiBar = barindex - divRb
      hasHi = 1
   endif
endif
if barindex > divBar + 20 then
   divState = 0
endif
//----------------------------------------------
// === SUMMARY PANEL ===
//----------------------------------------------
if showPanel = 1 and islastbarupdate then
   drawtext("ADAPTIVE MOMENTUM FUSION", -185, -15) anchor(topright) coloured(200, 200, 200)
   drawtext("Lengths: #fastLen# / #slowLen# / #signalLen#", -185, -34) anchor(topright) coloured(160, 160, 160)
   if engineMode = 1 then
      drawtext("Engine: Efficiency", -185, -53) anchor(topright) coloured(160, 160, 160)
   elsif engineMode = 2 then
      drawtext("Engine: Volatility", -185, -53) anchor(topright) coloured(160, 160, 160)
   elsif engineMode = 3 then
      drawtext("Engine: Fractal", -185, -53) anchor(topright) coloured(160, 160, 160)
   elsif engineMode = 4 then
      drawtext("Engine: Momentum", -185, -53) anchor(topright) coloured(160, 160, 160)
   elsif engineMode = 5 then
      drawtext("Engine: Volume", -185, -53) anchor(topright) coloured(160, 160, 160)
   else
      drawtext("Engine: Composite", -185, -53) anchor(topright) coloured(160, 160, 160)
   endif
   if osc > sigLine then
      drawtext("Momentum: bullish", -185, -72) anchor(topright) coloured(0, 230, 118)
   else
      drawtext("Momentum: bearish", -185, -72) anchor(topright) coloured(255, 82, 82)
   endif
   drawtext("Strength: #strRound#%", -185, -91) anchor(topright) coloured(160, 160, 160)
   if divState = 1 then
      drawtext("Divergence: bullish", -185, -110) anchor(topright) coloured(0, 230, 118)
   elsif divState = 0 - 1 then
      drawtext("Divergence: bearish", -185, -110) anchor(topright) coloured(255, 82, 82)
   else
      drawtext("Divergence: none", -185, -110) anchor(topright) coloured(160, 160, 160)
   endif
endif
//----------------------------------------------
// === OUTPUT ===
//----------------------------------------------
if showHisto = 1 then
   histPlot = histVal
else
   histPlot = undefined
endif


return histPlot coloured(rh, gh, bh) style(histogram) as "AMF Histogram", osc coloured(rc, gc, bc) style(line, 2) as "AMF", sigLine coloured(rs, gs, bs) style(line, 1) as "Signal", 0 as "Zero"