RSI Divergence Pro+ Volume
Introduction
Divergence indicators usually work the same way: find a pivot in the oscillator, find the pivot before it, compare both against the price at those bars, and draw a line. It works, it is the textbook definition, and it has a cost — the pivot is only confirmed several bars after it happened, so the signal always arrives late.
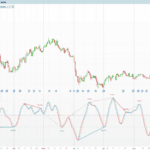
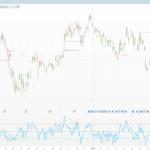
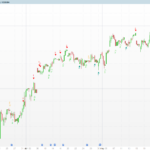
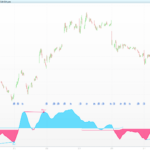
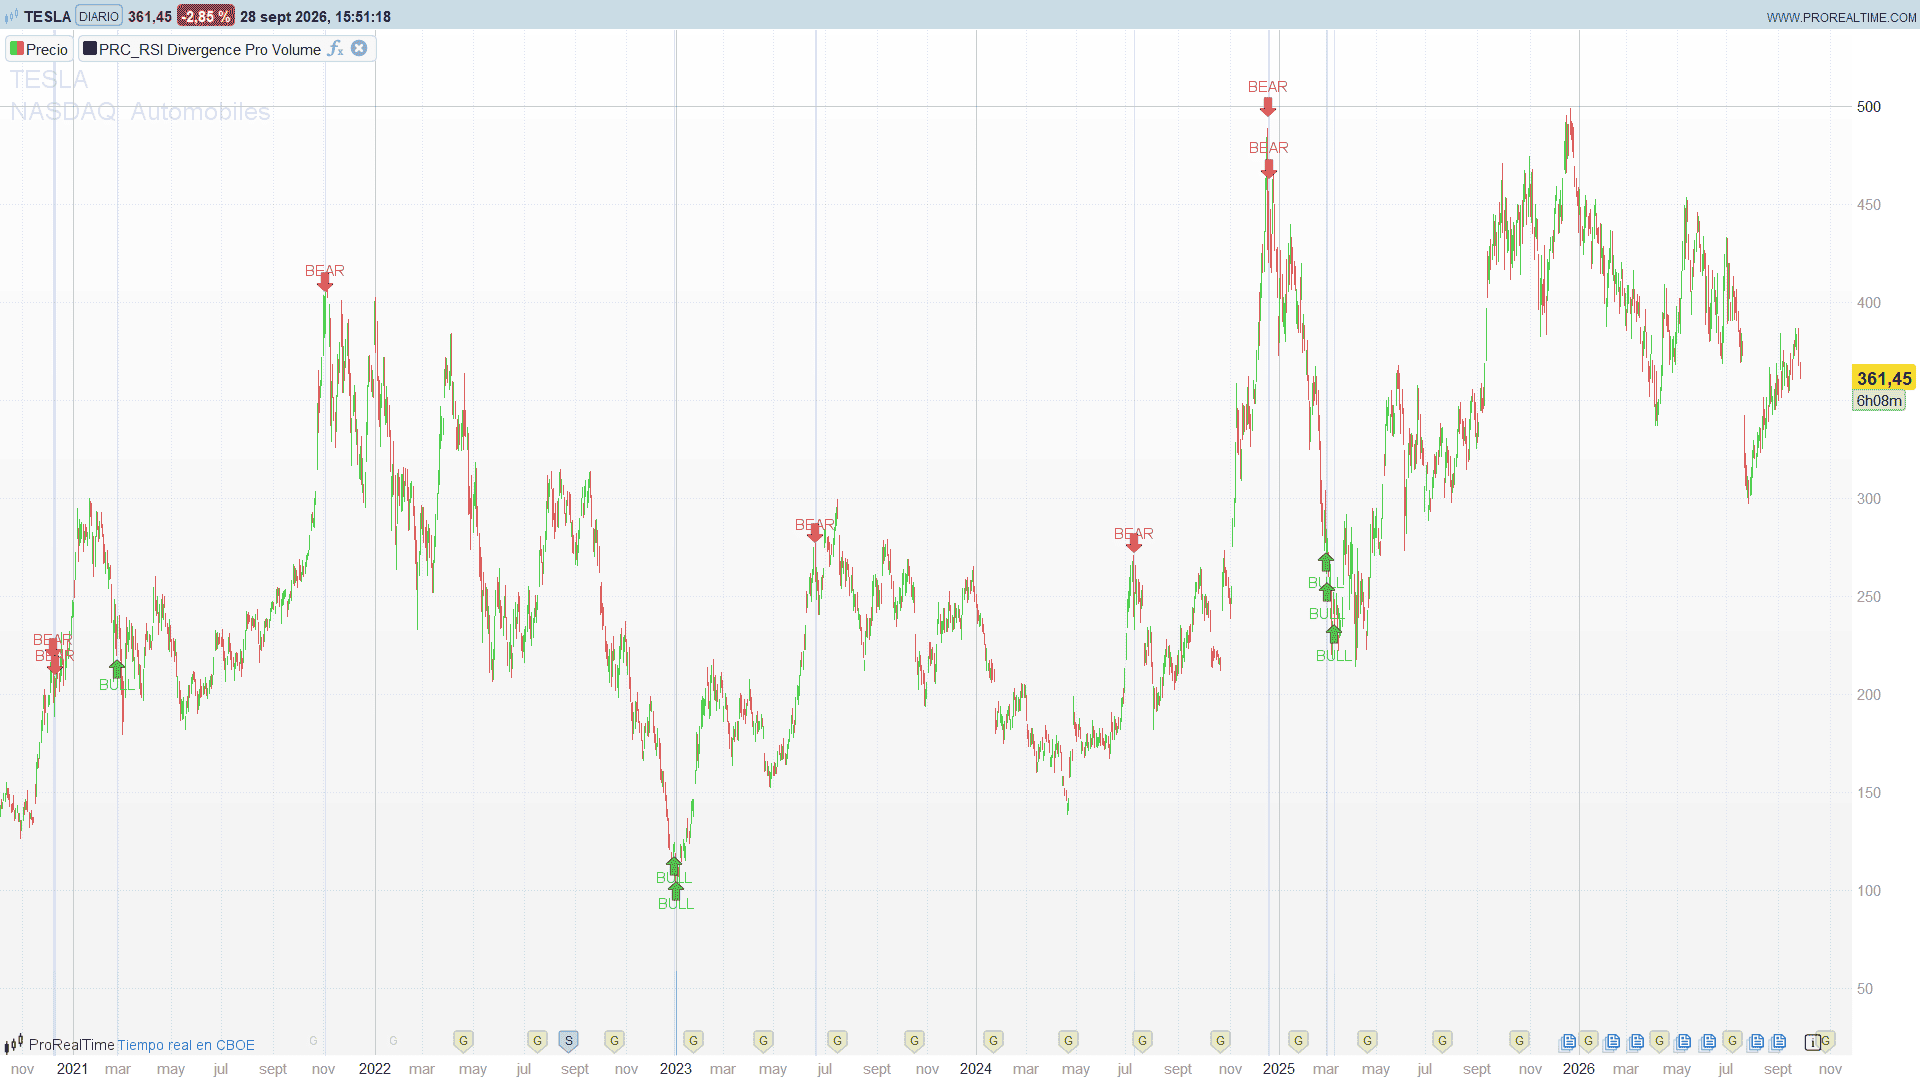
RSI Divergence Pro+ Volume by Finntech1 takes a different route. It never looks for a pivot. It compares the current bar against the extreme of a short window a few bars back, adds a volume filter and an oversold/overbought gate, and marks the bar with a BULL or BEAR label and an arrow the moment the bar closes. No pivot, no confirmation delay, no repainting.
That design choice is the interesting part of this translation, and it is also where the honest criticism belongs. This article covers both: how the indicator works, how it translates to ProBuilder in a handful of lines, and what you should know about its logic before trusting it.
Theory Behind the Indicator
1. A divergence without pivots
A divergence needs two points in time. This indicator picks them like this:
- Second point: the current bar. Simple.
- First point: the extreme of a window of
comparison_windowbars that endsdivergence_lookbackbars ago.
With the defaults (comparison_window = 5, divergence_lookback = 4) the first point is the lowest low among bars 4 to 8 before the current one. In Pine:
price_low_prior = ta.lowest(low, 5)[4]
rsi_low_prior   = ta.lowest(rsi, 5)[4]
A bullish divergence is then just two comparisons:
low < price_low_prior     // price makes a lower low
rsi > rsi_low_prior       // but RSI makes a higher low
And the bearish case is the mirror image with highest. That is the whole divergence engine. Note what is missing: nothing requires price_low_prior to be a swing low. It is simply the minimum of a five-bar window, which may well sit in the middle of a downtrend rather than at a turning point. This is the trade-off the author accepted, and we will come back to it.
2. The volume confirmation
This is the “+ Volume” in the name, and it is the filter the author leans on to cut false signals:
volOK = volume > average[21](volume) * 1.3
The signal bar must trade at least 30% above its 21-bar average volume. The author’s default is stricter, 1.8x, nearly twice the average; this version ships with 1.3 because the volume filter sits on top of three other conditions on the same bar, and at 1.8 signals become too rare to be useful (more on this below). The reasoning behind the filter is standard: a reversal that nobody participates in is not a reversal. A lower low on thin volume is drift; a lower low on a volume spike, with RSI refusing to follow, is potential capitulation.
3. The extreme-zone gate
A bullish divergence only counts if RSI is below 35 on the signal bar; a bearish one only if RSI is above 65. Note this is measured on the signal bar, not on the prior extreme. Since the prior RSI low was lower still, both points sit in oversold territory. This restricts signals to genuinely stretched conditions.
4. The momentum-acceleration filter
The last condition is the odd one:
mom = ta.mom(rsi, 3)              // rsi - rsi[3]
is_rsi_rising = mom > mom[4]
mom is the 3-bar rate of change of RSI. Comparing it to its own value 4 bars ago makes is_rsi_rising a measure of acceleration — a second derivative of RSI. It is not part of any divergence definition, and rsi > rsi_low_prior already establishes the higher low. In practice it just removes signals, in a way that is hard to reason about. We keep it for fidelity, but flag it below.
Translating to ProBuilder
The lesson of this translation is knowing what not to build.
Do not manufacture pivots the original never had
Seeing “divergence” in a title invites the classic ProBuilder pattern: detect oscillator pivots with left/right lookbacks, push them into parallel arrays alongside the price at each pivot bar, compare the last two. That is thirty to sixty lines, plus arrays, plus a confirmation lag.
None of it is needed here, because ProBuilder lets you index the result of a function exactly like Pine does:
priceLowPrior  = lowest[compWindow](low)[divLookback]
rsiLowPrior    = lowest[compWindow](myrsi)[divLookback]
priceHighPrior = highest[compWindow](high)[divLookback]
rsiHighPrior   = highest[compWindow](myrsi)[divLookback]
ta.lowest(src, n)[k] becomes lowest[n](src)[k]. One line per extreme, no arrays, no state machine. If you build pivots where the original had a sliding window, you are not translating the indicator — you are changing it, and its signals will no longer match TradingView.
rsi is a reserved function name
rsi[n](src) is native in ProBuilder, so the variable cannot be called rsi. It becomes myrsi. The same trap catches min, range, at and macdline. And ta.mom(rsi, 3) needs no native call at all — the explicit subtraction is exact and transparent:
myrsi  = rsi[rsiLen](close)
momRSI = myrsi - myrsi[3]
Background colour: one call per bar, always
This is the subtle one. Pine’s bgcolor() paints only on signal bars, and the naive translation puts backgroundcolor(...) inside the IF. In ProBuilder that is a bug: conditional painting functions (BackgroundColor, ColorBetween, FillColor) carry the last active colour forward until the next effective call. Painting only on signal bars leaves the blue smeared across every bar that follows.
The fix is to compute the alpha inside the IF and make the call outside it, on every bar:
bgAlpha = 0
if highlightBars and (isBullDiv or isBearDiv) then
    bgAlpha = 38
endif
backgroundcolor(41, 98, 255, bgAlpha)
With alpha 0, nothing is painted. The 38 is not arbitrary either: Pine’s transparency runs 0-100 with 0 opaque, ProBuilder’s alpha runs 0-255 with 255 opaque, so alphaPRT = 255 * (1 - transp/100). The original’s color.new(#2962FF, 85) gives 38.
Labels are inline events — no DRAWONLASTBARONLY
Each BULL / BEAR mark belongs to its own bar and never changes again. That makes it an immutable historical event, drawn inline, with no DEFPARAM DRAWONLASTBARONLY = TRUE. Adding that defparam here would be actively wrong: it would wipe every historical label and leave only the last one. The defparam is for the third class of drawing — objects deleted retroactively — which this indicator does not have.
One real loss: Pine’s label.style_label_up draws a coloured balloon with white text inside. ProBuilder has drawtext, which is coloured text with no fill. To keep the signal readable at a glance, each label is paired with a native arrow (drawarrowup / drawarrowdown) placed between the text and the candle: the text sits one ATR away from the bar, the arrow half an ATR. This has a knock-on effect on the inputs. use_gradient and gradient_strength (70) controlled the balloon’s fill transparency; applying that 70% to ProBuilder text would give alpha 77 and render it nearly unreadable. So the text stays opaque and the transparency lives only in the bar background. Copying the number faithfully would have made a worse indicator.
The overlay returns nothing
The original is overlay=true and plots no series — only labels and background. So the code ends with a bare RETURN. Returning isBullDiv/isBearDiv would push a 0/1 series onto a price scale of, say, 4500, destroying the auto-scaling and showing nothing at all. If you want the signal for alerts or a screener, it belongs in a separate panel indicator.
The ProBuilder Code
//----------------------------------------------
//PRC_RSI Divergence Pro Volume
//version = 0
//16.07.26
//Ivan Gonzalez @ www.prorealcode.com
//Author: Finntech1
//Sharing ProRealTime knowledge
//----------------------------------------------
// --- Parameters ---
rsiLen = 13          // RSI length
overbought = 65      // overbought filter for the bearish divergence
oversold = 35        // oversold filter for the bullish divergence
divLookback = 4      // bars back where the first point of the divergence is anchored
compWindow = 5       // length of the window searched for that prior extreme
volMult = 1.3        // multiplier applied to the volume average
volMaLen = 21        // length of the volume average
showLabels = 1       // 1 = draw the BULL / BEAR labels
highlightBars = 1    // 1 = highlight the background of the signal bar
//----------------------------------------------
// --- Base indicators ---
//----------------------------------------------
myrsi = rsi[rsiLen](close)
momRSI = myrsi - myrsi[3]
volMA = average[volMaLen](volume)
volOK = volume > volMA * volMult
//----------------------------------------------
// --- First point of the divergence ---
//----------------------------------------------
priceLowPrior = lowest[compWindow](low)[divLookback]
rsiLowPrior = lowest[compWindow](myrsi)[divLookback]
priceHighPrior = highest[compWindow](high)[divLookback]
rsiHighPrior = highest[compWindow](myrsi)[divLookback]
// RSI momentum acceleration
isRsiRising = momRSI > momRSI[divLookback]
isRsiFalling = momRSI < momRSI[divLookback]
//----------------------------------------------
// --- Divergence conditions ---
//----------------------------------------------
isBullDiv = 0
isBearDiv = 0
minBars = rsiLen + compWindow + divLookback + 3
if barindex > minBars then
   // Bullish: price makes a lower low, RSI makes a higher low
   if low < priceLowPrior and myrsi > rsiLowPrior and isRsiRising and volOK and myrsi < oversold then
      isBullDiv = 1
   endif
   // Bearish: price makes a higher high, RSI makes a lower high
   if high > priceHighPrior and myrsi < rsiHighPrior and isRsiFalling and volOK and myrsi > overbought then
      isBearDiv = 1
   endif
endif
//----------------------------------------------
// --- Display ---
//----------------------------------------------
atrOff = averagetruerange[14](close)
if showLabels and isBullDiv then
   drawtext("BULL", barindex, low - atrOff) coloured(76, 175, 80, 255)
   drawarrowup(barindex, low - 0.5*atrOff) coloured(76, 175, 80, 255)
endif
if showLabels and isBearDiv then
   drawtext("BEAR", barindex, high + atrOff) coloured(255, 82, 82, 255)
   drawarrowdown(barindex, high + 0.5*atrOff) coloured(255, 82, 82, 255)
endif
// Signal bar background: called on every bar, alpha 0 when there is no signal
bgAlpha = 0
if highlightBars and (isBullDiv or isBearDiv) then
   bgAlpha = 38
endif
backgroundcolor(41, 98, 255, bgAlpha)
//----------------------------------------------
return
What You Should Know Before Trusting It
A faithful translation does not make an indicator good. Three things deserve saying plainly.
The horizon is eight bars, not fifty. The window runs from divLookback to divLookback + comparison_window - 1 bars back, so with the defaults the whole divergence spans eight bars. These are micro-divergences — short-term exhaustion — not the multi-week divergence the name suggests. If you want the classic behaviour, raise divergence_lookback to 10-20 and comparison_window to 10-15, or use a pivot-based detector instead.
The first point is not a swing. Because there is no pivot test, the anchor can be any five-bar minimum, including one in the middle of a downtrend that never turned. This is the price paid for zero lag and no repainting. Whether that trade is worth it depends on your timeframe, but it should be a conscious choice rather than a surprise.
The momentum-acceleration filter is the weak link. mom > mom[4] is a second derivative of RSI. It is not part of the divergence definition, it overlaps with the higher-low test already in place, and it mostly just thins the signal count in a way that resists interpretation. If you carry this logic into a strategy, removing isRsiRising from the condition is a one-line change and the first experiment worth running.
Finally, be aware the filters compound. Volume above its average by a margin and RSI in the extreme zone and accelerating momentum and both divergence conditions, all on the same bar, makes signals rare. That is not necessarily bad — fewer false positives — but if you backtest it and find a dozen trades in ten years, the sample will not tell you anything. That is why the volume multiplier defaults to 1.3 here instead of the author’s 1.8: it is the natural first knob to relax. If you still see too few signals, 1.2 is the next step; if you want the stricter behaviour, set volMult back to 1.8.
Conclusion
RSI Divergence Pro+ Volume is a short-horizon exhaustion detector wearing the name of a classic divergence tool. Read it that way and it is a reasonable, honest design: no pivots means no lag and no repainting, and the volume filter does real work in cutting noise. Read it as a textbook divergence indicator and it will disappoint you, because eight bars is not where those live.