RSI Fukuiz Trend Indicator
Introduction
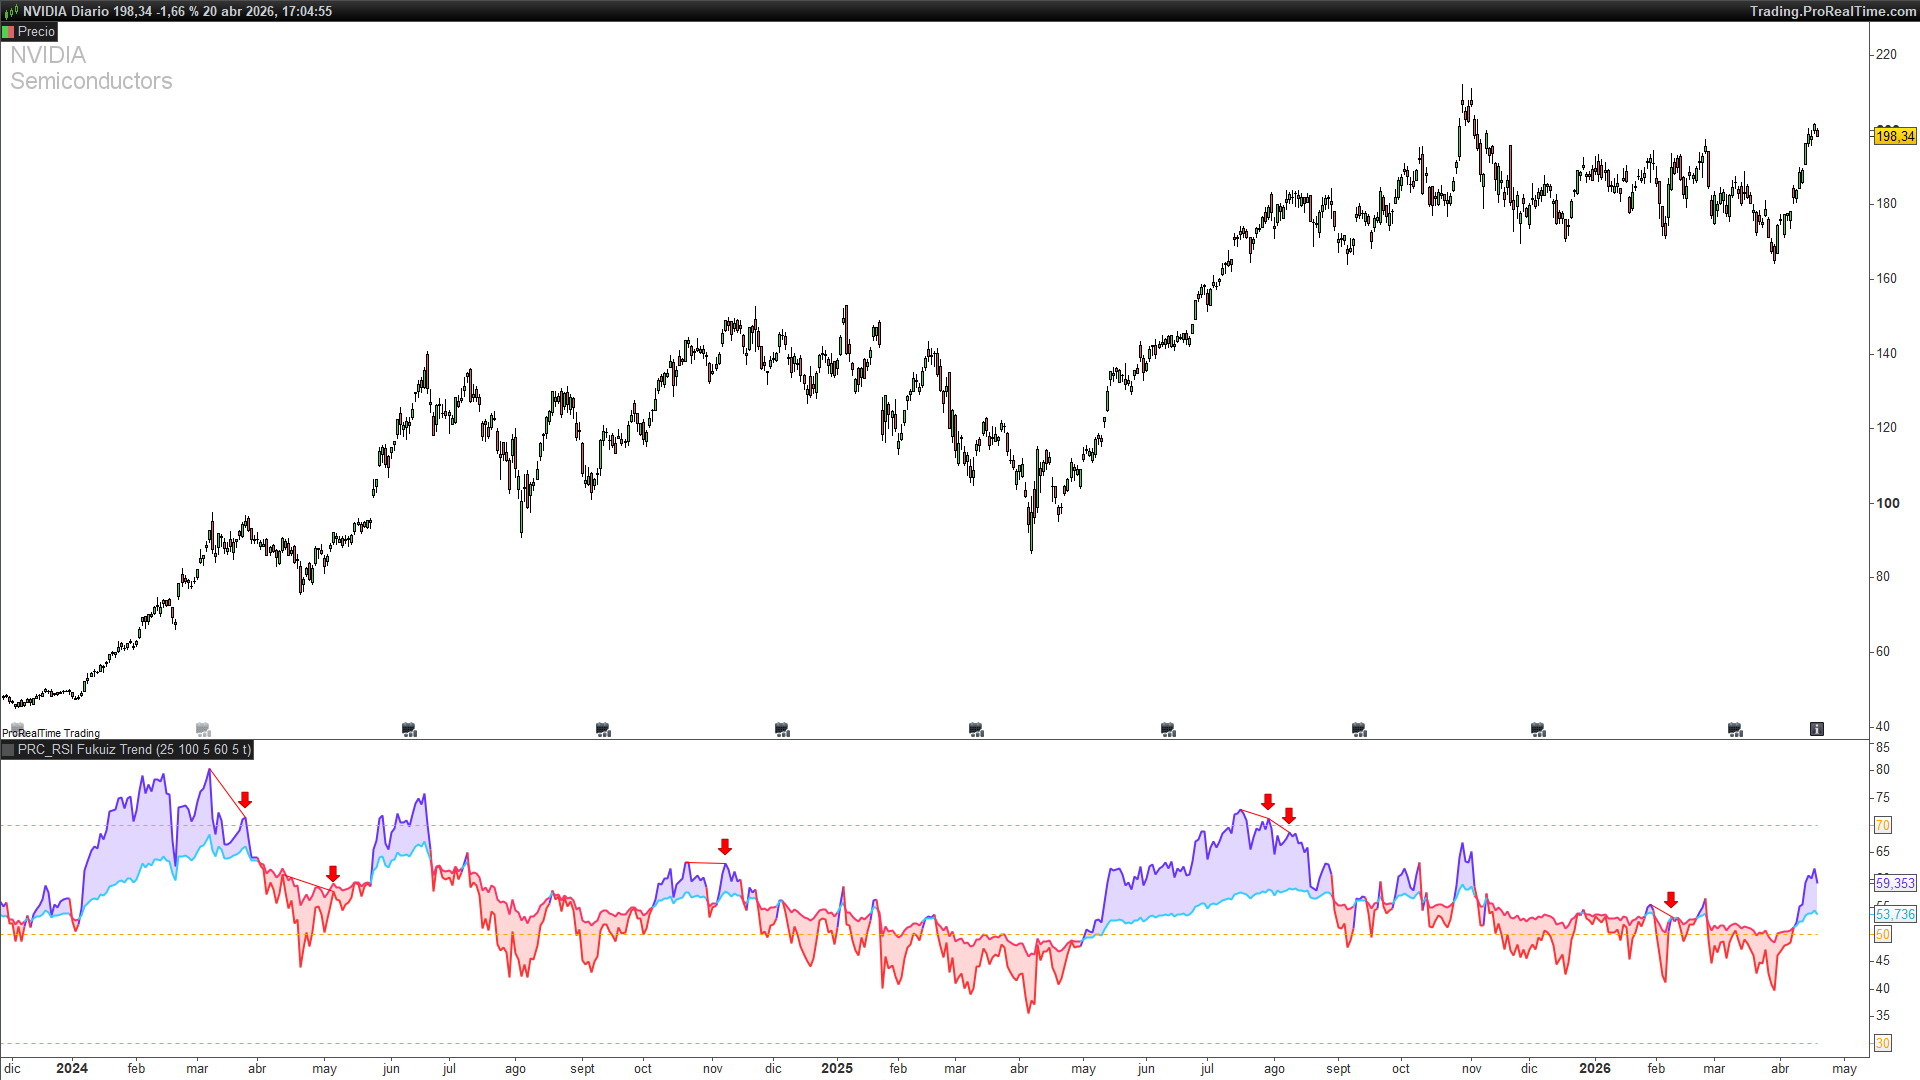
The Fukuiz Trend indicator, originally published on TradingView, combines two well-known techniques into a single clean oscillator: a dual-RSI trend filter and an automated divergence detector. Instead of using a single 14-period RSI and guessing which reading matters, Fukuiz layers a fast RSI (25 periods) over a slow one (100 periods) and paints the space between them with a color that reveals the dominant regime at a glance.
Underneath, the indicator scans the fast RSI for pivot highs and lows and automatically draws bullish and bearish divergence lines against price — a task most traders do manually and inconsistently. The result is a momentum oscillator that simultaneously tells you the trend direction and flags potential reversal signals without cluttering the chart.
Theory Behind the Indicator
Why Two RSIs Instead of One
A single RSI is a momentum reading over a single timeframe. Its main weakness is obvious: the same 70/30 thresholds behave very differently depending on whether the market is trending or ranging. In a strong uptrend, RSI(14) can stay above 70 for weeks; in a range, the same level means exhaustion.
The dual-RSI approach sidesteps the threshold problem by using relative momentum instead of absolute levels:
- Fast RSI (25 periods) — responds to short-term swings
- Slow RSI (100 periods) — captures the underlying momentum regime
The core signal is the relationship between them:
bullish = fast_RSI > slow_RSI
bearish = fast_RSI < slow_RSI
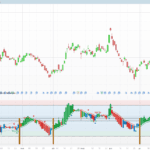
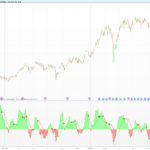
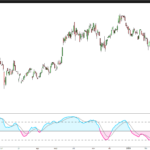
When the fast RSI sits above the slow RSI, recent momentum is stronger than the prevailing regime — that’s a bullish bias, regardless of the absolute RSI level. The indicator fills the space between the two lines with color (blue/purple when bullish, red/pink when bearish), producing an immediate visual read of the current regime.
This construction is resilient: instead of asking “is RSI above 70?” (which lies in trends), it asks “is short-term momentum outpacing the broader momentum?” — a question that behaves consistently across trending and ranging conditions.
Automatic Divergence Detection
The divergence engine works on pivots of the RSI series, confirmed with a right-look-ahead of 5 bars (lbR = 5). A pivot low is identified when the RSI printed a local minimum 5 bars ago that was lower than anything in the lbL bars before it. The same logic, mirrored, detects pivot highs.
Once two consecutive pivot lows (or highs) have been located, the indicator evaluates the classical divergence condition:
Bullish divergence:
- RSI pivot lows: HL (higher low on oscillator)
- Price at same pivot bars: LL (lower low on price)
- Separation between pivots: between 5 and 60 bars (prevents stale or noisy signals)
Bearish divergence:
- RSI pivot highs: LH (lower high on oscillator)
- Price at same pivot bars: HH (higher high on price)
- Same 5–60 bar separation filter
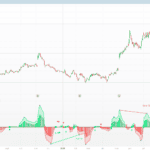
When all three conditions hold, the indicator draws an arrow (green for bullish, red for bearish) at the RSI pivot and connects the two oscillator pivots with a line — making the divergence explicit and hard to miss.
Key Features at a Glance
| Feature | Behaviour |
|---------|-----------|
| Fast RSI | Length 25, recent momentum |
| Slow RSI | Length 100, regime momentum |
| Regime fill | Colored band between the two RSIs |
| Bullish divergence | RSI HL + price LL (5–60 bars apart) |
| Bearish divergence | RSI LH + price HH (5–60 bars apart) |
| Reference bands | Fixed 30 / 50 / 70 |
How to Read the Indicator
- Regime color — if the fill is blue/purple, the market is in a bullish momentum regime; red/pink = bearish. Use this as a directional bias filter for your own entries.
- Divergence arrows — green up-arrows flag potential reversal lows; red down-arrows flag potential reversal highs. Divergences are higher-probability when they appear at regime boundaries (fast RSI crossing slow RSI).
- 30/50/70 reference bands — dotted orange lines provide visual anchors. Crossovers of the 50 midline by the fast RSI often coincide with regime changes.
Practical Applications
- Regime-filtered entries: only take long setups when the fill is bullish, shorts when bearish. Avoids counter-trend trades in momentum.
- Divergence triggers at extremes: bearish divergence arrows appearing above 70 on the fast RSI are higher-confidence reversal signals than mid-band divergences.
- Failed divergence as continuation: if a bearish divergence arrow appears but the regime fill remains bullish and price keeps pushing, the divergence has failed — often a strong continuation signal.
- Confluence with price structure: pair with support/resistance or trendlines — divergences at structural levels are dramatically more reliable than divergences in the middle of a range.
Indicator Configuration
| Parameter | Default | Description |
|-----------|---------|-------------|
| `len` | 25 | Fast RSI length |
| `len2` | 100 | Slow RSI length |
| `src` | close | RSI source price |
| `lbR` | 5 | Right lookback for pivot confirmation |
| `lbL` | 5 | Left lookback for pivot validation |
| `rangeUpper` | 60 | Max bars between pivots for valid divergence |
| `rangeLower` | 5 | Min bars between pivots for valid divergence |
| `showdiv` | 1 | Toggle divergence drawings (1 = show) |
Shorter len/len2 ratios (e.g. 14/50) make the regime fill more reactive; longer ratios (25/200) produce more stable regime reads with fewer false regime flips. The 5–60 bar divergence window is a sensible default — widening it catches more divergences but also more noise.
Implementation Notes
The ProBuilder translation preserves the full logic of the original Pine Script. Two details worth mentioning:
- Manual RSI calculation. The indicator computes the RSI from scratch using the SMMA recurrence (alpha = 1/length) instead of calling rsi[] directly. This matches the exact formulation used by Fukuiz (identical to Pine’s ta.rma over srcUp / srcDw). ProBuilder’s native WilderAverage uses the same alpha but a slightly different warm-up, which can produce visible differences on the first bars — hence the manual version.
- Pivot arrays. The ProBuilder translation uses $pl, $ph, $plx, $phx, $priceL, $priceH arrays with counters z and t to store pivot history. This is the canonical pattern for pivot-based divergences in ProBuilder — roughly equivalent to Pine’s array.push() on dynamic arrays.
Code
//------------------------------------------------------------------------//
//PRC_RSI Fukuiz Trend
//version = 0
//30.05.24
//Iván González @ www.prorealcode.com
//Sharing ProRealTime knowledge
//------------------------------------------------------------------------//
//-----Inputs-------------------------------------------------------------//
//-----RSI
len=25
len2=100
src=close
//-----Pivots
lbR=5//lookback Right
lbL=lbR//lookback Left
//-----Divergences
rangeUpper=60
rangeLower=5
showdiv=1
//------------------------------------------------------------------------//
//------------------------------------------------------------------------//
srcUp=max(close-close[1],0)
srcDw=-min(close-close[1],0)
alpha=1/len
if barindex=len then
up=average[len](srcup)
dw=average[len](srcdw)
else
up=alpha*srcup+(1-alpha)*up[1]
dw=alpha*srcdw+(1-alpha)*dw[1]
endif


alpha2=1/len2
if barindex=len2 then
up2=average[len2](srcup)
dw2=average[len2](srcdw)
else
up2=alpha2*srcup+(1-alpha2)*up2[1]
dw2=alpha2*srcdw+(1-alpha2)*dw2[1]
endif


if dw=0 then
myrsi=100
elsif up=0 then
myrsi=0
else
myrsi=100-100/(1+up/dw)
endif
if dw2=0 then
myrsi2=100
elsif up2=0 then
myrsi2=0
else
myrsi2=100-100/(1+up2/dw2)
endif
//------------------------------------------------------------------------//
//------------------------------------------------------------------------//
bullish=myrsi>myrsi2
bearish=myrsi<myrsi2
//------------------------------------------------------------------------//
//-----Pivots High-Low ---------------------------------------------------//
osc=rsi[len](src)
src1=osc
//------------------------------------------------------------------------//
//-----pivots low
if src1 > src1[lbR] and lowest[lbR](src1) > src1[lbR] and src1[lbR] < lowest[lbL](src1)[lbR+1] then
$pl[z+1]=src1[lbR]
$plx[z+1]=barindex[lbR]
$priceL[z+1]=low[lbR]
z=z+1
endif
//-----pivots high
if src1 < src1[lbR] and highest[lbR](src1)<src1[lbR] and src1[lbR]>highest[lbL](src1)[lbR+1] then
$ph[t+1]=src1[lbR]
$phx[t+1]=barindex[lbR]
$priceH[t+1]=high[lbR]
t=t+1
endif
//-----New Pivot found
plfound=z<>z[1]
phfound=t<>t[1]
//------------------------------------------------------------------------//
//-----Divergences--------------------------------------------------------//
//-----Bullish Divergences
oscHL = $pl[z]>$pl[max(0,z-1)] and (barindex-$plx[max(0,z-1)])<=rangeUpper and (barindex-$plx[max(0,z-1)])>=rangeLower
priceLL = $priceL[z]<$priceL[max(0,z-1)]
bullcond = plfound and oscHL and priceLL


if bullcond and showdiv then
drawarrowup(barindex[lbR],osc[lbR]-3)coloured("green")
drawsegment($plx[max(0,z-1)],$pl[max(0,z-1)],$plx[z],$pl[z])coloured("green")
endif
//-----Bearish Divergences
oscLH = $ph[t]<$ph[max(0,t-1)] and (barindex-$phx[max(0,t-1)])<=rangeUpper and (barindex-$phx[max(0,t-1)])>=rangeLower
priceHH = $priceH[t]>$priceH[max(0,t-1)]
bearCond = phfound and oscLH and priceHH


if bearCond and showdiv then
drawarrowdown(barindex[lbR],osc[lbR]+3)coloured("red")
drawsegment($phx[max(0,t-1)],$ph[max(0,t-1)],$phx[t],$ph[t])coloured("red")
endif
//------------------------------------------------------------------------//
//-----Plot bands---------------------------------------------------------//
bandDw=30
bandMd=50
bandUp=70
//-----Colours------------------------------------------------------------//
if bullish then
r=102
g=51
b=255
rr=51
gg=204
bb=255
elsif bearish then
r=255
g=51
b=51
rr=255
gg=51
bb=102
endif
colorbetween(myrsi,myrsi2,r,g,b,50)
//------------------------------------------------------------------------//
return myrsi as "RSI Short"coloured(r,g,b)style(line,2),myrsi2 as "RSI Long"coloured(rr,gg,bb)style(line,2),bandDw as "Lower Band"coloured("orange")style(dottedline),bandUp as"Upper Band"coloured("orange")style(dottedline),bandMd as "Middle Band"coloured("orange")style(dottedline)