

Gaussian Channel Indicator: Key to Identifying Trends and Volatility
Introduction
The Gaussian Channel is an advanced technical indicator that uses statistical principles to determine the upper and lower limits of an asset’s price movements. This indicator is especially valuable for identifying the overall market trend and potential reversal points through the analysis of standard deviations of a moving average.
Theory Behind the Gaussian Channel
The Gaussian Channel is an indicator based on the analysis of the normal distribution of prices around an adaptive moving average. This analysis is based on statistical theory that posits that asset prices, like many other variables in nature and society, tend to follow a normal or Gaussian distribution under certain conditions.
Mathematical Foundation:
The core of the Gaussian Channel indicator is based on the equation of the Gaussian curve, where the mean of the data set (prices in this context) forms the central peak of the curve, and the standard deviations determine the dispersion or “width” of the curve around this mean.
Adaptive Moving Average:
Calculated as a weighted average of prices over a given period, which adjusts each bar to more significantly reflect the most recent data than the previous ones. This is achieved using coefficients that decay exponentially.
Calculation of Bands:
Upper and Lower Bands: Determined by adding and subtracting, respectively, a multiple of the standard deviation from the calculated adaptive moving average. The standard deviation is a statistical measure that quantifies the variation or dispersion of a set of values.
Standard Deviation Multiplier: This multiplier, often set at 2 for many statistically based channel applications, defines the width of the channel. A multiplier of 2 ensures that approximately 95% of all prices should fall within the channel under a normal distribution.
Significance in Trading:
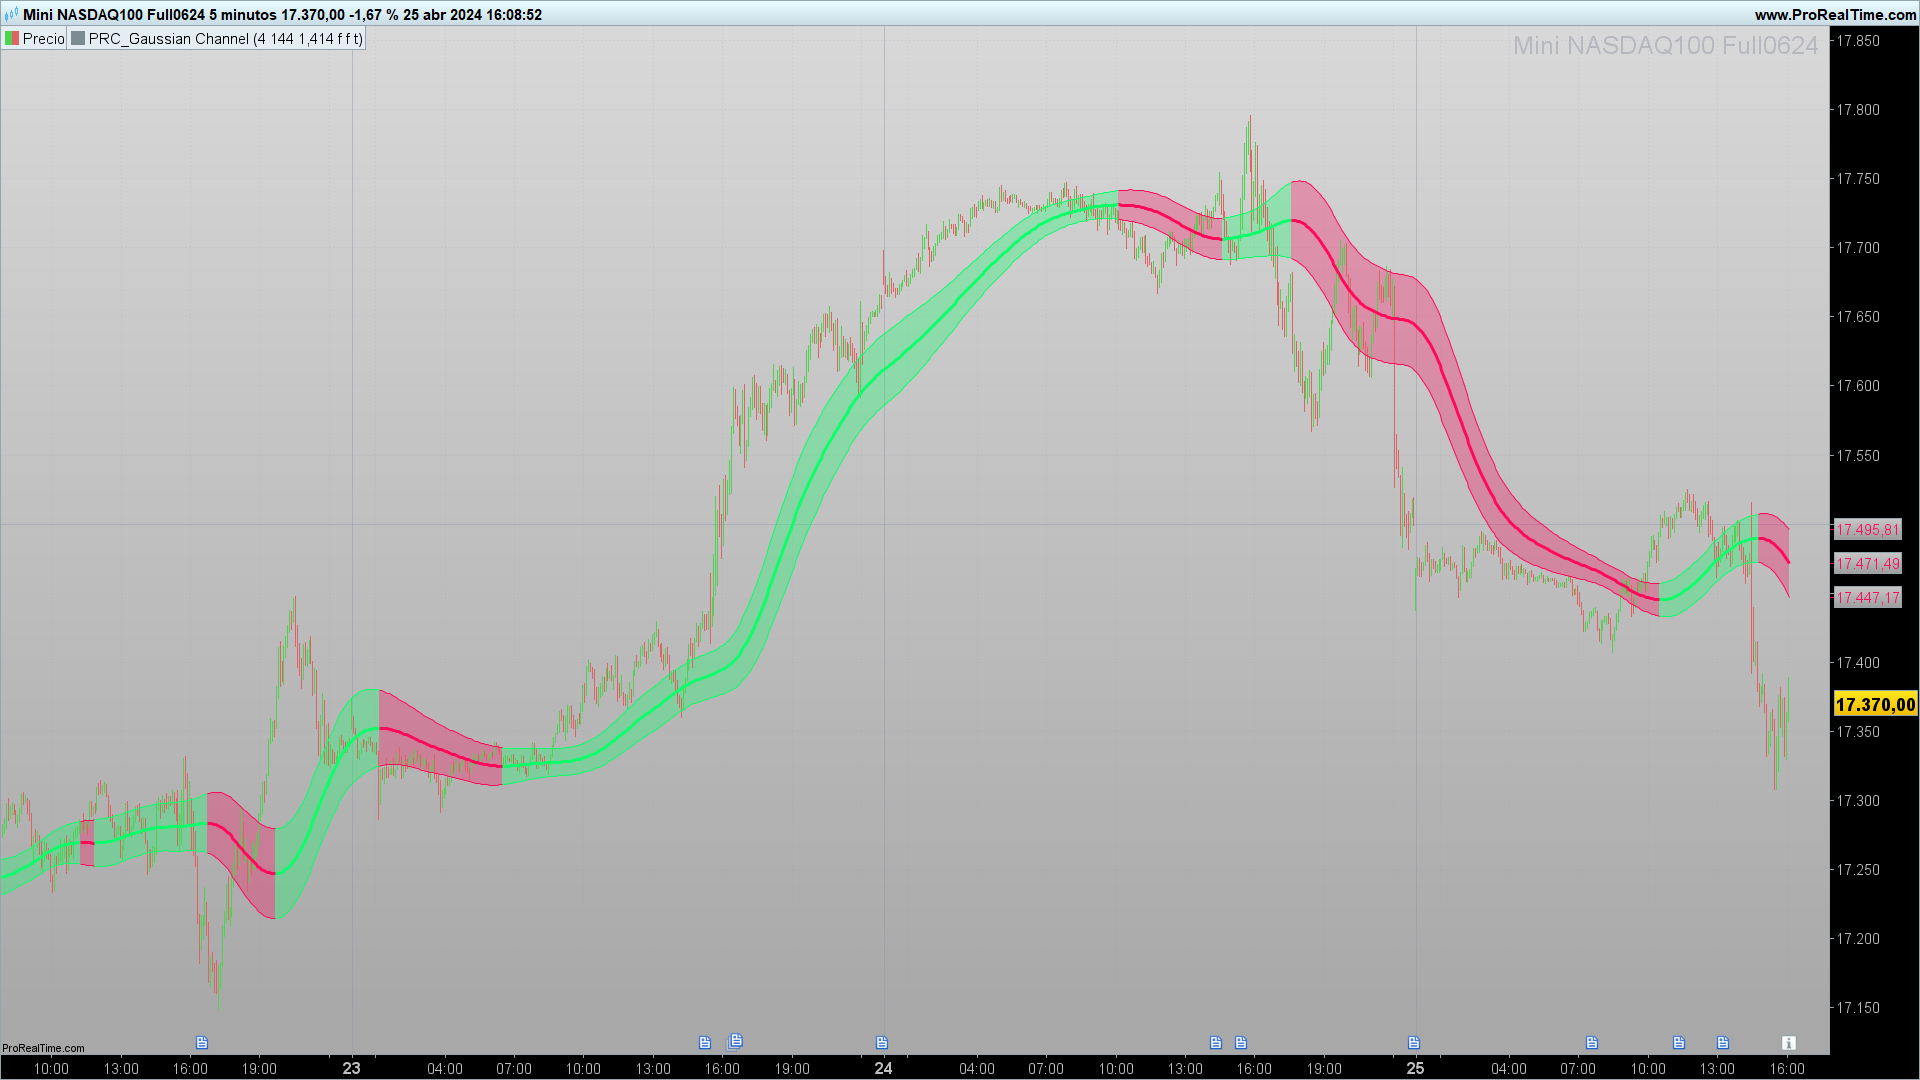
Trading with the Trend: When the price consistently stays near the upper band, it suggests a strong bullish trend, whereas a price close to the lower band indicates a bearish trend.
Volatility Identification: A widening of the channel reflects an increase in market volatility, while a narrower channel suggests a decrease in volatility.
Thus, the Gaussian Channel not only helps visualize trend and volatility but also provides potential entry and exit points based on the statistic that prices will return to their mean with certain regularity.
Practical Applications
This indicator is useful for traders looking to confirm the current trend or identify potential overbought or oversold conditions in the market. For instance, a price that consistently moves near the upper limit of the channel could indicate a strong bullish trend, while a price approaching the lower limit may suggest a bearish trend.
Indicator Configuration
The Gaussian Channel indicator in ProRealTime allows for adjusting several parameters:
N (Number of Poles): Determines the smoothness of the moving average.
per (Sampling Period): Defines the time window for calculating the average and deviations.
mult (True Range Multiplier): Adjusts the amplitude of the bands around the moving average.
These parameters can be calibrated to suit different trading styles and assets, depending on the nature of price movements and the volatility of the instrument in question.
Implementation in ProRealTime
The code for the Gaussian Channel is developed in ProRealTime’s ProBuilder language, facilitating direct integration into the trading platform.
The complete code is designed to be copied and pasted directly into ProRealTime for immediate use.
If you prefer the code with the configurable variables already set up, you can download the .itf file attached to this post.
//-----------------------------------------------------------//
//PRC_Gaussian Channel
//version = 0
//19.04.24
//Iván González @ www.prorealcode.com
//Sharing ProRealTime knowledge
//-----------------------------------------------------------//
//-----Inputs------------------------------------------------//
source=(high+low+close)/3
N=4//Poles
per=144//Sampling period
mult=1.414//True Range multiplier
modelag=0//Boolean//Reduced Lag Mode
colorcandle=0//Boolean//Color Candles
colorchannel=1//Boolean//Color Channel
//-----------------------------------------------------------//
//-----Beta and Alpha components-----------------------------//
beta = (1-cos(4*asin(1)/per))/(pow(1.414,2/N)-1)
alpha = - beta + SQRT(pow(beta,2) + 2*beta)
lag = round((per-1)/(2*N))
//-----------------------------------------------------------//
//-----Data--------------------------------------------------//
if modelag then
if barindex <= lag then
src=source
trdate=tr
else
src=source+(source-source[lag])
trdata=tr+(tr-tr[lag])
endif
else
src=source
trdata=tr
endif
//-----------------------------------------------------------//
//-----Filtered Values---------------------------------------//
x=1-alpha
if N=9 then
m2=36
m3=84
m4=126
m5=126
m6=84
m7=36
m8=9
m9=1
elsif N=8 then
m2=28
m3=56
m4=70
m5=56
m6=28
m7=8
m8=1
m9=0
elsif N=7 then
m2=21
m3=35
m4=35
m5=21
m6=7
m7=1
m8=0
m9=0
elsif N=6 then
m2=15
m3=20
m4=15
m5=6
m6=1
m7=0
m8=0
m9=0
elsif N=5 then
m2=10
m3=10
m4=5
m5=1
m6=0
m7=0
m8=0
m9=0
elsif N=4 then
m2=6
m3=4
m4=1
m5=0
m6=0
m7=0
m8=0
m9=0
elsif N=3 then
m2=3
m3=1
m4=0
m5=0
m6=0
m7=0
m8=0
m9=0
elsif N=2 then
m2=1
m3=0
m4=0
m5=0
m6=0
m7=0
m8=0
m9=0
endif
if barindex <=N then
f1=0
f2=0
f3=0
f4=0
f5=0
f6=0
f7=0
f8=0
f9=0
filtN=0
filttrN=0
else
if N=9 then

f9= pow(alpha,N) * src+N*x*f9[1] - m2*pow(x,2)*f9[2] + m3*pow(x,3)*f9[3] - m4*pow(x,4)*f9[4] + m5*pow(x,5)*f9[5] - m6*pow(x,6)*f9[6] + m7*pow(x,7)*f9[7] - m8*pow(x,8)*f9[8] + m9*pow(x,9)*f9[9]
filtN=f9

ftr9= pow(alpha,N) * trdata+N*x*ftr9[1] - m2*pow(x,2)*ftr9[2] + m3*pow(x,3)*ftr9[3] - m4*pow(x,4)*ftr9[4] + m5*pow(x,5)*ftr9[5] - m6*pow(x,6)*ftr9[6] + m7*pow(x,7)*ftr9[7] - m8*pow(x,8)*ftr9[8] + m9*pow(x,9)*ftr9[9]
filttrN=ftr9

elsif N=8 then

f8= pow(alpha,N) * src+N*x*f8[1] - m2*pow(x,2)*f8[2] + m3*pow(x,3)*f8[3] - m4*pow(x,4)*f8[4] + m5*pow(x,5)*f8[5] - m6*pow(x,6)*f8[6] + m7*pow(x,7)*f8[7] - m8*pow(x,8)*f8[8]
filtN=f8

ftr8= pow(alpha,N) * trdata+N*x*ftr8[1] - m2*pow(x,2)*ftr8[2] + m3*pow(x,3)*ftr8[3] - m4*pow(x,4)*ftr8[4] + m5*pow(x,5)*ftr8[5] - m6*pow(x,6)*ftr8[6] + m7*pow(x,7)*ftr8[7] - m8*pow(x,8)*ftr8[8]
filttrN=ftr8

elsif N=7 then

f7= pow(alpha,N) * src+N*x*f7[1] - m2*pow(x,2)*f7[2] + m3*pow(x,3)*f7[3] - m4*pow(x,4)*f7[4] + m5*pow(x,5)*f7[5] - m6*pow(x,6)*f7[6] + m7*pow(x,7)*f7[7]
filtN=f7

ftr7= pow(alpha,N) * trdata+N*x*ftr7[1] - m2*pow(x,2)*ftr7[2] + m3*pow(x,3)*ftr7[3] - m4*pow(x,4)*ftr7[4] + m5*pow(x,5)*ftr7[5] - m6*pow(x,6)*ftr7[6] + m7*pow(x,7)*ftr7[7]
filttrN=ftr7

elsif N=6 then

f6= pow(alpha,N) * src+N*x*f6[1] - m2*pow(x,2)*f6[2] + m3*pow(x,3)*f6[3] - m4*pow(x,4)*f6[4] + m5*pow(x,5)*f6[5] - m6*pow(x,6)*f6[6]
filtN=f6

ftr6= pow(alpha,N) * trdata+N*x*ftr6[1] - m2*pow(x,2)*ftr6[2] + m3*pow(x,3)*ftr6[3] - m4*pow(x,4)*ftr6[4] + m5*pow(x,5)*ftr6[5] - m6*pow(x,6)*ftr6[6]
filttrN=ftr6

elsif N=5 then

f5= pow(alpha,N) * src+N*x*f5[1] - m2*pow(x,2)*f5[2] + m3*pow(x,3)*f5[3] - m4*pow(x,4)*f5[4] + m5*pow(x,5)*f5[5]
filtN=f5

ftr5= pow(alpha,N) * trdata+N*x*ftr5[1] - m2*pow(x,2)*ftr5[2] + m3*pow(x,3)*ftr5[3] - m4*pow(x,4)*ftr5[4] + m5*pow(x,5)*ftr5[5]
filttrN=ftr5

elsif N=4 then

f4= pow(alpha,N) * src+N*x*f4[1] - m2*pow(x,2)*f4[2] + m3*pow(x,3)*f4[3] - m4*pow(x,4)*f4[4]
filtN=f4

ftr4= pow(alpha,N) * trdata+N*x*ftr4[1] - m2*pow(x,2)*ftr4[2] + m3*pow(x,3)*ftr4[3] - m4*pow(x,4)*ftr4[4]
filttrN=ftr4

elsif N=3 then

f3= pow(alpha,N) * src+N*x*f3[1] - m2*pow(x,2)*f3[2] + m3*pow(x,3)*f3[3]
filtN=f3

ftr3= pow(alpha,N) * trdata+N*x*ftr3[1] - m2*pow(x,2)*ftr3[2] + m3*pow(x,3)*ftr3[3]
filttrN=ftr3

elsif N=2 then

f2= pow(alpha,N) * src+N*x*f2[1] - m2*pow(x,2)*f2[2]
filtN=f2

ftr2= pow(alpha,N) * trdata+N*x*ftr2[1] - m2*pow(x,2)*ftr2[2]
filttrN=ftr2

elsif N=1 then

f1= pow(alpha,N) * src+N*x*f1[1]
filtN=f1

ftr1= pow(alpha,N) * trdata+N*x*ftr1[1]
filttrN=ftr1

endif
endif

filt=filtN
filtTR=filttrN
//-----------------------------------------------------------//
//-----Bands-------------------------------------------------//
hband=filt+filtTR*mult
lband=filt-filtTR*mult
//-----------------------------------------------------------//
//-----Bands Colors------------------------------------------//
if filt > filt[1] then
r=10
g=255
b=104
elsif filt<filt[1] then
r=255
g=10
b=90
else
r=204
g=204
b=204
endif
//-----------------------------------------------------------//
//-----Candle Colors-----------------------------------------//
if colorcandle then
if source > source[1] and source>filt and source < hband then
rb=10
gb=255
bb=104
elsif source > source[1] and source >= hband then
rb=10
gb=255
bb=27
elsif source <= source[1] and source > filt then
rb=0
gb=117
bb=45
elsif source < source[1] and source < filt and source > lband then
rb=255
gb=10
bb=90
elsif source < source[1] and source <= lband then
rb=255
gb=10
bb=17
elsif source >= source[1] and source < filt then
rb=153
gb=0
bb=50
else
rb=204
gb=204
bb=204
endif
DRAWCANDLE(open, high, low, close) coloured(rb,gb,bb)
endif
//-----------------------------------------------------------//
//-----Channel fill color------------------------------------//
if colorchannel then
colorbetween(hband,lband,r,g,b,80)
endif
//-----------------------------------------------------------//
return  hband as "Filtered TR High Band"coloured(r,g,b), lband as "Filtered TR Low Band"coloured(r,g,b),filt as "Filter"coloured(r,g,b)style(line,3)
Conclusion
The Gaussian Channel indicator offers a robust and mathematically grounded perspective for analyzing financial markets, suitable for both novice traders and experienced technical analysts. Its ability to adapt to market volatility makes it indispensable in any technical trading toolkit.
