Gann HiLo activator

Gann HiLo activator

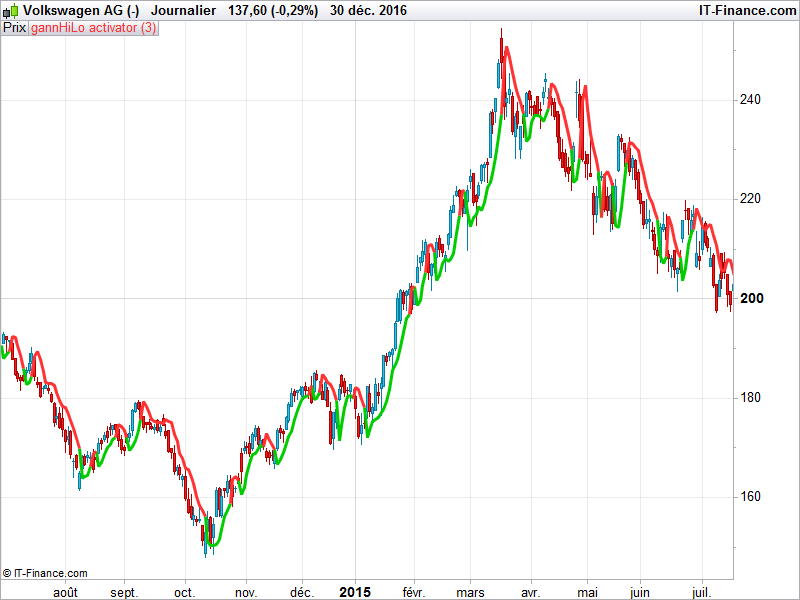
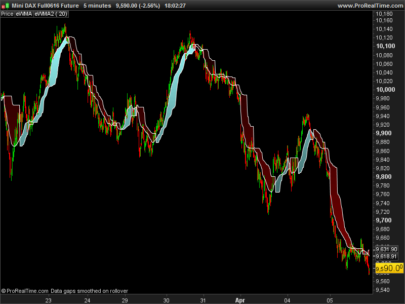
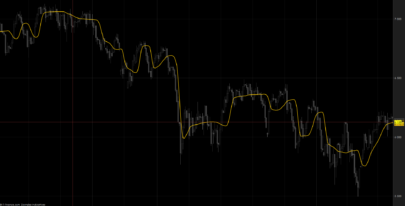
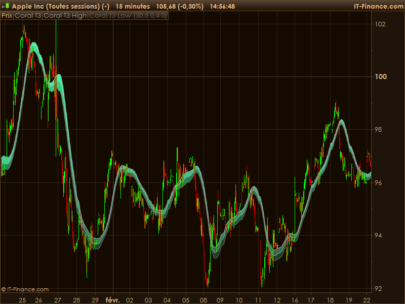
Developed by Robert Krausz, the Gann HiLo Activator is a trend-following technical indicator used to help determine the trend’s direction and to generate with-trend entry signals.

The Gann HiLo Activator is a simple moving average of the previous three periods’ highs or lows. Based on the moving averages logic, it is a trend-following indicator used to reflect the market’s direction of movement. Within the trading system we mentioned earlier, the Gann HiLo activator is responsible for generating entry signals, but also helps determine stop-loss levels.

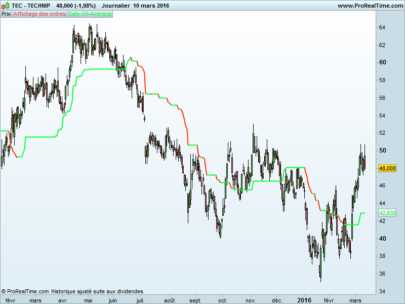
  • Bullish Signal- When price is above the Gann Activator it shows that the trend is bullish and only Buy trades should be executed. In a bullish trend the Gann Activator uses the previous periods’ price lows for calculations.
  • Bearish Signal- When price is below the Gann Activator it shows that the trend is bearish and only Sell trades should be executed. In a bearish trend the Gann Activator uses the previous periods’ price highs for calculations.

Coded by request on forum.


Share this

Risk disclosure:

No information on this site is investment advice or a solicitation to buy or sell any financial instrument. Past performance is not indicative of future results. Trading may expose you to risk of loss greater than your deposits and is only suitable for experienced investors who have sufficient financial means to bear such risk.

ProRealTime ITF files and other attachments : How to import ITF files into ProRealTime platform?

PRC is also on YouTube, subscribe to our channel for exclusive content and tutorials

  1. maxxb • 12/31/2016 #

    salve, 
    vorrei sapere perchè nel suo grafico compare sul prezzo mentre a me compare a parte … 
    grazie

  2. AleX • 12/31/2016 #

    Sul grafico principale accanto alla voce Prezzo (vedi in alto a sinistra proprio sotto l’area di lavoro) c’è una chiave inglese, se ci clicca sopra e poi preme “Aggiungi indicatore” l’indicatore prescelto verrà inserito all’interno del grafico. Cliccando invece sul menù contestuale indicatori gli stessi verranno inseriti al di sotto del grafico “Prezzo” 
     

  3. maxxb • 12/31/2016 #

    perfetto non lo sapevo …. 
    ciao grazie..   
     

avatar
Register or

Likes

avatar avatar avatar avatar avatar
Related users ' posts
Nicolas Dans l'onglet prix, choisir d'appliquer l'échelle qu'au prix uniquement.
Eloi MERCI
TradingDeckard
9 years ago
camarilla pivot points
9
Indicators
Choliver Merci Nicolas pour cette réponse rapide et cette information. J'ai regardé et testé et cela...
carlo__ Sorry, but this indicator doesn't update the levels in real time. They are draw and stucked ...
carlo__ I leave an update. The indicator works as it plots in a progressive way the Cama levels on t...
Nicolas
9 years ago
Adaptive Stochastic
Adaptive Stochastic
1
Indicators
AngelPujalt falta poner bandas por la parte de arriba: 80 y por la parte de abajo: 20
Nicolas
10 years ago
Adaptive CCI
Adaptive CCI
4
Indicators
Stef Thanks @Saud. Enjoyed the article.
Newbie I've tried to modify this so I can display on 1min chart with the 5 min chart variant as a s...
Nicolas No, just create 2 different indicators in this case, one with the timeframe(5 minutes) and o...
GraHal Hi Nicolas I like this and would like to understand it fully so please forgive the (maybe) d...
Nicolas Hi GraHal, the Factor parameter is only a multiplier of the ATR that is added or subtracted ...
GraHal Nicolas, thank you for your useful and informative response. Yes I optimise using ProBackte...
Nicolas
10 years ago
Denis Hello, Congratulations and thank you for this work. I do not understand one thing, however...
Nicolas
10 years ago
GraHal Hi Nicolas Britains .itf file didn't work for me ... I had to change h to hh at line 13 and...
Nicolas Thank you GraHal for pointing this error, i have corrected the code in the file. The code in...
sr021 Hi I tried to copy and paste the code, but recieve the message  : Syntax error:The followi...
Nicolas Hello, of course. You have 3 options : 1/ you download the file and import it into your plat...
Nicolas
10 years ago
Nicolas
10 years ago
Nicolas
10 years ago
trabucaire Hello, what does it mean the 20 and 40 number on this code ? Thank you !
robertogozzi I modified it to make parameters customizable and to Draw a Grey candlestick when a range is...
Nicolas
10 years ago
Blai5 CazaGaps
Blai5 CazaGaps
0
Indicators
Nicolas
10 years ago
Blai5 BB double
Blai5 BB double
0
Indicators
Nicolas
10 years ago
Blai5 ATLAS Mini
Blai5 ATLAS Mini
0
Indicators
Nicolas
10 years ago
Blai5 Astro indicator
0
Indicators
throwaway200
10 years ago
Super Smoothed WMA
Super Smoothed WMA
0
Indicators
dakaodo Very useful when initially learning the timing and rhythm of an instrument. Before using thi...
Denis Then I have tried this but nor does it run : //coloring histogram if pctRankT>=pctile...
Denis Here we are ! //coloring histogram if pctRankT>=pctile/100 then r=255 g=0 b=0 els...
Denis Hi Edisone, see my last comment for setting colors
dave
10 years ago
Value Chart High/Low
12
Indicators
tfx This was my first thought, but 1 minute bars don't look like these on my charts. Hmm...
daveAF  It's SP500 before Wall Street open. 
tfx I will be looking into it. Thank you for responding!
hq76
10 years ago
Ahoora Trend
Ahoora Trend
0
Indicators

Top