Hi all
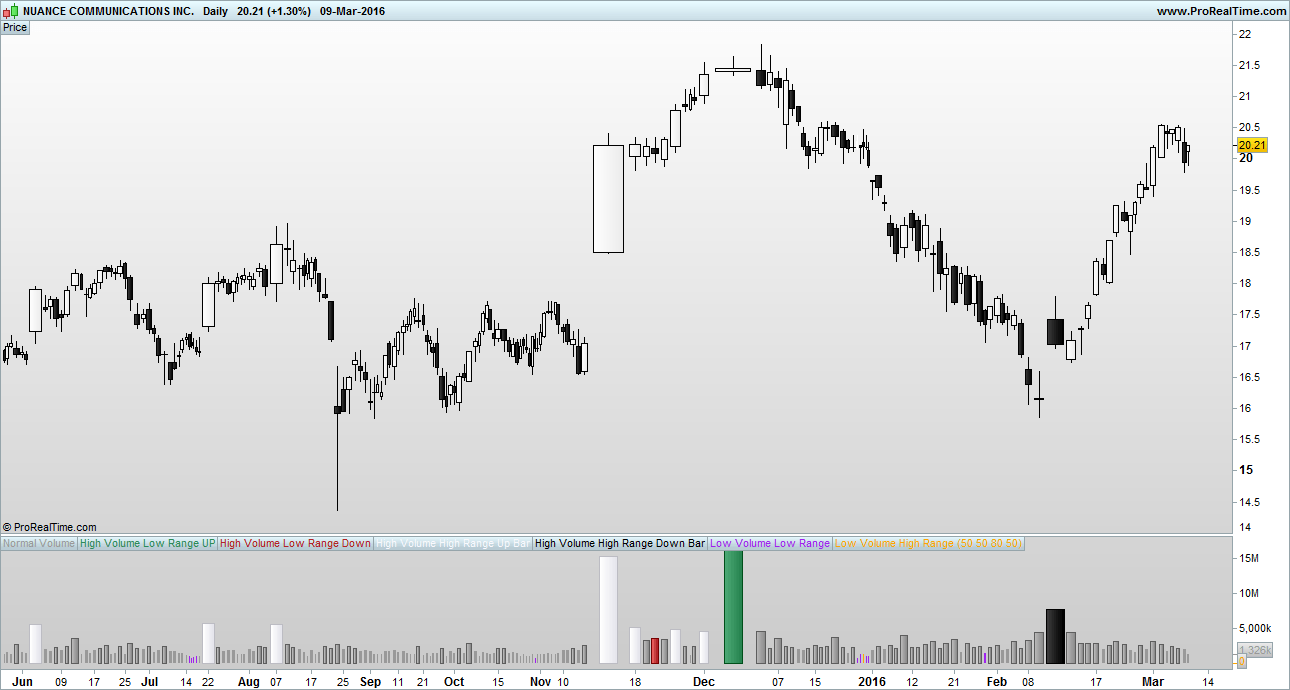
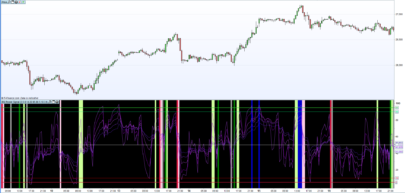
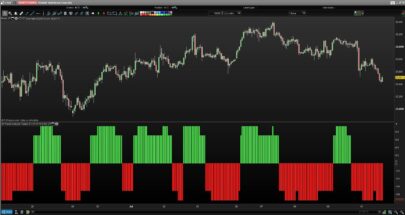
Thought id share my Better Volume indicator to contribute something to the site 🙂 this is my solution to a problem as i felt other better volume indicators out there were over complicating the problem. I used a few MA’s and the built in RANGE() to clean it up.
A link about ‘Better Volume’ and how to interpret it…
http://emini-watch.com/free-stuff/volume-indicator/
You may need to change the colours around for better visability on your background. Feel free to mod it asyou like.
El
Share this
No information on this site is investment advice or a solicitation to buy or sell any financial instrument. Past performance is not indicative of future results. Trading may expose you to risk of loss greater than your deposits and is only suitable for experienced investors who have sufficient financial means to bear such risk.
ProRealTime ITF files and other attachments :PRC is also on YouTube, subscribe to our channel for exclusive content and tutorials



Hi,
Thanks for posting this, I downloaded your first version of Better Volume and it works really well. So I tried loading your second version when I saw the link and although the file is described as my-better-volume-2.itf it only downloads as my-better-volume-1.itf. Am I doing something wrong, or is it possible the link on your post contains the previous file and not the new one?
Kind Regards,
Tony
Hi Tony, just seen your message. TBH I haven’t made a version 2!, maybe the moderator has done? Its a bit of a funny system on here you cant just add your own indicators and stuff without it going through a moderator first. Here is the code im using mate, keep it simple :)….
// Variables to add:
// Label in Program = \"vMA\", Label in properties window = \"Volume Moving Average\", Type = int, Default = \"50\"
// Label in Program = \"vPercentLower\", Label in properties window = \"Low Volume %\", Type = int, Default = \"50\"
// Label in Program = \"vPercentHigerr\", Label in properties window = \"High Volume %\", Type = int, Default = \"80\"
// Label in Program = \"BarRanger\", Label in properties window = \"Bar Range\", Type = int, Default = \"50\"
//Change all indicator styles to \"Histogram\" apart from teh two volume moving averages : LowVolume, HighVolume ..... keep them as lines or make them invisable
VolumeMA = Average[vMA](VOLUME)
LowVolume = (VolumeMA - ((VolumeMA * vPercentLower) / 100))
HighVolume = (VolumeMA + ((VolumeMA * vPercentHigher) / 100))
Vol = VOLUME
ONCE HVLRU = 0
ONCE HVLRD = 0
ONCE HVHRU = 0
ONCE HVHRD = 0
ONCE LVLR = 0
ONCE LVHR = 0
c1 = VOLUME > HighVolume AND RANGE < Average[BarRange](RANGE) AND CLOSE > OPEN
IF c1 THEN
HVLRU = VOLUME
Vol = 0
ELSE
HVLRU = 0
ENDIF
c2 = VOLUME > HighVolume AND RANGE < Average[BarRange](RANGE) AND CLOSE < OPEN
IF c2 THEN
HVLRD = VOLUME
Vol = 0
ELSE
HVLRD = 0
ENDIF
c3 = VOLUME > HighVolume AND RANGE > Average[BarRange](RANGE) AND CLOSE > OPEN
IF c3 THEN
HVHRU = VOLUME
Vol = 0
ELSE
HVHRU = 0
ENDIF
c4 = VOLUME > HighVolume AND RANGE > Average[BarRange](RANGE) AND CLOSE < OPEN
IF c4 THEN
HVHRD = VOLUME
Vol = 0
ELSE
HVHRD = 0
ENDIF
c5 = VOLUME < LowVolume AND RANGE < Average[BarRange](RANGE)
IF c5 THEN
LVLR = VOLUME
Vol = 0
ELSE
LVLR = 0
ENDIF
c6 = VOLUME < LowVolume AND RANGE > Average[BarRange](RANGE)
IF c6 THEN
LVHR = VOLUME
Vol = 0
ELSE
LVHR = 0
ENDIF
RETURN Vol COLOURED (153,153,153) AS \"Normal Volume\", HVLRU COLOURED (46,139,87) AS \"High Volume Low Range UP\", HVLRD COLOURED (178,34,34) AS \"High Volume Low Range Down\", HVHRU COLOURED (248,248,255) AS \"High Volume High Range Up Bar\", HVHRD COLOURED (0,0,0) AS \"High Volume High Range Down Bar\", LVLR COLOURED (160,32,240) AS \"Low Volume Low Range\", LVHR COLOURED (255,165,0) AS \"Low Volume High Range\", HighVolume COLOURED (216,191,216) AS \"High Vol MA\", LowVolume COLOURED (216,191,216) AS \"Low Vol MA\"