1. Introduction
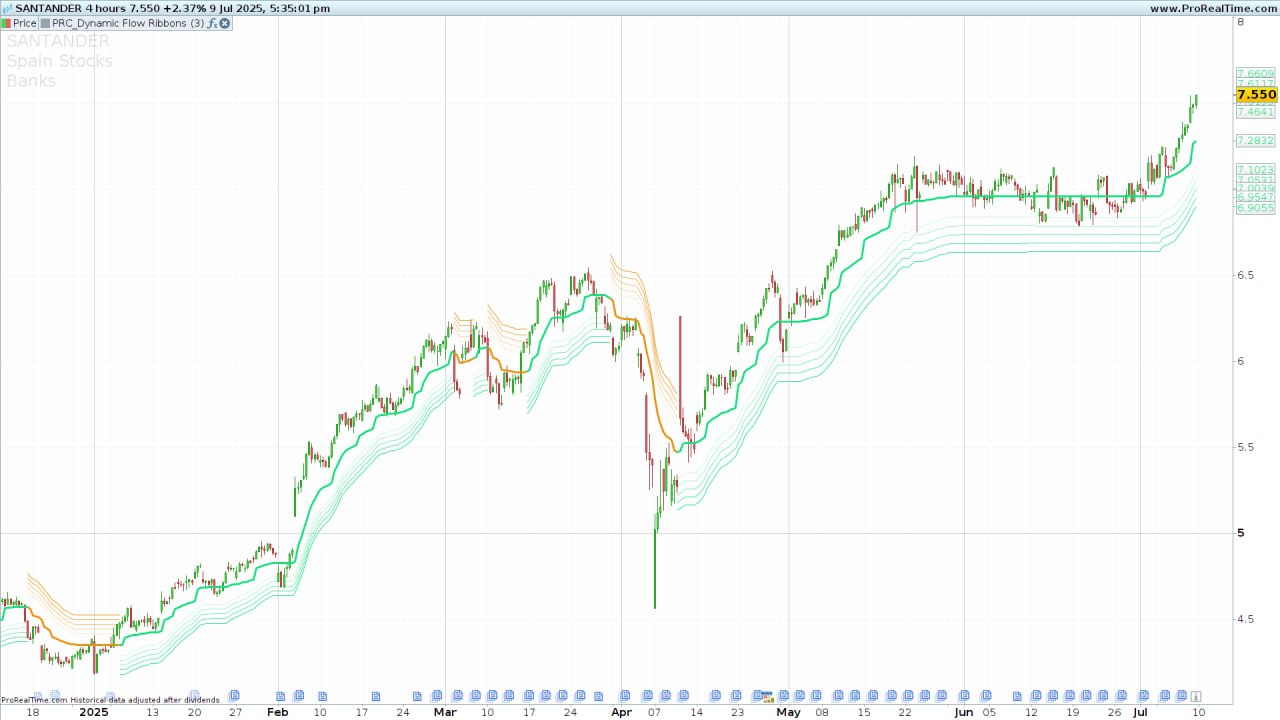
Dynamic Flow Ribbons is a trend-following ribbon indicator designed to visualize the evolving balance between bullish and bearish momentum (created by BigBeluga).
This tool overlays multiple dynamic bands (“ribbons”) around a central mid-line, adjusting their width based on recent price volatility. Traders use it to identify shifts in trend direction, confirm breakouts, and gauge strength of moves without relying solely on static moving averages.
2. Indicator Overview
At its core, Dynamic Flow Ribbons calculates a typical price (src) and a volatility measure (dist) over a long baseline.
It then constructs upper and lower bands offset from a short moving average of src by multiples of dist.
When price crosses or bends these bands, the indicator flips its “direction” state, altering ribbon coloration and the reference mid-line. This creates a flowing ribbon effect that dynamically expands and contracts as volatility changes.
3. Calculation and Internal Logic
-
Distance (
dist)-
Computed as a 200-period simple average of the true high–low range:
-
-
Source Price (
src)-
The typical price for each bar:
-
-
Dynamic Bands
-
Short moving average of
srcover 15 periods, offset byfactor × dist. -
Lower band initializes or follows its previous value depending on whether it tightens or price probes it.
-
Upper band follows analogous logic in the opposite direction.
-
-
Direction Determination
-
The indicator tracks a
directionstate (1for bullish,–1for bearish). -
When price exceeds the upper band, it flips to bearish (
–1); if it falls below the lower band, it flips to bullish (1).
-
-
Ribbon Construction
-
Five bands above and below the active trendline are drawn at increments of
dist × {–1.0, –0.5, 0, +0.5, +1.0}. -
The mid-line (
iline) is the simple average of upper and lower bands.
-
-
Color & Transparency
-
Ribbons adopt “up” or “down” RGB colors, with alpha transparency varying by band proximity to the mid-line.
-
When in a bullish state, the lower ribbons highlight in the “up” color; when bearish, the upper ribbons highlight in the “down” color.
-
4. Input Parameters
| Input Name | Default | Description |
|---|---|---|
| factor | 3 | Multiplier for volatility distance (dist). |
| RcolorUp | 26 | Red component of “up” color (0–255). |
| GcolorUp | 221 | Green component of “up” color (0–255). |
| BcolorUp | 127 | Blue component of “up” color (0–255). |
| RcolorDn | 231 | Red component of “down” color (0–255). |
| GcolorDn | 147 | Green component of “down” color (0–255). |
| BcolorDn | 20 | Blue component of “down” color (0–255). |
5. Recommended Configuration
-
Default Settings work well on higher-timeframe charts (H1 and above) for major FX pairs and stock indices.
-
Increasing
factorwidens the ribbons, reducing whipsaws in choppy markets—but can delay signals. -
Reducing
factortightens the ribbons, capturing earlier moves at the cost of more false signals. -
Color Customization: Choose contrasting RGB values to ensure visibility over your chart background.
6. Usage Examples
-
Bullish Signal: When the price closes above the upper band and ribbons flip color to the bearish palette, it indicates exhaustion of the upmove and potential reversal. A return into the ribbon zone can confirm the renewed uptrend.
-
Bearish Signal: Conversely, a close below the lower band turns ribbons into the bullish palette, suggesting a shift into bullish momentum once price re-enters.
-
Volatility Gauging: Ribbon width expansion signals rising volatility, hinting at a stronger trend continuation. Contraction warns of consolidation or imminent reversal.
Tip: Combine with volume filters or a momentum oscillator (e.g., RSI) to confirm the strength of the ribbon-based signals.
7. ProBuilder Code Placeholder
|
1 2 3 4 5 6 7 8 9 10 11 12 13 14 15 16 17 18 19 20 21 22 23 24 25 26 27 28 29 30 31 32 33 34 35 36 37 38 39 40 41 42 43 44 45 46 47 48 49 50 51 52 53 54 55 56 57 58 59 60 61 62 63 64 65 66 67 68 69 70 71 72 73 74 75 76 77 78 79 80 81 82 83 84 85 86 87 88 89 90 |
//---------------------------------------// //PRC_Dynamic Flow Ribbons by [BigBeluga] //version = 0 //10.07.25 //Iván González @ www.prorealcode.com //Sharing ProRealTime knowledge //---------------------------------------// // --- Inputs //---------------------------------------// factor=3 // Length RcolorUp=26 GcolorUp=221 BcolorUp=127 RcolorDn=231 GcolorDn=147 BcolorDn=20 //---------------------------------------// // --- Calculations //---------------------------------------// dist = average[200,0](high-low) src=(high+low+close)/3 once direction=1 if barindex>=200 then lowerband=average[15,1](src)-factor*dist if lowerband>lowerband[1] or src[1]<lowerband[1] then lowerband=average[15,1](src)-factor*dist else lowerband=lowerband[1] endif upperband=average[15,1](src)+factor*dist If upperband<upperband[1] or src[1]>upperband[1] then upperband=average[15,1](src)+factor*dist else upperband=upperband[1] endif if trendline[1]=upperband[1] then if src>upperband then direction=-1 else direction=1 endif else if src<lowerband then direction=1 else direction=-1 endif endif if direction=-1 then trendline=lowerband r=rcolorUp g=gcolorUp b=bcolorUp alu=0 alw=1 else trendline=upperband r=rcolorDn g=gcolorDn b=bcolorDn alu=1 alw=0 endif iline=(lowerband+upperband)/2 alpha=255 else upperband=src lowerband=src iline=src alpha=0 endif //---------------------------------------// // --- Ribbons //---------------------------------------// upperband1=upperband-dist upperband2=upperband-dist*0.5 upperband3=upperband upperband4=upperband+dist*0.5 upperband5=upperband+dist lowerband1=lowerband+dist lowerband2=lowerband+dist*0.5 lowerband3=lowerband lowerband4=lowerband-dist*0.5 lowerband5=lowerband-dist //---------------------------------------// return iline coloured(r,g,b,alpha)style(line,3),upperband1 coloured(r,g,b,alpha*alu*0.2)style(line,1),upperband2 coloured(r,g,b,alpha*alu*0.4)style(line,1),upperband3 coloured(r,g,b,alpha*alu*0.6)style(line,1),upperband4 coloured(r,g,b,alpha*alu*0.8)style(line,1),upperband5 coloured(r,g,b,alpha*alu)style(line,1), lowerband1 coloured(r,g,b,alpha*alw*0.2)style(line,1), lowerband2 coloured(r,g,b,alpha*alw*0.4)style(line,1),lowerband3 coloured(r,g,b,alpha*alw*0.6)style(line,1),lowerband4 coloured(r,g,b,alpha*alw*0.8)style(line,1),lowerband5 coloured(r,g,b,alpha*alw)style(line,1) |
Share this
No information on this site is investment advice or a solicitation to buy or sell any financial instrument. Past performance is not indicative of future results. Trading may expose you to risk of loss greater than your deposits and is only suitable for experienced investors who have sufficient financial means to bear such risk.
ProRealTime ITF files and other attachments :
Find other exclusive trading pro-tools on ![]()
PRC is also on YouTube, subscribe to our channel for exclusive content and tutorials