1. Introduction to the Indicator
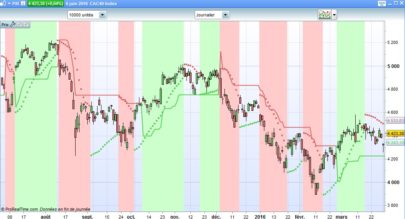
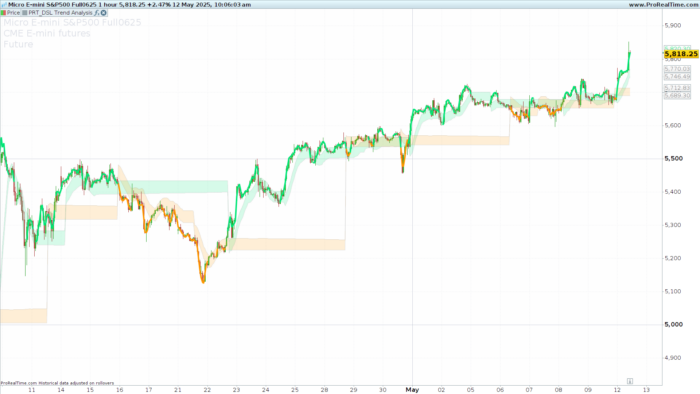
The DSL Trend Analysis indicator is designed as a visual tool to clearly identify trend changes in financial markets. It focuses on the analysis of dynamic support and resistance levels that adjust automatically to price behavior. Through a system of bands and a trendline calculated using linear regression, this indicator helps traders detect areas of buying or selling pressure and anticipate potential trend reversals.
Unlike traditional trend indicators such as simple moving averages, DSL Trend Analysis introduces the logic of historical thresholds to generate visual signals when price breaks key levels. Its implementation emphasizes not just recent data, but also comparisons with past levels, offering a more robust and less noisy perspective.
The result is a graphical representation highlighting key zones with shaded bands and a trendline whose color reflects the strength of price movement. This makes it a valuable tool for both trend-following and reversal trading strategies.
2. Indicator Foundation
The core of the DSL Trend Analysis consists of three main components: the Simple Moving Average (SMA), the Highest High Value (HHV), and the Lowest Low Value (LLV) over a configurable period (len, default 10). These are calculated to establish dynamic reference levels.
The logic is activated using the offset parameter, which introduces a time delay in evaluating price extremes. This allows for comparison of the current price with highs and lows from several bars ago, offering a clearer retrospective view and avoiding false signals caused by recent fluctuations.
The thresholds derived from these values (thresholdUp and thresholdDn) act as triggers for DSL levels:
-
If the current close is higher than the delayed high, a DSL Up level is plotted at the SMA value.
-
If the close is lower than the delayed low, a DSL Down level is plotted at the SMA value.
This logic ensures the indicator reacts to meaningful breakouts while filtering out market noise.
3. DSL Band Calculation
Once the primary DSL levels (dslUp and dslDn) are identified, the indicator draws two additional bands to define a visual buffer zone. These bands use the 200-period Average True Range (ATR), adapting their width to market volatility.
The width parameter multiplies the ATR value to scale the bands’ spacing. Higher values widen the bands, suitable for volatile markets.
The bands are defined as follows:
-
DSL Upper Band:
dslUp1 = dslUp - ATR -
DSL Lower Band:
dslDn1 = dslDn + ATR
These bands act not as direct signals but as transition zones, helping traders spot areas where price may react before confirming a trend change.
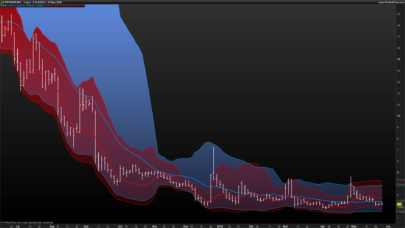
4. Dynamic Visualization and Coloring
A distinctive feature of DSL Trend Analysis is its advanced visual representation using shaded zones. This is achieved with the colorbetween function, which fills the area between the DSL levels and their corresponding bands.
Once enough bars have accumulated (more than 200, required for ATR calculation), the following zones are drawn:
-
Upper Zone (between
dslUpanddslUp1): Light green, indicating bullish pressure. -
Lower Zone (between
dslDnanddslDn1): Orange, indicating bearish pressure.
These visual zones provide quick context:
-
A green area above price may act as dynamic resistance.
-
An orange area below price may act as dynamic support.
Though not direct signals, they offer valuable information about the current market structure.
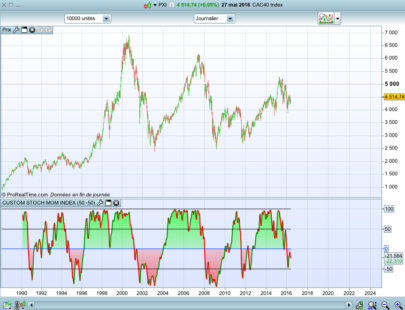
5. Trend Line Based on Linear Regression
In addition to the DSL bands, the indicator features a TrendLine calculated using a 5-period linear regression of the closing price. This line reflects the short-term direction of the price and updates dynamically.
What makes it powerful is its adaptive coloring system:
-
Bright green (opacity 255): Price breaks above
dslUp– strong bullish momentum. -
Bright orange (opacity 255): Price breaks below
dslDn– strong bearish momentum. -
Soft green (opacity 60): Price between
dslUp1anddslUp– potential bullish continuation. -
Soft orange (opacity 60): Price between
dslDnanddslDn1– potential bearish continuation. -
Transparent (opacity 0): Price not in any significant zone.
This system transforms the trendline into a visual guide, helping to assess the market’s strength and direction at a glance.
6. Indicator Settings
The DSL Trend Analysis includes three configurable parameters to adapt it to various trading styles and market conditions:
-
len(Length)
Default:10
Defines the number of bars for SMA, HHV, and LLV.-
Lower values = more responsive (for scalping/intraday).
-
Higher values = smoother (for swing or longer-term analysis).
-
-
offset(Threshold delay)
Default:30
Controls how far back the highs/lows are checked for thresholds.-
Higher values = more conservative signals.
-
-
width(Band width factor)
Default:1
Multiplies the ATR to set the width of the DSL bands.-
Higher values = wider buffer zones (useful in volatile conditions).
-
These options allow traders to fine-tune the indicator for optimal responsiveness and clarity.
7. Conclusion
The DSL Trend Analysis is a visually rich indicator that combines dynamic level analysis, volatility-based banding, and an adaptive trendline using linear regression. It provides clear insight into support/resistance zones and trend direction, helping traders stay aligned with market momentum or spot potential reversals.
Its flexible settings and intuitive design make it suitable for a wide range of trading approaches, from short-term intraday setups to longer-term strategic entries. Whether used alone or as part of a more complex system, this indicator delivers clarity and precision to market analysis.
8. Code
|
1 2 3 4 5 6 7 8 9 10 11 12 13 14 15 16 17 18 19 20 21 22 23 24 25 26 27 28 29 30 31 32 33 34 35 36 37 38 39 40 41 42 43 44 45 46 47 48 49 50 51 52 53 54 55 56 57 58 59 60 61 62 63 64 65 66 67 68 69 70 71 72 73 74 75 76 77 78 79 |
//--------------------------------------------------// // PRT_DSL Trend Analysis //version = 0 //12.05.2025 //Sharing ProRealTime knowledge //--------------------------------------------------// // Inputs //--------------------------------------------------// len=10 offset=30 width=1 //--------------------------------------------------// // Get DSL values //--------------------------------------------------// sma=average[len](close) hhv=highest[len](high) llv=lowest[len](low) thresholdUp=hhv[offset] thresholdDn=llv[offset] if close>thresholdUp then dslUp=sma endif if close<thresholdDn then dslDn=sma endif //--------------------------------------------------// // Calculate bands //--------------------------------------------------// atr=averagetruerange[200](close)*width dslUp1=dslUp-atr dslDn1=dslDn+atr //--------------------------------------------------// // Color between bands //--------------------------------------------------// if barindex<=200 then linreg=undefined dslUp=undefined dslUp1=undefined dslDn=undefined dslDn1=undefined else colorbetween(dslUp,dslUp1,0,230,118,40) colorbetween(dslDn,dslDn1,255,152,0,40) //--------------------------------------------------// // Trend Line and color //--------------------------------------------------// //---Trend line calculation linreg=LinearRegression[5](close) //---Color definition if high>dslUp1 and high<dslUp and high>dsldn1 then r=0 g=230 b=118 a=60 elsif low>dsldn and low<dsldn1 then r=255 g=152 b=0 a=60 elsif high>dslUp then r=0 g=230 b=118 a=255 elsif low <dsldn then r=255 g=152 b=0 a=255 else a=0 endif endif //--------------------------------------------------// return linreg as "TrendLine" coloured(r,g,b,a)style(line,4),dslUp as "DSL Up"coloured("grey",60)style(line,1), dslDn as "DSL Down"coloured("grey",60)style(line,1), dslUp1 as "DSL Upper Band"coloured("grey",60)style(line,1), dsldn1 as "DSL Lower band"coloured("grey",60)style(line,1) |
Share this
No information on this site is investment advice or a solicitation to buy or sell any financial instrument. Past performance is not indicative of future results. Trading may expose you to risk of loss greater than your deposits and is only suitable for experienced investors who have sufficient financial means to bear such risk.
ProRealTime ITF files and other attachments :
Find other exclusive trading pro-tools on ![]()
PRC is also on YouTube, subscribe to our channel for exclusive content and tutorials