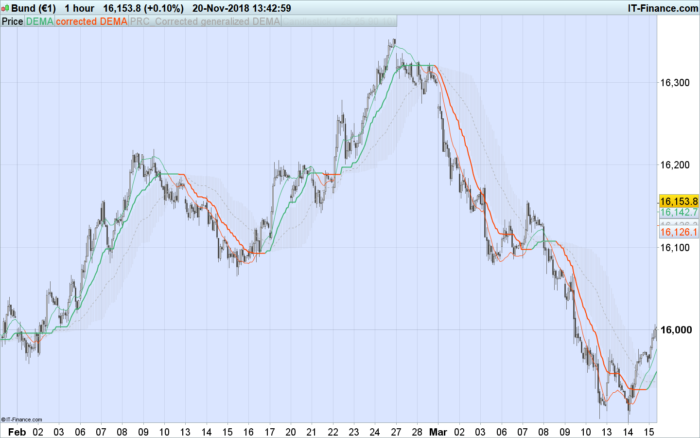
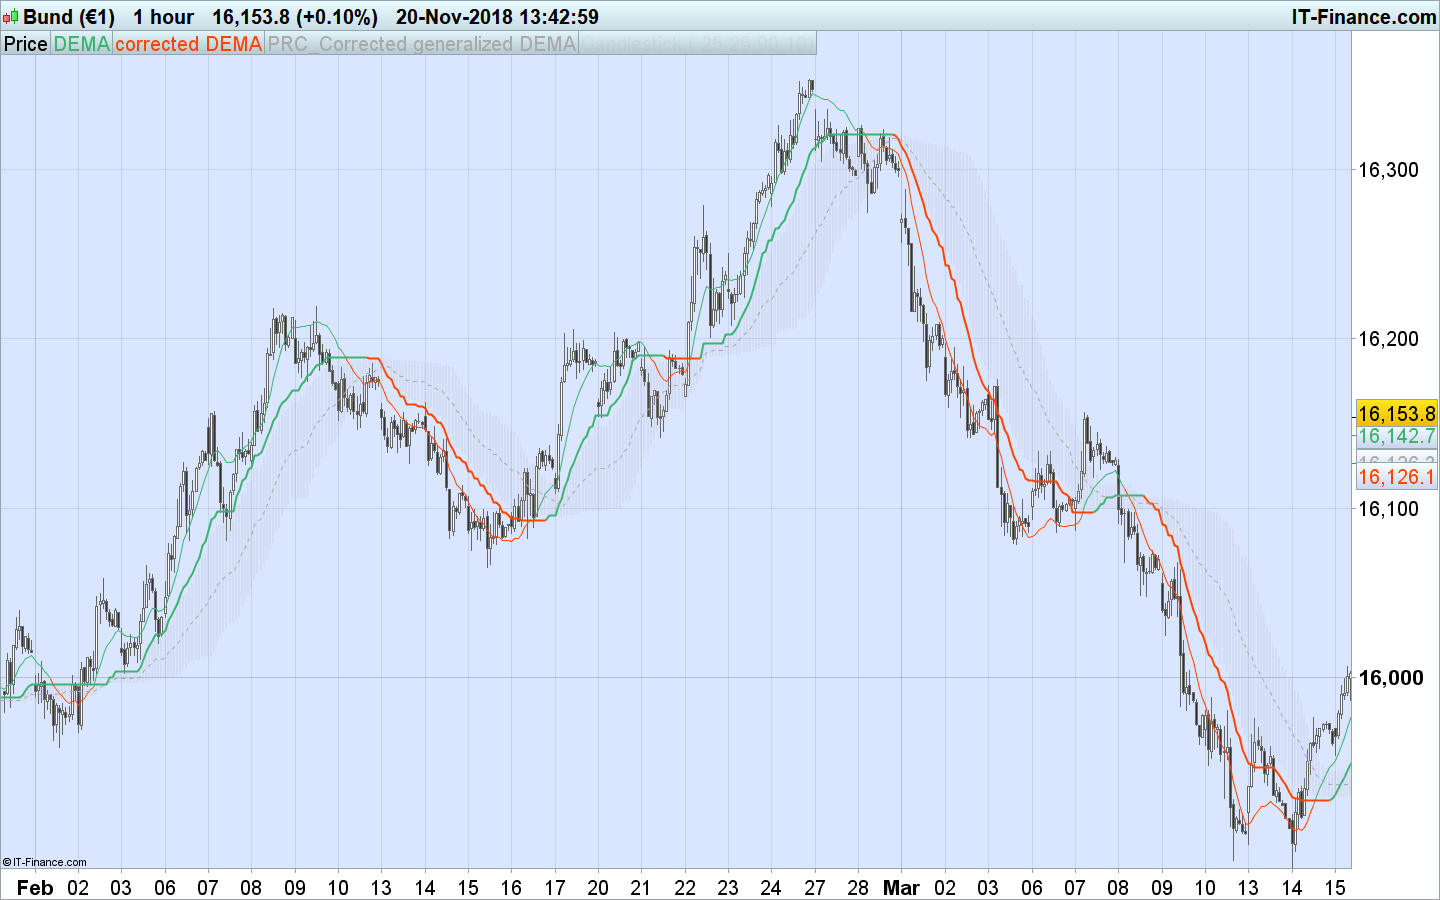
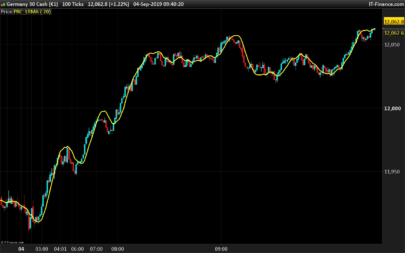
DEMA average is a double Exponential Moving Average. It was created to reduce the amount of lag time found in traditional moving averages. It was first released in the February 1994 TASC magazine.
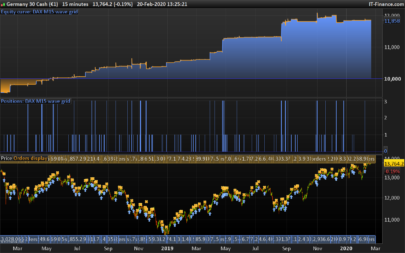
This version embed the corrected function, it measures deviations of the DEMA values, if the changes are not significant, then the value is “flattened”.
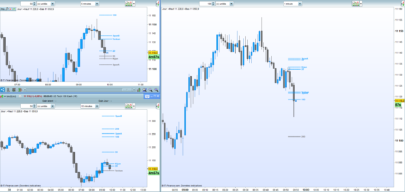
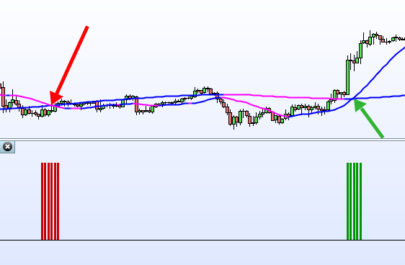
It also includes the floating levels functionality (2 levels based on recent highest high and lowest low of the corrected curve).
The DEMA and corrected DEMA change color following these criteria:
- color change on slope change
- color change on outer (floating) levels cross
- color change on middle (floating) level cross
- color change on average (DEMA) value cross
|
1 2 3 4 5 6 7 8 9 10 11 12 13 14 15 16 17 18 19 20 21 22 23 24 25 26 27 28 29 30 31 32 33 34 35 36 37 38 39 40 41 42 43 44 45 46 47 48 49 50 51 52 53 54 55 56 57 58 59 60 61 62 63 64 65 66 |
//PRC_Corrected generalized DEMA | indicator //20.11.2018 //Nicolas @ www.prorealcode.com //Sharing ProRealTime knowledge //original idea from mladen (MT5 indi) // --- settings inpPeriod = 25 // Period inpFlPeriod = 25 // Floating levels period inpFlUp = 90 // Upper level % inpFlDown = 10 // Lower level % // --- end of settings // DEMA Series = customclose // Price Period = MAX(inpPeriod, 1) if barindex>Period*2 then avg = DEMA[Period](Series) //Corrected function n = Period SA = avg v1 = SQUARE(STD[n](Series)) v2 = SQUARE(CA[1]-SA) if(v2<v1) then k=0 else k=1-v1/v2 CA=CA[1]+K*(SA-CA[1]) endif //colors if CA>CA[1] then r=60 g=179 b=113 elsif CA<CA[1] then r=255 g=69 b=0 endif if avg>CA then ravg=60 gavg=179 bavg=113 elsif avg<CA then ravg=255 gavg=69 bavg=0 endif imin = lowest[inpFlPeriod](CA) imax = highest[inpFlPeriod](CA) rrange = imax-imin flup = imin+inpFlUp*rrange/100.0 fldn = imin+inpFlDown*rrange/100.0 flmi = imin+50*rrange/100.0 drawcandle(flup,fldn,flup,fldn) coloured(169,169,169,40) bordercolor(169,169,169,0) endif return avg coloured(ravg,gavg,bavg) style(line,1) as "DEMA", ca coloured(r,g,b) style(line,2) as "corrected DEMA", flmi coloured(169,169,169) style(dottedline) |
Share this
No information on this site is investment advice or a solicitation to buy or sell any financial instrument. Past performance is not indicative of future results. Trading may expose you to risk of loss greater than your deposits and is only suitable for experienced investors who have sufficient financial means to bear such risk.
ProRealTime ITF files and other attachments :
Find other exclusive trading pro-tools on ![]()
PRC is also on YouTube, subscribe to our channel for exclusive content and tutorials


Nicolas,
could you explain why you have used 4 numbers to draw the candle ? First 3 defines the color ? true ?, what does the fourth mean ?
drawcandle(flup,fldn,flup,fldn) coloured(169,169,169,40) bordercolor(169,169,169,0)
Thanks in advance, Jan
Alpha transparency from 0 to 255.
I like the principles behind this indicator.
I prefer to use the TEMA instead of the DEMA. So therefore I adjust the word “DEMA”, used only once at line 20, for “TEMA”. This works only if you also adjust line 18 in the code “if barindex>Period*2 then” to ” if barindex>Period*3 then”, as the TEMA uses a triple moving average instead of double moving average with DEMA.
Hi, Sir can you tell me how to put this code in indicator plz
Ehtsham,
all you need to do is change the code in line 18 and line 20 (see the code above from Nicolas)
ORIGINAL CODE
18. if barindex>Period*2 then
19
20 avg = DEMA[Period](Series)
ADJUSTED CODE (change 2 to 3 in line 18 and change DEMA to TEMA in line 20)
18. if barindex>Period*3 then
19
20 avg = TEMA[Period](Series)
KR Jan
Dear sir , thank you very much for sharing !!!! it is awesome …!!!
Please can you tell me what i have to do ( add/change) in order to coloured and make more visible that grey histogram in the indicator ?
Many thanks !!!!
Best Regards
Dimitris
Change line 62 with: drawcandle(flup,fldn,flup,fldn) coloured(169,169,169,80) bordercolor(169,169,169,0)
Thank you very much from Greece sir , have a nice day ….!!!!
Really i do not have words to thank you enough !!!
Best Regards
Dimitris
Bonjour,
J’ai d’excellents résultats avec cet indicateur simple et efficace;
Merci beaucoup;