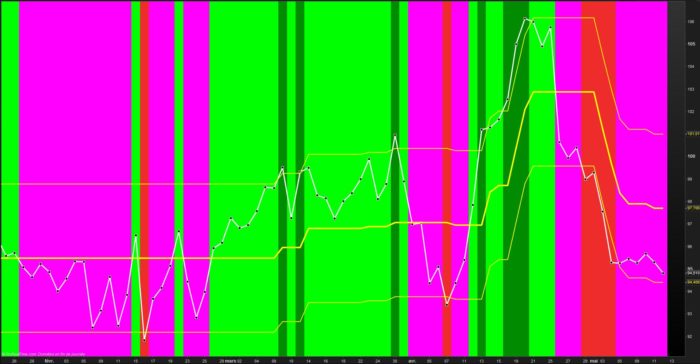
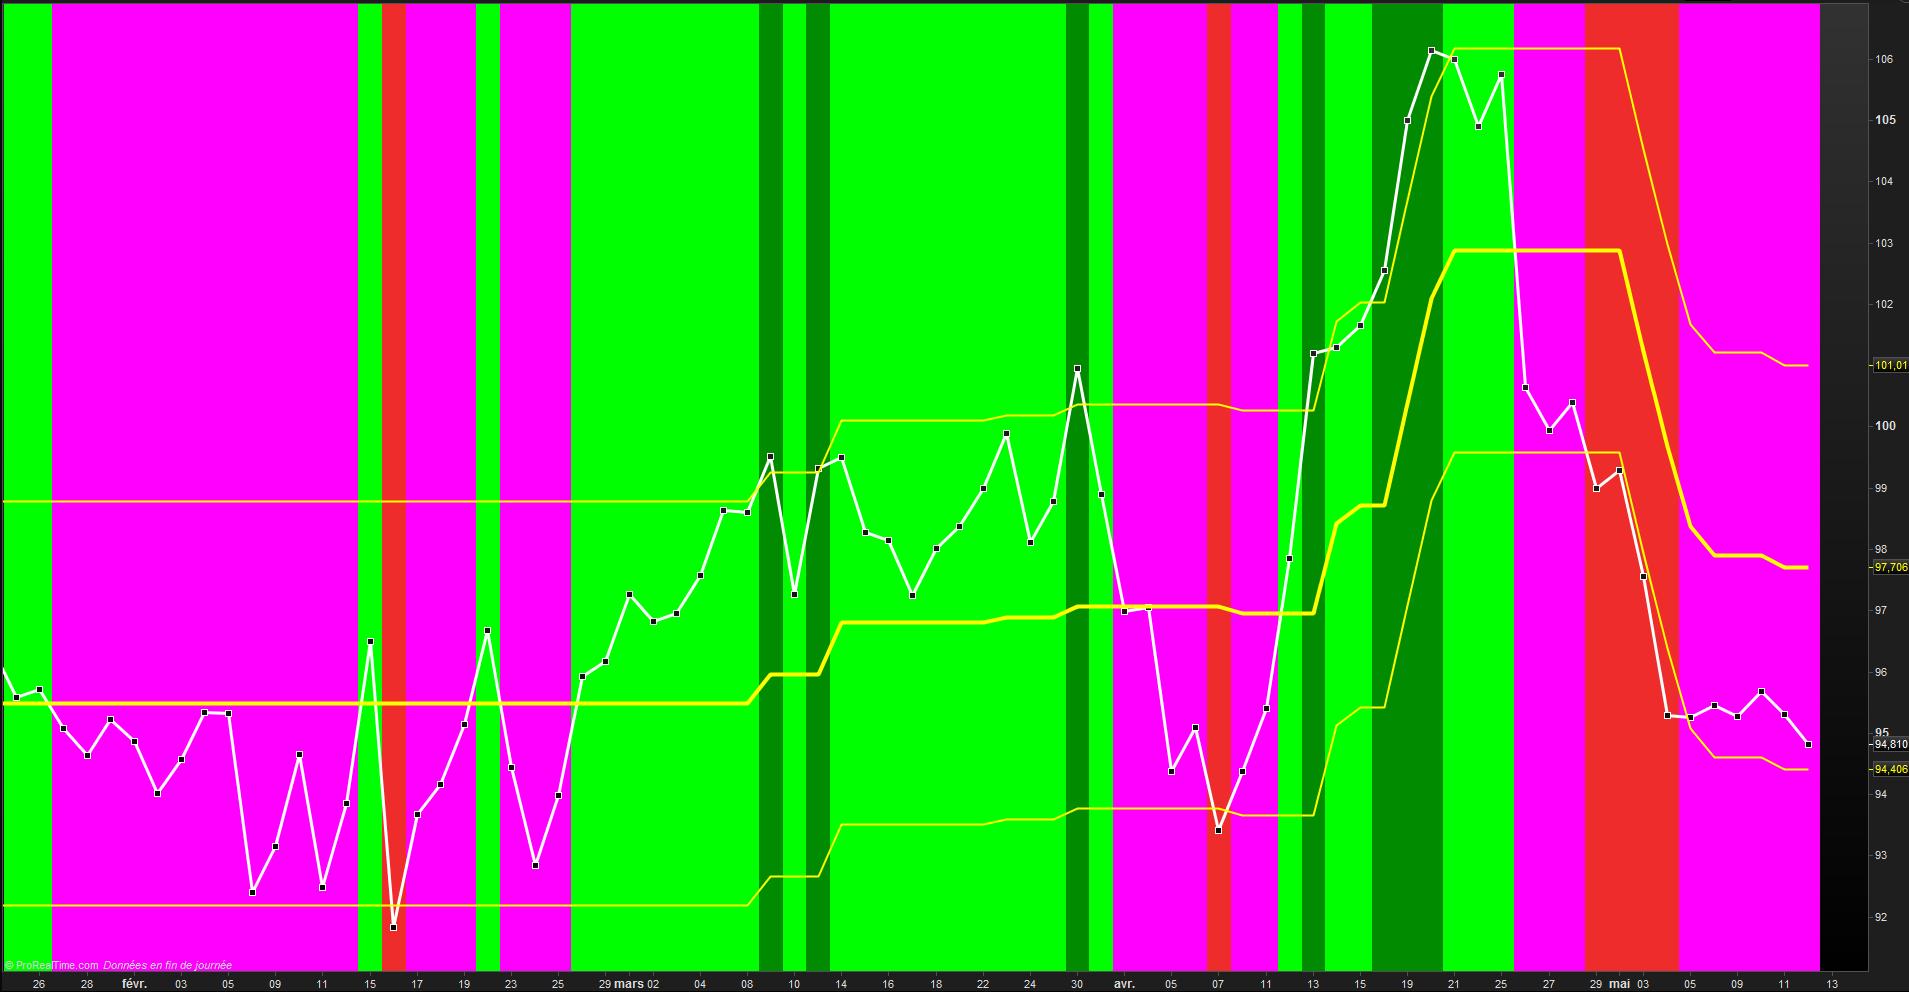
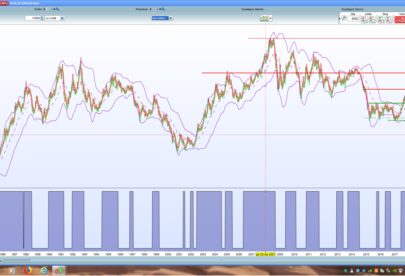
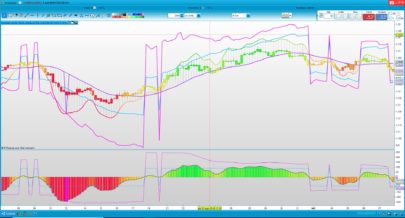
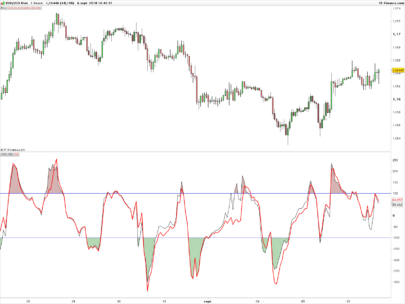
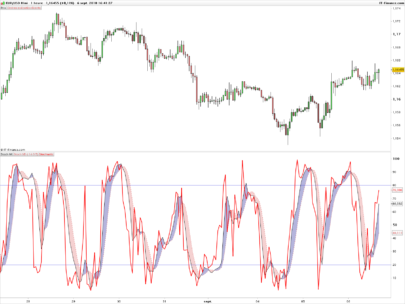
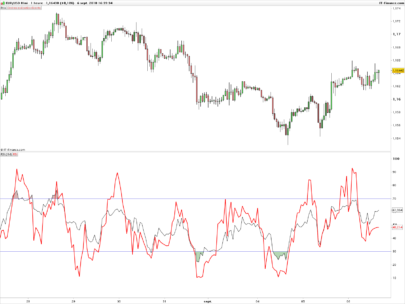
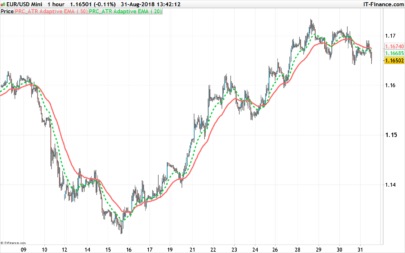
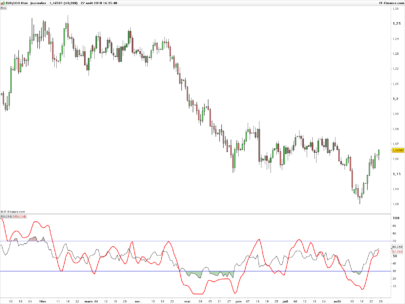
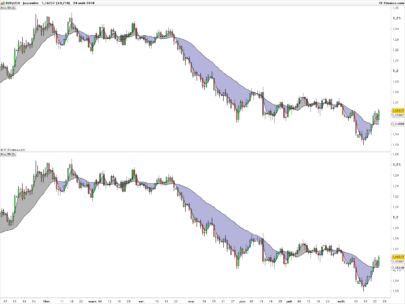
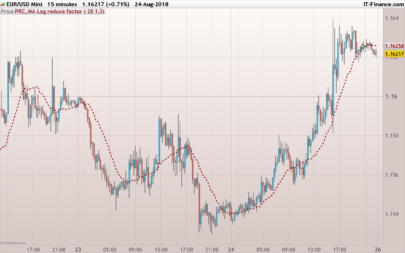
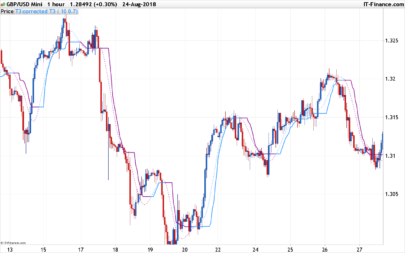
This indicator add a trend line on chart accordingly to the CCI value. It also painting background charts to identify bearish and bullish trend.
|
1 2 3 4 5 6 7 8 9 10 11 12 13 14 15 16 17 18 19 20 21 22 23 24 25 26 27 28 29 30 31 32 33 34 35 36 37 38 39 40 41 |
// CCI Magic DID V1 cc = customclose if (CCI[p](typicalPrice)>=0) then magic=Low[0]-AverageTrueRange[p1](close) endif if (CCI[p](typicalPrice)<0) then magic=High[0]+AverageTrueRange[p1](close) endif if (CCI[p](typicalPrice)>=0 and magic<magic[1]) then magic=magic[1] endif if (CCI[50](typicalPrice)<0 and magic>magic[1]) then magic=magic[1] endif hh = magic + coeff bb = magic - coeff //////////////////////////////////////////////// if cc > hh then backgroundcolor(0,139,0) // vert foncé endif if cc > magic and cc < hh then backgroundcolor(0,255,0) // vert clair endif if cc < magic and cc > bb then backgroundcolor(255,0,255) // rose clair endif if cc < bb then backgroundcolor(238,44,44) // rouge endif //////////////////////////////////////////////// return cc as " cc " , magic as " magic " , hh as " hh " , bb as " bb " // Variables : // p = 50 = periode CCI par défaut // p1 = 5 = periode ATR par défaut // coeff = 1 decimal |
Share this
No information on this site is investment advice or a solicitation to buy or sell any financial instrument. Past performance is not indicative of future results. Trading may expose you to risk of loss greater than your deposits and is only suitable for experienced investors who have sufficient financial means to bear such risk.
ProRealTime ITF files and other attachments :
Find other exclusive trading pro-tools on ![]()
PRC is also on YouTube, subscribe to our channel for exclusive content and tutorials


Lo instalo con el archivo y me da errores de síntaxis. A ver, si por favor, lo podéis arreglar. Saludos
Hola Angel,
No hay problema con el codigo. Lo comprobado hoy con el codigo de la patalla y el fechero .itf. El problema viene de ti.
un saludo
Didier
pues no sé. Lo instalo con el fichero que adjuntas y me da errores de sintaxi.
en la beta 10.3 de prorealtime no me da problemas. Todo muy raro.
podrías por favor desarrollar un poco más la idea de este indicador.
Primero tienes que leer un poco el manual de probuilder. aqui tienes las respuestas. el trading es ante todo un trabajo ! la 10.2 vs la 10.3 no es lo mismo !!
saludos
pues lo leeré. Tienes razón esto de la bolsa es un trabajo.
Lo estoy probando con tu indicador y en velas semanales el Santander es alcista. Veremos como evoluciona la semana que viene. Saludos y gracias por contestarme tan rápido.
Hola Angel
Las funciones backgroundcolor etc etc no funcionan con la version 10.2.
Para saber mas sobre la 10.3 tu tienes un resumen muy completo de Nicolas dentro de ” documentacion” and ” graphical “
ok
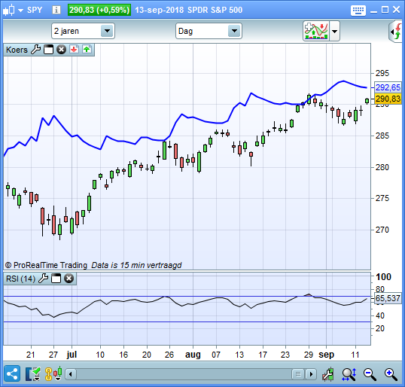
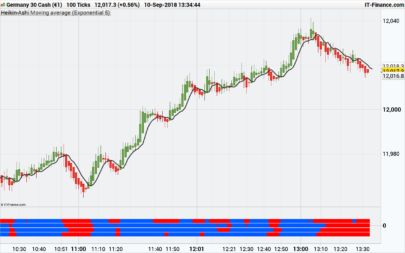
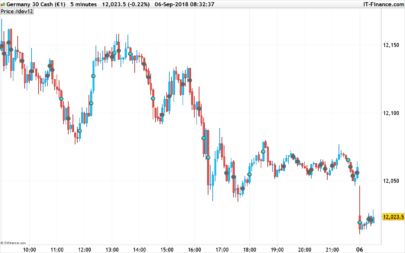
It may be a little late in the day, but having only just discovered this utility, I have messed around with various time frames and found that on the longer term Daily and Weekly chart, the tracking is quite clear, however on the very short term frames, it is necessary to experiment until a workable match is found by comparing with other indicators that might show the same trend characteristics. Thank you