

BYP Supports Resistances
1 —– Introduction —–
Prices are always the result of a struggle between Buyers and Sellers. When one side leads, we are in a trend, and then it’s time to take profits. An equilibrium point is then reached, before the trend reverses. Every trader in the world sees these peaks and troughs, which materialize large liquidity outflows and serve as references for tracing Supports and Resistances.
2 —– Concept —–
I wanted a flexible tool for scalping – but it works on all Time Units – allowing you to
and display the most relevant Supports and Resistances very quickly.
Placed on the current candle, we look back and point to all the visible Peaks and Dips which
which will identify active Supports and Resistances. We’re not interested in what lies beyond!
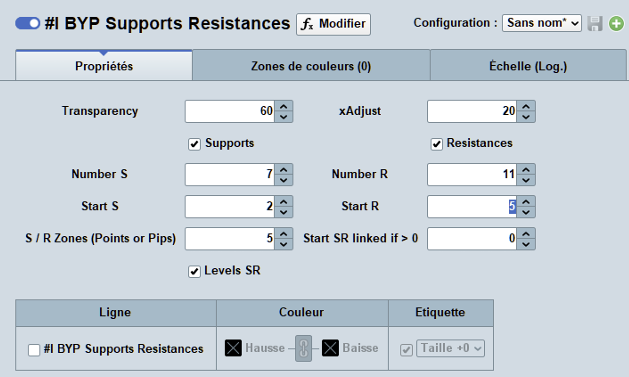
3 —– Fonctionnement et paramètres —–
- Number S or R: Selects the number of Supports (or Resistors) to be displayed, theoretically unlimited.
- Start S or R : Selects the first Support (or Resistance) to be displayed.
- S/R Zones (Points or Pips): Displays a Support (or Resistance) zone of influence.
- Start SR linked if > 0: This parameter – positive – links Support/Resistance of the same index. 0 by default. For example, to identify a single channel. S3-R3.
- Levels SR: Displays or not Supports (or Resistors) information. For example: S2 3320.56 -130.80 -3.77% 55 UT
Support index / Price / Absolute variation and Variation% relative to Close / Support duration - xAdjust: Information display margin. 20 by default.
- a : Transparency: Transparency of SR influence zones.
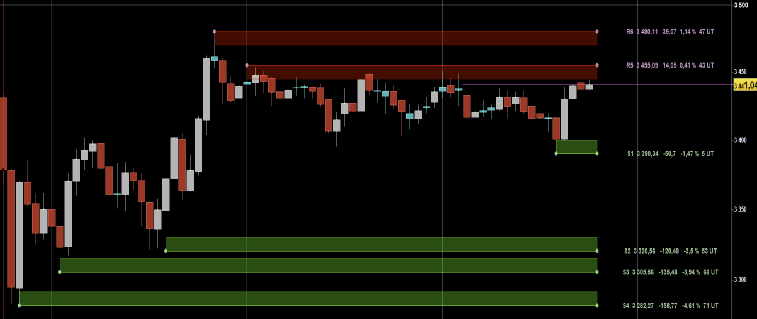
4 —– Graphics —–
Standard representation: Green supports and red resistances. Zones of influence dimmed.
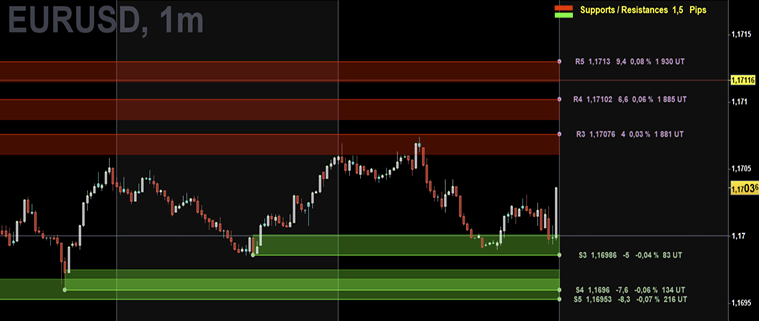
A commented symbol in the top right-hand corner of the screen indicates the number of Points or Pips chosen for the width of the
zones. Useful for getting an immediate idea of the price scale when juggling several market instruments.
5 —– Code —–
I don’t speak English, but I’ve commented all the code in English to make it more user-friendly.
Please bear with me if the translations are not always accurate.
6 —– Proof-of-concept —–
– Example 1: Free choice of first Support and Resistance. S1 – R5
– Example 2: Choice of linked resistance support. S3 – R3
Good trades to all.
//======================================================================================================================
// ProRealTime V12 / Partage des connaissances ProRealTime. / Sharing ProRealTime knowledge.
// 2025 09 26 18:25 // 2025 08 16 00:13
// by Bernard13 "BYP"

//======================================================================================================================
//                              #I BYP Supports Résistances
//======================================================================================================================
DEFPARAM DrawOnlastBarOnly= True // Force the graph to the right

Margin= 1 // Margin of the segment, point, rectangle.

//======================================================================================================================
//                             POINTS / PIPS
DrawText("▀▀", -310, -16, Dialog, Bold, 18) Coloured("Red") Anchor(TopRight)
DrawText("▄▄", -310, -20, Dialog, Bold, 18) Coloured("Lime") Anchor(TopRight)
IF PipSize = 0.0001 THEN
DrawText("Supports / Resistances  #Zone# Pips", -150, -20, Dialog, Bold, 16) Coloured("Aqua") Anchor(TopRight)
ELSE
DrawText("Supports / Resistances  #Zone# Points", -150, -20, Dialog, Bold, 16) Coloured("Yellow") Anchor(TopRight)
ENDIF

//===================================================================================================================
//                           SUPPORTS RESISTANCES LINKED
//===================================================================================================================
IF NumRS > 0 THEN //----- Linked S/R pairs (S1/R1, S2/R2, S3/R3, ...)
StartR= NumRS
StartS= NumRS
ELSE // Free (S2, R5, S6, R3, ...)
NumRS= 0
ENDIF

//===================================================================================================================
//                           RESISTANCES
//===================================================================================================================
IF Resistances THEN
goUp= High[1] >= High
i= 0

//----- Start Résistance
FOR r= 1 TO StartR DO // Search for the first selected resistance level
y= High[i]
WHILE High[i+1] <= y DO // Not below the highest point
i= i + 1
WEND
WHILE goUp[i] DO // Highest point above
i= i + 1
WEND
NEXT
StartR= r - 1 // First resistance level selected

//----- All Résistances
FOR NumR= StartR TO NumberR DO
y= High[i]
dy= y - Zone * PipSize
var= y - Close
varpc= ROUND((var / close * 100), 2)
IF PipSize = 0.0001 THEN // In Pips, not in Points
var= (y - Close) / PipSize
ENDIF

//----- Display Résistance
DrawPoint(BarIndex[i], y, 2) Coloured(200,150,200)
DrawPoint(BarIndex+Margin, y, 2) Coloured(200,150,200)
DrawSegment(BarIndex[i], y, Barindex+Margin, y) Coloured(255,0,0)
DrawRectangle(BarIndex[i], y, BarIndex+Margin, dy) Coloured(255,0,0,a) BorderColor(255,0,0,a)
IF LevelsSR THEN // Optional information
i= i + 1
DrawText("R#NumR# #y#  #var# #varpc#%  #i#UT", BarIndex+xAdjust, y, Dialog, Bold, 14) Coloured(200,150,200)
ENDIF

//----- Next Résistance
WHILE High[i] <= y DO // Not below the highest pont
i= i + 1
WEND
WHILE goUp[i] DO // Highest point above
i= i + 1
WEND
NEXT //... NumR

ENDIF //... Resistances

//===================================================================================================================
//                           SUPPORTS
//===================================================================================================================
IF Supports THEN
goDown= Low[1] <= Low
i= 0

//----- Start Support
FOR s= 1 TO StartS DO // Search for the first selected support level
y= Low[i]
WHILE Low[i+1] >= y DO // Not above the lowest point
i= i + 1
WEND
WHILE goDown[i] DO // Lowest point below
i= i + 1
WEND
NEXT
StartS= s - 1

//----- All Supports
FOR NumS= StartS TO NumberS DO
y= Low[i]
dy= y + Zone * PipSize
var= y - Close
varpc= ROUND((var / close * 100), 2)
IF PipSize = 0.0001 THEN // In Pips, not in Points
var= (y - Close) / PipSize
ENDIF

//----- Display Support
DrawPoint(BarIndex[i], y, 2) Coloured(150,200,150)
DrawPoint(BarIndex+Margin, y, 2) Coloured(150,200,150)
DrawSegment(BarIndex[i], y, Barindex+Margin, y) Coloured(0,255,0)
DrawRectangle(BarIndex[i], y, BarIndex+Margin, dy) Coloured(0,255,0,a) BorderColor(0,255,0,a)
IF LevelsSR THEN // Optional information
i= i + 1
DrawText("S#NumS# #y#  #var#  #varpc#%  #i#UT", BarIndex+xAdjust, y, Dialog, Bold, 14) Coloured(150,200,150)
ENDIF

//----- Next Support
WHILE Low[i] >= y DO // Not above the lowest point
i= i + 1
WEND
WHILE goDown[i] DO // Lowest point below
i= i + 1
WEND
NEXT //---NumS

ENDIF //---Supports

//======================================================================================================================
RETURN
//======================================================================================================================