
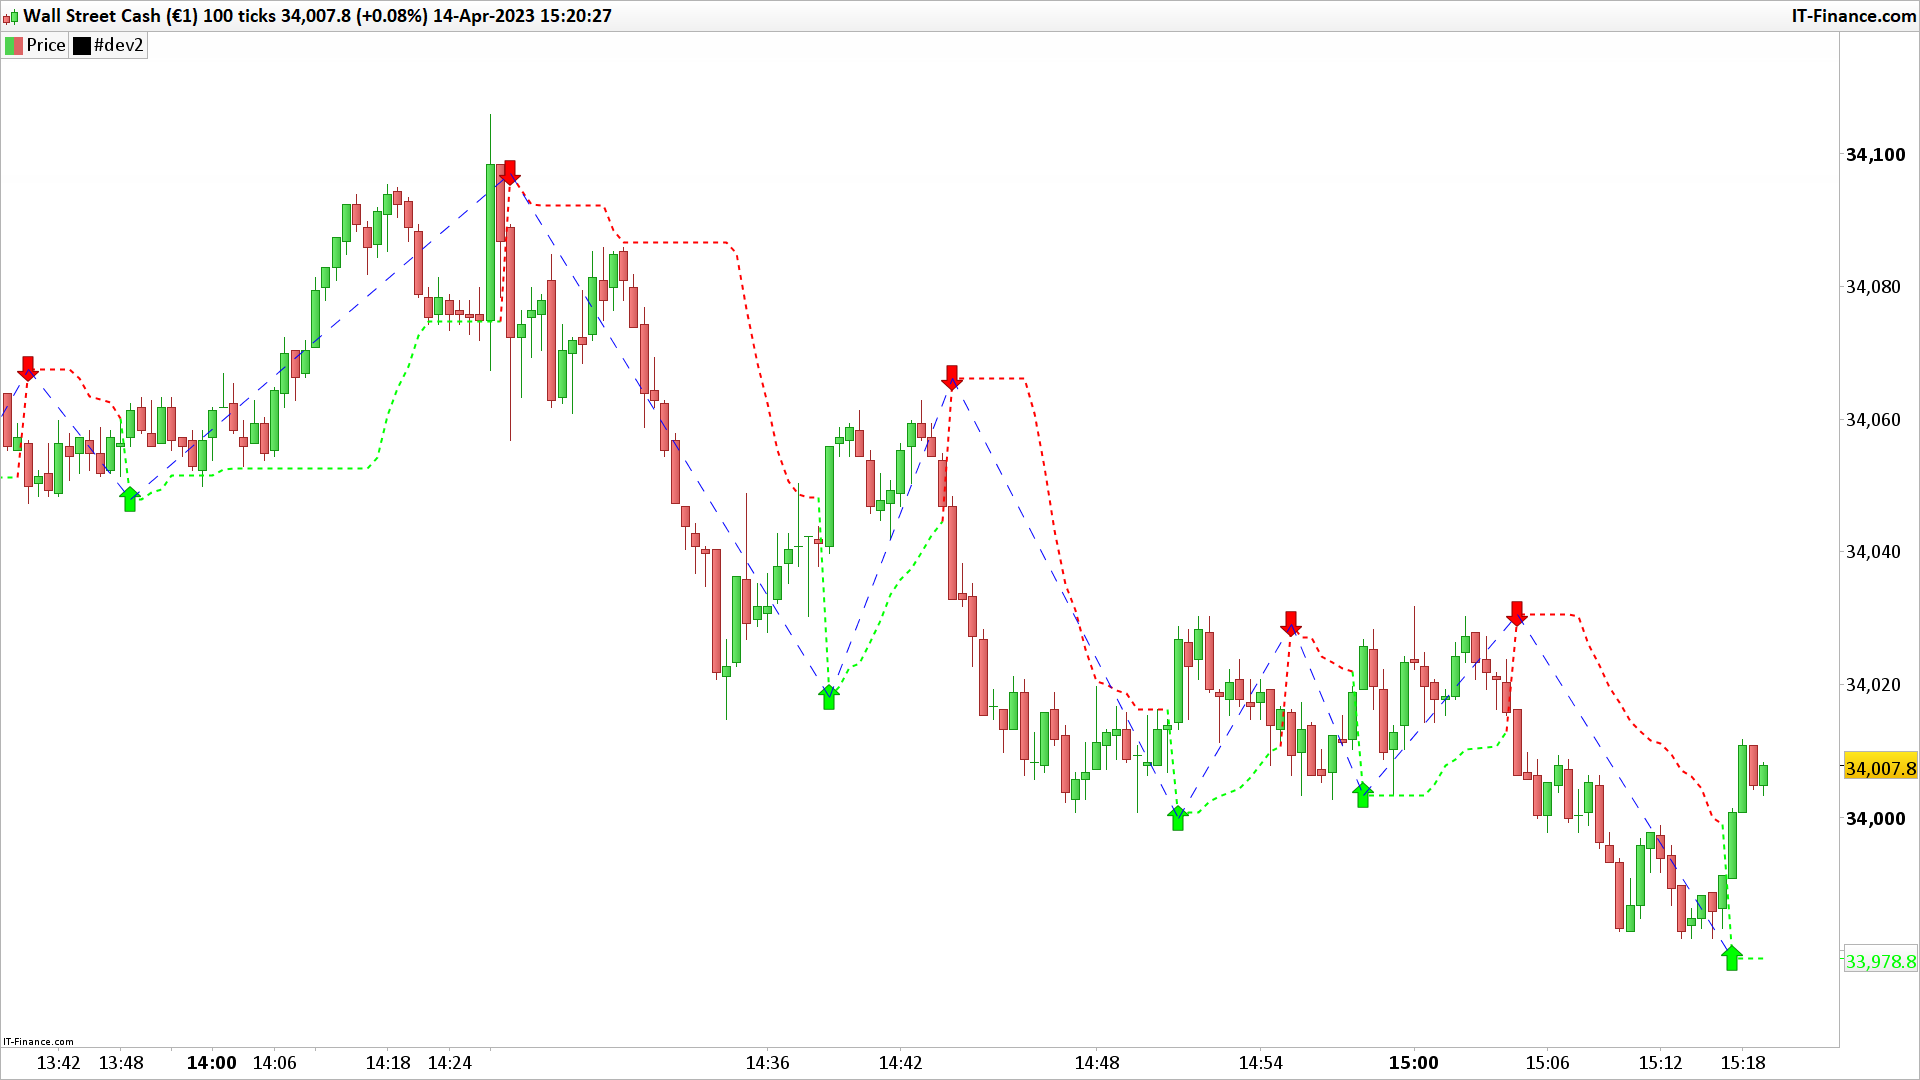
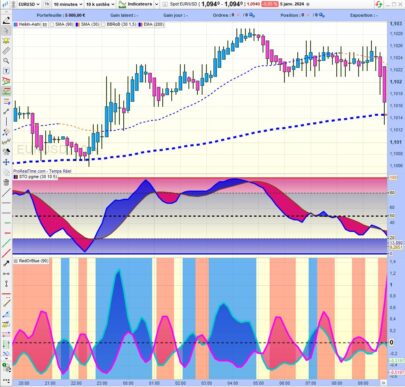
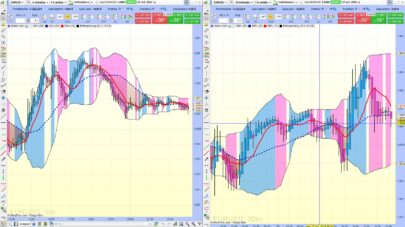
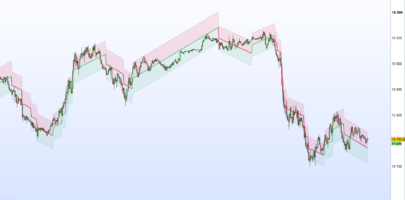
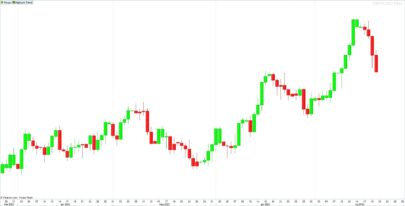
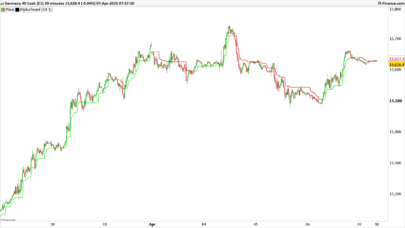
The Buy Sell Magical Trend indicator is a “trailing stop” style indicator made of trend inversion obtained with Bollinger Bands. SignalPeriod is the period of the Bollinger bands and ArrowPeriod the standard deviation applied to it.
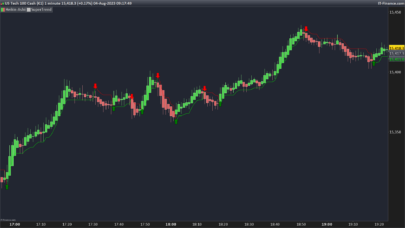
The arrows are painted on the breakthrough of the other side band with segments connecting the 2 most recent arrows.
|
1 2 3 4 5 6 7 8 9 10 11 12 13 14 15 16 17 18 19 20 21 22 23 24 25 26 27 28 29 30 31 32 33 34 35 36 37 38 39 40 41 42 43 44 45 46 47 48 49 50 51 52 |
//PRC_BuySell Magic | indicator //17.04.23 //Nicolas @ www.prorealcode.com //Sharing ProRealTime knowledge // --- settings SignalPeriod = 12 ArrowPeriod = 2 // --- end of settings bbup = average[signalperiod]+std[signalperiod]*arrowperiod bbdn = average[signalperiod]-std[signalperiod]*arrowperiod if ts=0 then if close crosses over bbup then ts=bbdn trend=1 elsif close crosses under bbdn then ts=bbup trend=-1 endif endif if trend=1 then ts=max(ts,bbdn) elsif trend=-1 then ts=min(ts,bbup) endif if trend=1 and close crosses under ts then trend=-1 ts=bbup r=255 g=0 drawarrowdown(barindex,ts) coloured("red") drawsegment(startbar,startts,barindex,ts) style(dottedline2) coloured("blue") startbar=barindex startts=ts endif if trend=-1 and close crosses over ts then trend=1 ts=bbdn r=0 g=255 drawarrowup(barindex,ts) coloured("lime") drawsegment(startbar,startts,barindex,ts) style(dottedline2) coloured("blue") startbar=barindex startts=ts endif return ts coloured(r,g,0) style(dottedline,2) |
Share this
No information on this site is investment advice or a solicitation to buy or sell any financial instrument. Past performance is not indicative of future results. Trading may expose you to risk of loss greater than your deposits and is only suitable for experienced investors who have sufficient financial means to bear such risk.
ProRealTime ITF files and other attachments :
Find other exclusive trading pro-tools on ![]()
PRC is also on YouTube, subscribe to our channel for exclusive content and tutorials


Bonjour Nicolas, génial cet indicateur, plutôt précis (67% de trades gagnants) merci 🙂
C’est “magical” ! Bonne continuation 🙂
Bonjour, quelle est la meilleure UT pour travailler avec cet indicateur?
@RICOU en 1 minutes avec un filtre de tendance ZLSMA 200 et eventuellement un rsi 7 , 69% de trade gagnant rr 1.5
Hello Nicolas, just started having a look on this last indicator : what timeframe this default parameters are working better? and as forex than indeces? thank you 🙂
I don’t know, this is your part 🙂
Bonjour Nicolas…..
est-il possible de construire un écran …. merci
Merci d’ouvrir un sujet sur le forum avec une description complète du screener.
Bonjour Nicolas, est il possible d’avoir un codage complet d’un trade automatique avec les paramètres de cet indicateur ?
Oui, merci d’ouvrir un sujet dans le forum ProOrder pour créer une stratégie avec cet indicateur.
Hallo Nicolas eine Tolle Arbeit, wie immer !!!! Eine Frage zu Deinem Indikator, könntest du es so bauen, das man ein Signal auf die Pfeile setzen kann ???? Danke
Ändern Sie die letzte Zeile des Codes mit:
return ts coloured(r,g,0) style(dottedline,2), trend as “trend direction”
um den Trend zu erhalten (1=grün, -1=rot)
Danke Nicolas, vielleicht habe ich mich verkehrt ausgedrückt, ich will gerne einen Alarm auf dem Pfeil haben um damit Automatisch einen Trade zu beginnen. Wenn das so möglich wäre ??? Nicht als Algo einfach nur in der Alarmeinstellung, um nicht ständig den Bildschirm zu beobachten müssen. Vielen Dank
das ist richtig, man kann die Warnungen nicht codieren, also muss man das integrierte Tool der Plattform verwenden.
Ich Denke, ich habe es begriffen, in den Alarmeinstellung einfach, kreuzt über Wert 1, als Buy und kreuzt unter Wert -1, als Sell. Nochmals Danke
Merci pour votre travail.
For people interested in the screener: https://www.prorealcode.com/topic/screener-buy-sell-magic-indicator/#post-214201
For people interested in a strategy: https://www.prorealcode.com/topic/buy-sell-magical-trend/
Gracias NJicolas. Las lineas 35 y 36 dan fallo. (¿Es adrede para iniciados?)
Puedes corregir porfa? Gracias.
Salut Nicholas, comment exécuter ce fichier dans les métadonnées
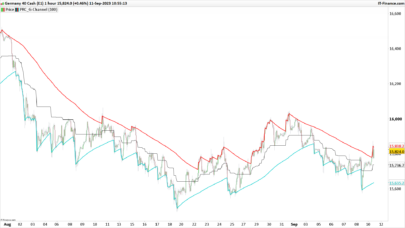
Bravo ! Cet indicateur est un suiveur de tendance, type “stop and reverse”, inspiré des canaux de volatilité.
Il fonctionne bien en tendance mais peut donner de faux signaux en range.
C’est un outil robuste, populaire, à condition de bien régler les paramètres selon l’actif et la période.
Points forts :
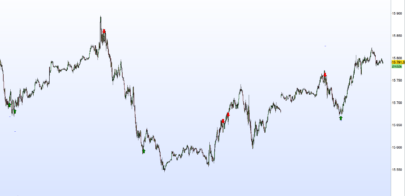
Clarté : L’indicateur donne des signaux nets, faciles à lire sur le graphique.
Suit les tendances : Il permet de “coller” à la tendance du marché, en sortant lors des retournements majeurs.
Approche “stop and reverse” : Toujours en position (long ou short), pas de période à l’écart du marché.
Approche éprouvée : La logique est proche de SuperTrend ou Donchian Channel, connus pour leur robustesse.
Limites / Points de vigilance :
Beaucoup de faux signaux en marché range : Comme tout indicateur de tendance, il peut donner des entrées/sorties inutiles sur un marché plat ou sans volatilité.
Réactivité dépend des paramètres : Si SignalPeriod ou ArrowPeriod sont trop faibles, on aura trop de signaux ; trop élevés, tu risques de rater le début des mouvements.
Pas de filtre de volatilité : Il n’intègre pas d’ATR ou de filtre pour ignorer les “bruits” de marché.
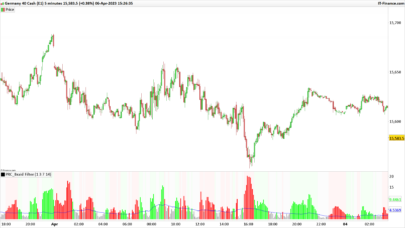
Version améliorée avec filtres ATR et volume : les signaux d’achat/vente ne sont générés que lorsque la volatilité (ATR) et le volume dépassent des seuils définis, afin de limiter les faux signaux et ne prendre position que sur les phases actives du marché (on peut régler l’ATR et Volume au besoin)
// PRC_BuySell Magic02 – Version filtrée ATR et Volume pour UT 1mn
SignalPeriod = 12
ArrowPeriod = 2
ATRperiod = 14
StartHour = 8
EndHour = 18
bbup = average[SignalPeriod] + std[SignalPeriod] * ArrowPeriod
bbdn = average[SignalPeriod] – std[SignalPeriod] * ArrowPeriod
myATR = average[ATRperiod](tr)
// Initialisation
if barindex = 0 then
ts = 0
trend = 0
startbar = 0
startts = 0
endif
// Entrée initiale avec filtres
if ts = 0 and myATR > 0.60 and volume > 100 and (hour >= StartHour and hour 0.60 and volume > 100 and (hour >= StartHour and hour 0.60 and volume > 100 and (hour >= StartHour and hour <= EndHour) then
trend = 1
ts = bbdn
r = 0
g = 255
drawarrowup(barindex, ts) coloured("lime")
drawsegment(startbar, startts, barindex, ts) style(dottedline2) coloured("blue")
startbar = barindex
startts = ts
endif
return ts coloured(r, g, 0) style(dottedline, 2)
Bonjour Leduc71, j’ai l’impression qu’il y a des erreurs dans la première ligne de code qui suit “//Entrée initiale avec filtres”.
Il semble manque quelques “)” et des autres choses . Peut-être aussi des prune-and-graft trop précipités et seulement de mots en plus.