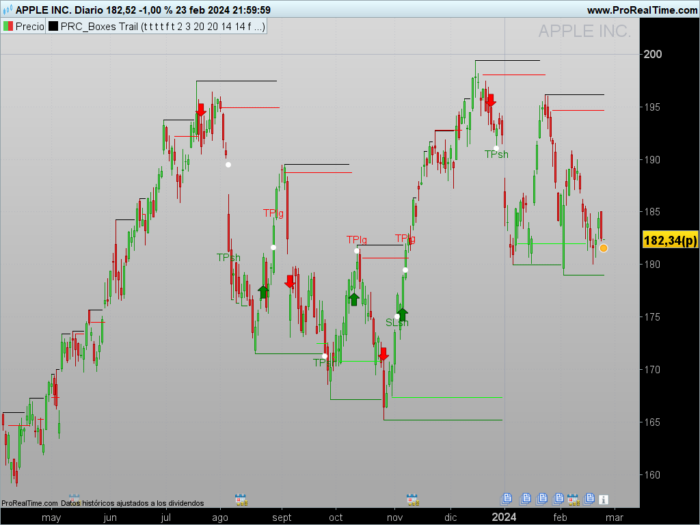
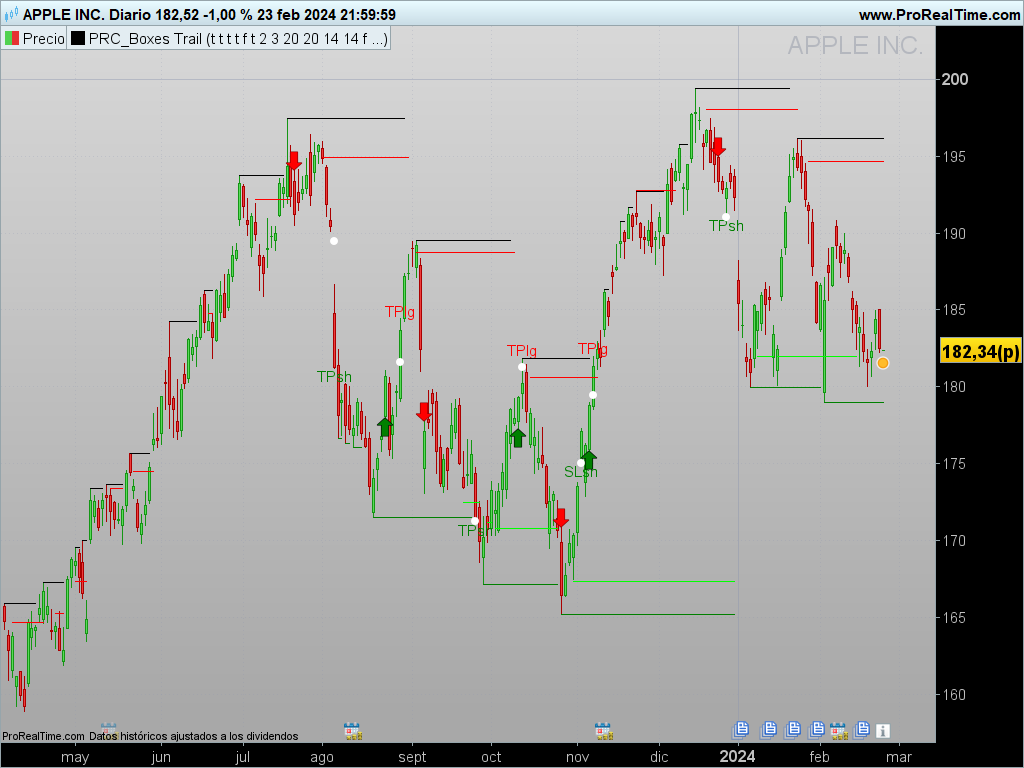
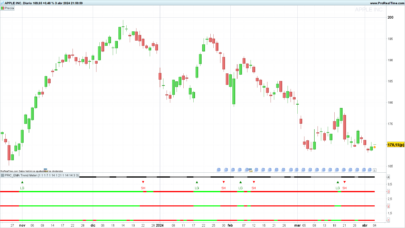
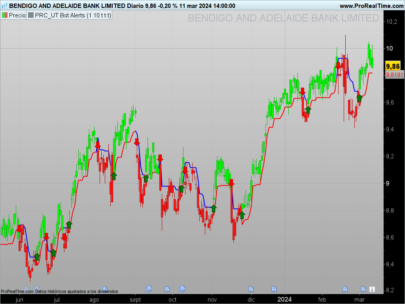
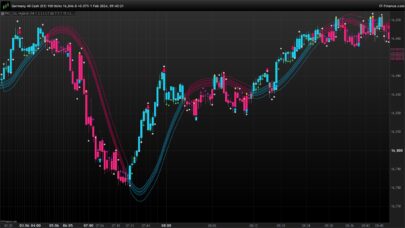
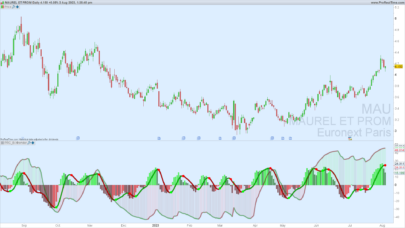
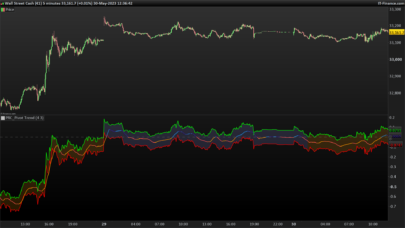
This is an indicator named Boxes Trail. It’s designed to identify trading opportunities based on the identification of dynamic support and resistance levels, in addition to applying a trading methodology trend indicators.
Here’s a summary of how it works:
Core Structure
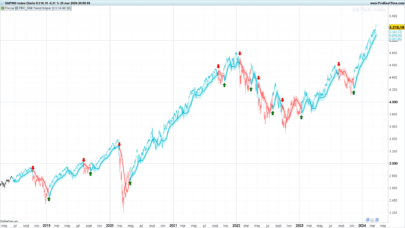
Dynamic Support and Resistance:
It uses an approach to plot support and resistance lines based on the highest and lowest prices within a defined period (length1 for support/resistance and barlength for additional calculations). These lines dynamically adjust based on specific conditions related to price and volume.
Modified Hull Moving Average (SHMMA):
A SHMMA is calculated to identify the trend and generate buy or sell signals based on the price’s position relative to this modified average.
Trading Strategy
Entry and Exit Conditions:
The system defines specific conditions for buy (longCond) and sell (shortCond) signals, based on the crossing of dynamically calculated support and resistance lines.
Pyramiding:
Allows controlling the accumulation of positions under certain conditions, limiting the number of consecutive entries without an exit.
Risk Management:
Incorporates options to define a Take Profit (TP) and Stop Loss (SL) as a percentage of the entry price, allowing traders to secure profits and limit losses.
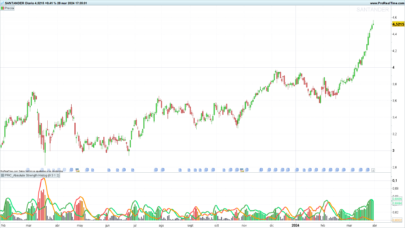
Climax Indicators and Market Condition
Climax Analysis:
Uses various conditions based on price analysis to classify bars into categories like climax up/down. This helps to identify the strength behind price movements and potentially predict trend changes.
Trend Conditions:
The script assesses the current market trend to adjust entry and exit strategies, as well as to optimize the placement of TP and SL orders.
Alerts and Signals
Offers the ability to generate conditional alerts for buy and sell signals, as well as for reaching TP and SL targets. This allows traders to be informed of critical moments to make decisions.
Customization and Configuration
Customizable Inputs:
Allows users to adjust various parameters, such as the length of support/resistance, the length of the SHMMA, the brick size for ATR or traditional values, and the sensitivity of entry and exit conditions.
Visualization and Overlay:
Provides options to visualize or hide certain elements on the chart, enabling users to focus on the most relevant information for their trading strategy.
This script represents a complex and customizable tool for traders looking for strategies based on dynamic support/resistance, trend and price analysis, with a focus on risk management through TP and SL. The flexibility in settings allows adapting the system to different trading styles and individual preferences.
|
1 2 3 4 5 6 7 8 9 10 11 12 13 14 15 16 17 18 19 20 21 22 23 24 25 26 27 28 29 30 31 32 33 34 35 36 37 38 39 40 41 42 43 44 45 46 47 48 49 50 51 52 53 54 55 56 57 58 59 60 61 62 63 64 65 66 67 68 69 70 71 72 73 74 75 76 77 78 79 80 81 82 83 84 85 86 87 88 89 90 91 92 93 94 95 96 97 98 99 100 101 102 103 104 105 106 107 108 109 110 111 112 113 114 115 116 117 118 119 120 121 122 123 124 125 126 127 128 129 130 131 132 133 134 135 136 137 138 139 140 141 142 143 144 145 146 147 148 149 150 151 152 153 154 155 156 157 158 159 160 161 162 163 164 165 166 167 168 169 170 171 172 173 174 175 176 177 178 179 180 181 182 183 184 185 186 187 188 189 190 191 192 193 194 195 196 197 198 199 200 201 202 203 204 205 206 207 208 209 210 211 212 213 214 215 216 217 218 219 220 221 222 223 224 225 226 227 228 229 230 231 232 233 234 235 236 237 238 239 240 241 242 243 244 245 246 247 248 249 250 251 252 253 254 255 256 257 258 259 260 261 262 263 264 265 266 267 268 269 270 271 272 273 274 275 276 277 278 279 280 281 282 283 284 285 286 287 288 289 290 291 292 293 294 295 296 297 298 299 300 301 302 303 304 305 306 307 308 309 310 311 312 313 314 315 316 317 318 319 320 321 322 323 324 325 326 327 328 329 330 331 332 333 334 335 336 337 338 339 340 341 342 343 344 345 346 347 348 349 350 351 352 353 354 355 356 357 358 359 360 |
//PRC_BOXES TRAIL //version = 0 //26.02.24 //Iván González @ www.prorealcode.com //Sharing ProRealTime knowledge ////////////////////////////////////////////////// //inputs length1 = 20 //Support / Resistance length barlength = 20 //Bar length length = 14 //Length src = customclose //Source mode = 0 //ATR or Traditional modevalue = 14 showoverlay=0//Boolean use2bars=0//Boolean lookback=100 isTPl = 1 //Boolean // take profit long isTPs = 1 //Boolean // take profit short tp = 2 //% take profit isSLl = 1 //Boolean // stop loss long isSLs = 1 //Boolean // stop loss short sl = 3 //% stop loss ////// ////Resistance lines if high>=highest[length1](high) then t1 = 0 top1 = high else top1 = top1 t1 = t1+1 drawsegment(barindex - t1,top1,barindex,top1)coloured("black") endif ////Support lines if low<=lowest[length1](low) then b1 = 0 bot1 = low else bot1 = bot1 b1 = b1+1 drawsegment(barindex - b1,bot1,barindex,bot1)coloured("green") endif ///// factor = 0 slope = 0 for i=1 to length do factor = 1+2*(i-1) slope = slope + (src[i-1])*(length-factor)/2 next shmma = average[length](src)+6*slope/((length+1)*length) if shmma >= highest[barlength](shmma) then top2 = shmma t2 = 0 else top2 = top2 t2 = t2+1 drawsegment(barindex-t2,top2,barindex,top2)coloured("red") endif if shmma <= lowest[barlength](shmma) then bot2 = shmma b2 = 0 else bot2 = bot2 b2 = b2+1 drawsegment(barindex-b2,bot2,barindex,bot2)coloured("lime") endif ////bricksize if mode then bricksize = averagetruerange[round(modevalue)] else bricksize = modevalue endif //// if barindex < 2 then propen = 0 ropen = 0 rclose = 0 else propen = ropen[1] if close > propen+bricksize or high > propen+bricksize then ropen = propen+bricksize elsif close < propen-bricksize or low < propen-bricksize then ropen = propen-bricksize else ropen = propen endif if ropen > propen then rclose = ropen-bricksize elsif ropen < propen then rclose = ropen+bricksize else rclose = rclose[1] endif if ropen > propen then direction = 1 r=0 g=255 b=0 elsif ropen < propen then direction = -1 r=120 g=0 b=0 else direction = direction[1] endif if showoverlay then drawtext("✚",barindex,ropen)coloured(r,g,b) drawtext("•",barindex,rclose)coloured("gray") endif endif /////////// range1=high-low+0.000000001 range2=highest[2](high)-lowest[2](low)+0.000000001 if close > open and range1<>0 then value1=(range1/(2*range1+open-close))*close elsif close < open and range1<>0 then value1=((range1+close-open)/(2*range1+close-open))*close elsif close=open then value1=close else value1 = value1 endif value2=close-value1 ///using only one bar value3 = abs(value1+value2) value4 = value1*range1 value5 = (value1-value2)*range1 value6 = value2*range1 value7 = (value2-value1)*range1 value8 = value1/range1 value9 = (value1-value2)/range1 value10 = value2/range1 value11 = (value2-value1)/range1 value12 = value3/range1 // Using two bars if use2bars then value13 = value3+value3[1] value14 = (value1+value1[1])*range2 value15 = (value1+value1[1]-value2-value2[1])*range2 value16 = (value2+value2[1])*range2 value17 = (value2+value2[1]-value1-value1[1])*range2 value18 = (value1+value1[1])/range2 value19 = (value1+value1[1]-value2-value2[1])/range2 value20 = (value2+value2[1])/range2 value21 = (value2+value2[1]-value1-value1[1])/range2 value22 = value13/range2 endif // one bar conditions condition1 = value3 = lowest[lookback](value3) condition2 = value4 = highest[lookback](value4) and close > open condition3 = value5 = highest[lookback](value5) and close > open condition4 = value6 = highest[lookback](value6) and close < open condition5 = value7 = highest[lookback](value7) and close < open condition6 = value8 =lowest[lookback](value8) and close < open condition7 = value9 =lowest[lookback](value9) and close < open condition8 = value10 =lowest[lookback](value10) and close > open condition9 = value11 =lowest[lookback](value11) and close > open condition10 = value12 =highest[lookback](value12) // two bar conditions condition11 = use2bars and value13 = lowest[lookback](value13) condition12 = use2bars and value14 =highest[lookback](value14) and close > open and close[1] > open[1] condition13 = use2bars and value15 =highest[lookback](value15) and close > open and close[1] > open[1] condition14 = use2bars and value16 =highest[lookback](value16) and close < open and close[1] < open[1] condition15 = use2bars and value17 =highest[lookback](value17) and close < open and close[1] < open[1] condition16 = use2bars and value18 =lowest[lookback](value18) and close < open and close[1] < open[1] condition17 = use2bars and value19 =lowest[lookback](value19) and close < open and close[1] < open[1] condition18 = use2bars and value20 =lowest[lookback](value20) and close > open and close[1] > open[1] condition19 = use2bars and value21 =lowest[lookback](value21) and close > open and close[1] > open[1] condition20 = use2bars and value22 =highest[lookback](value22) //Classifying the bars using one bar conditions, or using both one bar and two bar conditions simultaneosly if "use2bars" button selected. lowvolume = (condition1 or condition11) climaxupvolume = (condition2 or condition3 or condition8 or condition9 or condition12 or condition13 or condition18 or condition19) climaxdownvolume = (condition4 or condition5 or condition6 or condition7 or condition14 or condition15 or condition16 or condition17) churnvolume = (condition10 or condition20) climaxchurnvolume = (condition10 or condition20) and (condition2 or condition3 or condition4 or condition5 or condition6 or condition7 or condition8 or condition9 or condition12 or condition13 or condition14 or condition15 or condition16 or condition17 or condition18 or condition19) if barindex<2 then trend=1 supplyline=high supportline=low elsif close>supplyline[1] then trend=1 elsif close<supportline[1] then trend=-1 else trend=trend[1] endif if trend=1 then if climaxdownvolume then supplyline=highest[2](high) elsif high>supplyline[1] then supplyline=high else supplyline=supplyline[1] endif else if climaxdownvolume then supplyline=highest[2](high) else supplyline=supplyline[1] endif endif if trend=-1 then if climaxupvolume then supportline=lowest[2](low) elsif low < supportline[1] then supportline=low else supportline=supportline[1] endif else if climaxupvolume then supportline=lowest[2](low) else supportline=supportline[1] endif endif if trend=-1 then trailing2 = supportline else trailing2 = supplyline endif if trend=1 then trailing1 = supportline else trailing1 = supplyline endif longcond = trailing2 crosses over trailing1 shortcond = trailing2 crosses under trailing1 if barindex < 2 then sectionlongs=0 sectionshorts=0 else if longcond then sectionlongs=sectionlongs+1 sectionshorts=0 elsif shortcond then sectionlongs=0 sectionshorts=sectionshorts+1 endif endif // Pyramiding pyrl = 1 // These check to see your signal and cross references it against the pyramiding settings above // These check to see your signal and cross references it against the pyramiding settings above longCondition = longCond and sectionLongs <= pyrl shortCondition = shortCond and sectionShorts <= pyrl if barindex < 2 then lastopenlongCondition=0 lastopenshortCondition=0 lastlongCondition = 0 lastshortCondition = 0 else // Get the price of the last opened long or short if longCondition then lastopenlongCondition = open else lastopenlongCondition = lastopenlongCondition[1] endif if shortCondition then lastopenshortCondition = open else lastopenshortCondition = lastopenshortCondition[1] endif // Check if your last postion was a long or a short if longCondition then lastlongCondition = barindex else lastlongCondition = lastlongCondition[1] endif if shortCondition then lastshortCondition = barindex else lastshortCondition = lastshortCondition[1] endif endif inlongcondition = lastlongcondition > lastshortcondition inshortcondition = lastlongcondition < lastshortcondition // Take profit longTP = isTPl and high crosses over (1+(tp/100))*lastopenlongCondition and longcondition = 0 and inlongcondition shortTP = isTPs and low crosses under (1-(tp/100))*lastopenshortCondition and shortcondition = 0 and inshortcondition // Stop Loss longSL = isSLl and low crosses under (1-(sl/100))*lastopenlongCondition and longcondition = 0 and inlongcondition shortSL = isSLs and high crosses over (1+(sl/100))*lastopenshortCondition and shortcondition = 0 and inshortcondition // Create a single close for all the different closing conditions. if barindex < 2 then lastlongClose = 0 lastshortClose = 0 else if longTP or longSL then longclose = 1 lastlongclose = barindex else longclose = 0 lastlongclose = lastlongclose[1] endif if shortTP or shortSL then shortclose = 1 lastshortclose = barindex else shortclose = 0 lastshortclose = lastshortclose[1] endif endif // Signals if longcondition then drawarrowup(barindex,low-0.15*averagetruerange[10](close))coloured("green") elsif shortcondition then drawarrowdown(barindex,high+0.15*averagetruerange[10](close))coloured("red") endif if longTP and lastlongCondition>lastlongclose[1] then drawtext("TPlg",barindex,high+0.15*averagetruerange[10](close))coloured("red") drawpoint(barindex,(1+(tp/100))*lastopenlongcondition,2)coloured("white") elsif shortTP and lastshortCondition>lastshortclose[1] then drawtext("TPsh",barindex,low-0.15*averagetruerange[10](close))coloured("green") drawpoint(barindex,(1-(tp/100))*lastopenshortcondition,2)coloured("white") elsif longSL and lastlongcondition>lastlongclose[1] then drawtext("SLlg",barindex,high+0.15*averagetruerange[10](close))coloured("red") drawpoint(barindex,(1-(sl/100))*lastopenlongcondition,2)coloured("white") elsif shortSL and lastshortcondition>lastshortclose[1] then drawtext("SLsh",barindex,low-0.15*averagetruerange[10](close))coloured("green") drawpoint(barindex,(1+(sl/100))*lastopenshortcondition,2)coloured("white") endif return |
Share this
No information on this site is investment advice or a solicitation to buy or sell any financial instrument. Past performance is not indicative of future results. Trading may expose you to risk of loss greater than your deposits and is only suitable for experienced investors who have sufficient financial means to bear such risk.
ProRealTime ITF files and other attachments :
Find other exclusive trading pro-tools on ![]()
PRC is also on YouTube, subscribe to our channel for exclusive content and tutorials


Hallo Ivan, vielen Dank für diesen sehr schönen Indikator. Könnte man den Code ändern, so das man auf das Kauf- und Verkaufssignal ein Alarm setzen kann um schnell in ein Trade zu gehen. Gruß und Danke im Voraus
Norbert
I’ve created a screener to show [longcondition or shortcondition]
Hi
You should delete from the indicator code all drawing functions and all variables not used for screener calculations.
//PRC_BOXES TRAIL
//version = 0
//26.02.24
//Iván González @ http://www.prorealcode.com
//Sharing ProRealTime knowledge
//////////////////////////////////////////////////
//inputs
length1 = 20 //Support / Resistance length
barlength = 20 //Bar length
length = 14 //Length
src = customclose //Source
mode = 0 //ATR or Traditional
modevalue = 14
use2bars=0//Boolean
lookback=100
////Resistance lines
if high>=highest[length1](high) then
t1 = 0
top1 = high
else
top1 = top1
t1 = t1+1
endif
////Support lines
if low<=lowest[length1](low) then
b1 = 0
bot1 = low
else
bot1 = bot1
b1 = b1+1
endif
/////
factor = 0
slope = 0
for i=1 to length do
factor = 1+2*(i-1)
slope = slope + (src[i-1])*(length-factor)/2
next
shmma = average[length](src)+6*slope/((length+1)*length)
if shmma >= highest[barlength](shmma) then
top2 = shmma
t2 = 0
else
top2 = top2
t2 = t2+1
endif
if shmma <= lowest[barlength](shmma) then
bot2 = shmma
b2 = 0
else
bot2 = bot2
b2 = b2+1
endif
////bricksize
if mode then
bricksize = averagetruerange[round(modevalue)]
else
bricksize = modevalue
endif
////
if barindex < 2 then
propen = 0
ropen = 0
rclose = 0
else
propen = ropen[1]
if close > propen+bricksize or high > propen+bricksize then
ropen = propen+bricksize
elsif close < propen-bricksize or low < propen-bricksize then
ropen = propen-bricksize
else
ropen = propen
endif
if ropen > propen then
rclose = ropen-bricksize
elsif ropen < propen then
rclose = ropen+bricksize
else
rclose = rclose[1]
endif
if ropen > propen then
direction = 1
elsif ropen < propen then
direction = -1
else
direction = direction[1]
endif
endif
///////////
range1=high-low+0.000000001
range2=highest[2](high)-lowest[2](low)+0.000000001
if close > open and range1<>0 then
value1=(range1/(2*range1+open-close))*close
elsif close < open and range1<>0 then
value1=((range1+close-open)/(2*range1+close-open))*close
elsif close=open then
value1=close
else
value1 = value1
endif
value2=close-value1
///using only one bar
value4 = value1*range1
value5 = (value1-value2)*range1
value6 = value2*range1
value7 = (value2-value1)*range1
value8 = value1/range1
value9 = (value1-value2)/range1
value10 = value2/range1
value11 = (value2-value1)/range1
// Using two bars
if use2bars then
value14 = (value1+value1[1])*range2
value15 = (value1+value1[1]-value2-value2[1])*range2
value16 = (value2+value2[1])*range2
value17 = (value2+value2[1]-value1-value1[1])*range2
value18 = (value1+value1[1])/range2
value19 = (value1+value1[1]-value2-value2[1])/range2
value20 = (value2+value2[1])/range2
value21 = (value2+value2[1]-value1-value1[1])/range2
endif
// one bar conditions
condition2 = value4 = highest[lookback](value4) and close > open
condition3 = value5 = highest[lookback](value5) and close > open
condition4 = value6 = highest[lookback](value6) and close < open
condition5 = value7 = highest[lookback](value7) and close < open
condition6 = value8 =lowest[lookback](value8) and close < open
condition7 = value9 =lowest[lookback](value9) and close < open
condition8 = value10 =lowest[lookback](value10) and close > open
condition9 = value11 =lowest[lookback](value11) and close > open
// two bar conditions
condition12 = use2bars and value14 =highest[lookback](value14) and close > open and close[1] > open[1]
condition13 = use2bars and value15 =highest[lookback](value15) and close > open and close[1] > open[1]
condition14 = use2bars and value16 =highest[lookback](value16) and close < open and close[1] < open[1]
condition15 = use2bars and value17 =highest[lookback](value17) and close < open and close[1] < open[1]
condition16 = use2bars and value18 =lowest[lookback](value18) and close < open and close[1] < open[1]
condition17 = use2bars and value19 =lowest[lookback](value19) and close < open and close[1] < open[1]
condition18 = use2bars and value20 =lowest[lookback](value20) and close > open and close[1] > open[1]
condition19 = use2bars and value21 =lowest[lookback](value21) and close > open and close[1] > open[1]
//Classifying the bars using one bar conditions, or using both one bar and two bar conditions simultaneosly if “use2bars” button selected.
climaxupvolume = (condition2 or condition3 or condition8 or condition9 or condition12 or condition13 or condition18 or condition19)
climaxdownvolume = (condition4 or condition5 or condition6 or condition7 or condition14 or condition15 or condition16 or condition17)
if barindex<2 then
trend=1
supplyline=high
supportline=low
elsif close>supplyline[1] then
trend=1
elsif close<supportline[1] then
trend=-1
else
trend=trend[1]
endif
if trend=1 then
if climaxdownvolume then
supplyline=highest[2](high)
elsif high>supplyline[1] then
supplyline=high
else
supplyline=supplyline[1]
endif
else
if climaxdownvolume then
supplyline=highest[2](high)
else
supplyline=supplyline[1]
endif
endif
if trend=-1 then
if climaxupvolume then
supportline=lowest[2](low)
elsif low < supportline[1] then
supportline=low
else
supportline=supportline[1]
endif
else
if climaxupvolume then
supportline=lowest[2](low)
else
supportline=supportline[1]
endif
endif
if trend=-1 then
trailing2 = supportline
else
trailing2 = supplyline
endif
if trend=1 then
trailing1 = supportline
else
trailing1 = supplyline
endif
longcond = trailing2 crosses over trailing1
shortcond = trailing2 crosses under trailing1
if barindex < 2 then
sectionlongs=0
sectionshorts=0
else
if longcond then
sectionlongs=sectionlongs+1
sectionshorts=0
elsif shortcond then
sectionlongs=0
sectionshorts=sectionshorts+1
endif
endif
// Pyramiding
pyrl = 1
// These check to see your signal and cross references it against the pyramiding settings above
// These check to see your signal and cross references it against the pyramiding settings above
longCondition = longCond and sectionLongs <= pyrl
shortCondition = shortCond and sectionShorts <= pyrl
if barindex < 2 then
lastopenlongCondition=0
lastopenshortCondition=0
lastlongCondition = 0
lastshortCondition = 0
else
// Get the price of the last opened long or short
if longCondition then
lastopenlongCondition = open
else
lastopenlongCondition = lastopenlongCondition[1]
endif
if shortCondition then
lastopenshortCondition = open
else
lastopenshortCondition = lastopenshortCondition[1]
endif
// Check if your last postion was a long or a short
if longCondition then
lastlongCondition = barindex
else
lastlongCondition = lastlongCondition[1]
endif
if shortCondition then
lastshortCondition = barindex
else
lastshortCondition = lastshortCondition[1]
endif
endif
screener[longcondition or shortcondition]
Hallo Ivan, Danke das ist Perfekt !! Kannst du bitte in der Screener-Bibliothek die itf. hochladen und was meinst du mit : ( Sie sollten aus dem Indikatorcode alle Zeichenfunktionen und alle Variablen löschen ) Läuft der Screener nicht unabhängig vom Indikator ??